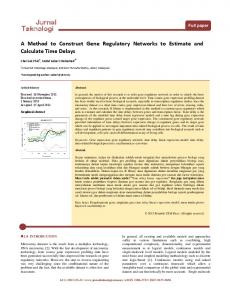
A simple method to localize and estimate PMD in optical fibers using the polarization optical time domain reflectometry technique Carolina Franciscangelis, Claudio Floridia, Livia R. Alves and Fabiano Fruett State University of Campinas, Unicamp Av. Albert Einstein, 400 – Barão Geraldo Campinas - SP, Brazil and CPqD Foundation Rod.Campinas- Mogi Mirim, Km 118,5 Campinas - SP, Brazil
[email protected]
Abstract: A method for PMD localization and estimation is proposed based in polarization optical time reflectometry technique, pOTDR. The method consists in launching a light pulse in an optical fiber under test and then analyzes the spatial power ripple distribution originated from Rayleigh backscattered signal after passing through a polarizer. Both localization and PMD magnitude are function of OTDR’s pulse width and can be obtained from the ripple analysis, enabling the characterization of the fiber portion by the relation between OTDR’s pulse width and PMD measurement ranges. 1. Introduction Polarization mode dispersion (PMD) is defined as a modal dispersion in which light travelling along a waveguide in two different polarization modes experiences a speed change in these modes caused by the waveguide’s intrinsic imperfections or external agents such as temperature and stress. High PMD in installed fibers is prejudicial for the correct operation of the system, because it limits the rate at which data is transmitted over the fiber [1]. Although nowadays the fibers are rigorously specified for low values of PMD, erstwhile the PMD on fibers was not even measured before being installed. Therefore, maintaining an appropriate fiber communication system requires a reliable PMD locator and measurer and that is what we suggest in this article using the pOTDR technique. As a light pulse propagates through an optical fiber, it continuously suffers Rayleigh scattering due to small index variations along the fiber and because of that a fraction of the scattered light returns to the launching point. The pOTDR method consists in launching an optical pulse from a commercial OTDR in an optical fiber and after analyzes the behavior of the backscattering light polarization along the fiber’s length. The measurement system we propose here is able to correlate the polarization behavior of the backscattered light with the PMD in the analyzed fiber section and the pulse width of the OTDR. 2. Setup and Method Description When a light pulse propagates through a high PMD fiber section, its state of polarization, SOP, shifts faster than it would if the pulse was propagating through a low PMD fiber section [2]. It happens due the relation between PMD and an optical fiber parameter of birefringence known as beat length, expressed by LB = λ ∆n , where ∆n is the differential effective refractive index between the two light propagating modes in an optical fiber and λ is the optical wavelength. Beat length is the distance needed to be travelled by an optical signal in order to repeat its initial SOP and is related with PMD by the equation ∆τ / L = λ /(cLB ) , where ∆τ/L is the fiber’s DGD per kilometer or birefringence and DGD, differential group delay, also known as first order PMD. High PMD fiber have high birefringence and therefore shorter beat lengths than those with low PMD, what makes the SOP changes faster in the first one. The proposed measurement setup consists in a commercial OTDR, two optical circulators, C1 and C2, and a polarizer, as shown in Fig.1a. In this proposed pOTDR, the SOP variations of the Rayleigh backscattered signals are traduced in an amplitude change of the OTDR trace due the presence of the polarizer. However, depending on the pulse width that the OTDR launches in the fiber, the SOP variations cannot be observed. In Fig. 1b, we depict schematically the SOP changes along the fiber. In the upper figure, the pulse width corresponds to a length which matches the beat length, so the SOP changes can be observed as a ripple in the proposed scheme. However, if the
pulse width is much greater than the beat length, as in the bottom of Fig. 1b, no ripple variation will be detected. Thus by using different pulse widths it is possible to estimate the PMD of a fiber link and its localization in the fiber. Indeed, for the same pulse width, a section of fiber link with ripple in the pOTDR trace means a low PMD fiber section and a section with no ripple means a high PMD section. In other words, varying the pulse width, the transition between ripple and no-ripple condition, enables to obtain a lower and an upper limit of PMD. (b)
(a)
Pulse width
Pulse width
The SOP changes along the fiber
Fig. 1. (a) Experimental setup of the proposed pOTDR method. (b) Schematic representation of SOP variations along fiber and its relation with pulse width.
Thus, the method for PMD localization and estimation consists in two stages. First, OTDR references traces were obtained bypassing the polarizer and the circulators for each instrument’s pulse width. Those traces must be as straight as possible. The second stage consists in analyze the absolute value of the difference between the reference OTDR trace and the pOTDR trace, measure defined as the ripple. If the ripple is greater than 0.15dB, a value empirically determined by analyzing many fibers sections, then the actual pulse width is defined as the first pulse width with ripple, FPWR and the previous is defined as the last pulse without ripple, LPWR. Through the relation between pulse width and birefringence presented in Table 1, is possible to determine a birefringence value range, which lower and upper limits values are defined by the birefringence related with the LPWR and the FPWR, respectively. Then, by multiplying the birefringence limits values with the length of the fiber section we can easily obtain the PMD range values. Table 1. Relation between an OTDR’s laser pulse width and a fiber’s birefringence value. Pulse Width [ns]
Birefringence [ps/km]
10 20 50 100 500 1000
1.293 0.646 0.259 0.129 0.026 0.013
3. Experimental Results and Conclusions In order to validate the proposed method, we tested it for a setup composed of four fibers with different PMD. Table 2 shows the characteristics of each one of them, measured with a commercial OTDR and a commercial PMD meter. Table 2. Characteristics of the setup tested using the proposed method. SETUP Type Length [km] PMD [ps] Birefringence [ps/km]
FIBER1 Standard 4.4 0.05 0.011
FIBER2 High PMD 1.5 21.2 14.3
FIBER3 High PMD 4.4 5.25 1.19
FIBER4 DCF 3.0 0.45 0.15
25
Fiber 1
20
Fiber 2 Fiber 3
Fiber 4
15
10 0.5 0.4 0.3 0.2 0.1 0.0
Optical Power (dBm)
(a)
Threshold
0
2
4
6
8
10
12
14
Ripple (dB)
Ripple (dB)
Optical Power (dBm)
25
(b)
Fiber 1
Fiber 2
20
Fiber 3
10 0.5 0.4 0.3 0.2 0.1 0.0
Threshold
0
2
4
Distance (km) 40
Fiber 1
Fiber 2
20
Fiber 3
15 0.5 0.4 0.3 0.2 0.1 0.0
Optical Power (dBm)
(c)
25
Fiber 4
Threshold
0
2
4
6
8
6
8
10
12
14
Distance (km)
Ripple (dB)
Ripple (dB)
Optical Power (dBm)
30
Fiber 4
15
10
12
14
(d) Fiber 2
Fiber 1
35
Fiber 3
30
Fiber 4
25 0.5
Threshold 0.0 0
2
4
6
8
10
12
14
Distance (km)
Distance (km)
Fig. 2. Obtained optical power traces of the analyzed setup for different pulse widths using the pOTDR proposed method. Respectively: (a) 10 ns, (b) 20 ns, (c) 50 ns, (d) 1000 ns pulse widths. The inset in the bottom figures are the ripple and the threshold used to define roughness.
The experimental pOTDR traces for different pulse widths and their ripples are shown in Fig. 2. From analysis of Fig. 2, it is possible to identify the highest PMD section as the FIBER2. Indeed, this is the trace whose optical power ripple do not appear even for the shortest pulse width available, 10 ns, what means that the birefringence of this section is greater than 1.293 ps/km, see Table 1, or PMD greater than 1.94 ps. Carrying out ripple analysis as previously explained it is possible to obtain ranges of PMD (upper and lower PMD limits) of the fiber sections. Table 3 shows the results and compares the PMD expected values (obtained by conventional method, measuring each fiber section separately) with the pOTDR estimated values. Table 3. Comparison between the theoretical and measured PMD values for each fiber section.
FIBER1 FIBER2 FIBER3 FIBER4
Expected PMD [ps] 0.05 21.2 5.25 0.45
Measured PMD range [ps] PMD1.94 5.69>PMD>2.84 0.78>PMD>0.39
First pulse width with ripple [ns] 1000ns Less than 10ns 10ns 50ns
Last pulse width without ripple [ns] Greater than 1000ns 10ns 20ns 100ns
The results presented in Table 3 authenticate the proposed PMD localization and estimation method. It was able to localize the high PMD section, FIBER2, and, moreover, made it possible to classify the fibers’ sections in PMD ranges which are quite consistent with the expected PMD value obtained by a commercial PMD meter. As next goals we might mention tests in other kind of fiber setups, an improvement of the software analysis and field tests in installed fibers, in order to reinforce the technique’s reliability. 4. References [1] S. V. Shatalin and A. J. Rogers, “Location of High PMD Sections of Installed System Fiber,” JLT Vol. 24, Nº11 3875-3881 (2006). [2] B. Huttner, B. Gisin and N. Gisin, “Distributed PMD measurement with a Polarisation-OTDR in optical fibers,” JLT Vol. 17, Nº10 1843-1855 (1999).