A simple model for assessing utilisable streamflow allocations in the context of the Ecological Reserve DA Hughes
Institute for Water Research, Rhodes University, Grahamstown 6140, South Africa
Abstract A simple model is proposed that simulates the water balance in small- to medium-sized water resource systems (without major storage) and displays the results as flow duration curves so that they can be compared with the standard information available for the Ecological Reserve requirements. The model is designed to account for the impacts of streamflow reduction activities (afforestation), small farm dams and run-of-river abstractions under both present-day and future scenario situations. The paper presents the operation of the model and its data requirements, as well as discussing possible sources of uncertainty associated with either the model approach or the quality of the data inputs. The majority of the uncertainty in the ability of the model to generate reliable results is expected to be associated with the quality of the input data, and specifically the information available on existing water use. It should be noted, however, that any water resource systems model is faced with the same uncertainties and this highlights the need to improve the South African database on existing water use. Without such information, future planning of water allocations will be extremely difficult and highly uncertain.
Keywords: water allocations, environmental water requirements, water resource modelling
Introduction In terms of the National Water of 1998 (NWA, 1998) all existing and future water users will eventually have to be licensed and this licensing process must account for the water requirements of both the basic human needs and Ecological Reserves. In simple terms these are the water requirements that must be met before other users are permitted to abstract water. They are designed to provide a basic source of water to communities living in the vicinity of the resource, as well as ensuring the environmental sustainability of the resource. Utilisable streamflow allocations, in the context of this paper, are therefore the difference between the total natural resource and the requirements of the two Reserves. One of the main difficulties with determining water availability lies in the inherent natural variability of river flows and South Africa is known to have some of the most variable river flow regimes in the world (McMahon, 1979; Görgens and Hughes, 1982). This characteristic frequently makes it very difficult to design sustainable abstraction schemes and suggests that abstractions for certain purposes can only be permitted with limited levels of assurance. The concept of assurance of water supply becomes extremely important in highly variable flow regimes where there is a great deal of competition for the limited amounts of water that are available during dry periods (dry seasons or drought periods). In simple terms, this concept means that during dry periods users will not be able to gain access to their normal water requirements and will necessarily have to curtail their abstractions. This is clearly the reason why reservoirs are constructed to store water during wet periods and sustain abstractions (from the stored water) during dry periods. The approach to defining environmental water requirements (the Ecological Reserve) in South Africa recognises the natural variability of flow regimes and that some of that variability needs +2746 6224014; fax: +2746 6229427; e-mail:
[email protected] Received 14 February 2006; accepted in revised form 20 March 2006.
Available on website http://www.wrc.org.za ISSN 0378-4738 = Water SA Vol. 32 No. 3 July 2006 ISSN 1816-7950 = Water SA (on-line)
to be preserved to ensure some level of protection for the riverine biota (King and Louw, 1998; Puckridge et al., 1998). The advantage from a water supply point of view is that the water requirements of the Reserve should be at a minimum when the natural flow is at a minimum and there is the greatest competition for water. Even without the added complication of allowing for the Ecological Reserve, determining water allocations and associated assurance rules for a range of users distributed throughout a river basin can be a relatively complex process. The Reserve adds to that complexity and one of the criticisms that have been levelled at the Reserve and the outputs of the RDM (resource directed measures) process is that it is very difficult to implement. One of the steps within a typical Reserve determination process is to assess the feasibility of satisfying the Reserve as well as present-day and future water-user requirements (Louw et al., 2000). Typically, this type of analysis has been undertaken using a system yield model in which the Ecological Reserve is treated as a high priority user and one of the objectives is to identify possible conflicts. This type of approach has proved to be very successful and allows different scenarios of water abstraction and conservation management to be examined and recommendations made to decision makers (including water resource managers and river basin stakeholders). System yield models available within South Africa have been designed to account for a wide variety of basin and water-use configurations including streamflow reduction activities (SFRA – afforestation, for example), reservoirs (and associated abstractions and releases), inter-basin transfers, distributed small farm dams, run-of-river abstractions, return flows (from agriculture and wastewater treatment works) and the Ecological Reserve (Janse van Rensburg and Görgens, 2001). There is little doubt that models of this type represent the most thorough and appropriate approach to assessing various water resource development options within a basin. However, they can also be time-consuming to establish and require substantial resources in terms of human technical expertise.
411
One of the critical issues associated with the design of a simple model that can be easily applied by a wide range of users is that it should be based on data that are readily accessible. In terms of a model designed to assess water availability and use, the following categories of information will be required: •
•
•
A time series of natural monthly flow. The WR90 (Midgley et al., 1994) database provides these data for all quaternary catchments in the country, while Hughes (2004a) has offered some suggestions for scaling the WR90 data for subquaternary scales. Data that define the Ecological Reserve requirements. The standard approach to distributing the results of an Ecological Reserve determination is a table, for each calendar month, of flows required with 10 levels of assurance (see later section of this paper). Separate tables are provided for the full Reserve requirement (high and low flows) and for just low flows. These tables can also be generated by the Desktop Reserve Model (Hughes and Hannart, 2003) that represents a rapid approach to generating a low confidence estimate using regional parameters. Information on existing SFRA and water uses in the catchment. This should include all run-of-river abstractions as well as farm dams (with associated catchment areas, volumes and abstractions). There is little doubt that these are the information requirements that will frequently be difficult to satisfy, although the development of the WARMS (Water Use Authorisation Management System) database by the Department of Water Affairs and Forestry (DWAF) should address this issue in the future.
412
The water abstraction information should include annual volumes of water use (at different levels of assurance, where relevant and available), as well as the seasonal distribution. The annual volumes appear to be captured on the WARMS database, while seasonal distributions can be estimated from the type of water use (domestic, irrigation, industry, etc.). With respect to irrigation water use, the SAPWAT model (Crosby and Crosby, 1999) could provide an estimate of the seasonal distributions of typical water use if the crop type is known.
Basic modelling concepts To keep the model as simple as possible it was originally decided to base the estimations of present day and future conditions on modifications to the natural calendar month flow duration curves (FDCs). FDCs have been used extensively in hydrological and water resource analyses, both in South Africa, as well as elsewhere (Browne et al., 2005; Lane et al., 2005; Smakhtin et al., 2006). An additional motivation for basing the model on the analysis of FDCs is the fact that they are used to define Ecological Reserve requirements in South Africa (Hughes and Hannart, 2003).
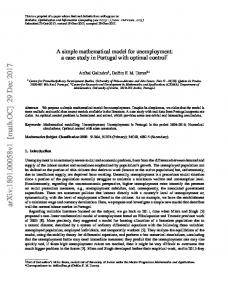
Flow duration curves and assurance or operating rules Figure 1 illustrates some of the concepts behind the use of flow duration curves and assurance rules within the model. The solid line without symbols represents the natural flow duration curve (FDC) that can be obtained from the WR90 natural flow time series data. The remaining lines represent the assurance or operating rules of some of the water ‘uses’. Effectively, the ‘operating rule’ for water use by forestry can be represented as a percentage reduction in flow at different FDC % points. The dashed line therefore represents the FDC characteristics after the impacts of afforestation (20% of the area under pine trees, in the example provided in Fig. 1) have been accounted for. This curve has been constructed on the basis of data supplied by Gush (2005) which are derived from a re-analysis of the data used to construct the afforestation SFRA (Gush et al., 2002). The streamflow reductions March 100
3
Data requirements and availability
Information about future planned water uses in the catchment. This information will normally be available as it will be required as part of a licence application.
•
Flow volume (m * 106)
The constraints of time and human technical expertise would be unlikely to be an issue in relatively large systems, where complex water resource planning and management issues necessarily require complex solutions. However, the strict implementation of the National Water Act of 1998 suggests that regional water resource managers are required to make decisions about new water abstraction licence applications on a routine and regular basis. Frequently, these decisions will be required in smaller basins where a systems yield model has not yet been established and where there are constraints of time, budget and human resources. This paper proposes a simple approach that is based on the best available information and that does not require either a great deal of time or technical expertise to obtain an approximate assessment of the feasibility of granting a new licence for river water abstractions or an SFRA. It is not proposed as a competing alternative to more complex system yield models, but should rather be viewed as a preliminary analysis method that can be used in relatively small and simple water resource systems. The model is designed to account for three types of water use; streamflow reduction activities (afforestation), the effects of distributed farm dams and associated abstractions and run-ofriver abstractions. The model is not designed to account for the operation of major dams that might involve controlled releases of low and high flows. It is assumed that, in such situations, a system yield model would have already been established as part of the reservoir design phase and therefore that the simple model proposed here would not be appropriate. Despite the number of major reservoirs that exist within South Africa, there are still many catchments where a model of this type can be considered applicable.
Natural After SFRA Total Reserve Irrigation Domestic
10
1
0.1 10
20
30
40
50
60
70
80
90
100
% Time Equalled or Exceeded (Assurance)
Figure 1 Natural flow duration curve for quaternary catchment B81D in March, with additional lines representing the impact of 20% afforestation (pine), the total Ecological Reserve requirements (Category C), irrigation and domestic water requirements
Available on website http://www.wrc.org.za ISSN 0378-4738 = Water SA Vol. 32 No. 3 July 2006 ISSN 1816-7950 = Water SA (on-line)
due to afforestation (pine, eucalypt or wattle on deep, moderate or shallow soils) are available as the percentage of the natural flow for 10, 20, 50, 80 and 90% exceedance levels (FDC % points) and it is a trivial matter to extrapolate to additional % points. The operating rule for the Ecological Reserve is normally expressed as flow requirements at different % points on the natural FDC. This information is output from the Desktop Reserve Model (Hughes and Hannart, 2003) or is the standard format of information supplied from the RDM Office of DWAF. Runof-river water uses are normally defined as requirements with different levels of assurance. The irrigation requirement line in Fig. 1 is based on a normal March requirement (with 80% assurance of supply) of 0.5x 10⁶ m3, but with an assumed curtailment to 50% of normal with an assurance of 90% and zero supply for the remaining 10% of the time. The domestic supply line is based on a demand of 0.3 x 10⁶ m3 that is met 80% of the time. It is further assumed that decreases of 10% and 20% will be achieved through restrictions during drought periods of different magnitudes. The assumption in the model is that curtailments of run-of-river abstractions will be based on the volume of natural flow in the river using the FDC % points. It should be clear that most of the water resource components in relatively simple situations can be reduced to FDCs or assurance rule curves, which are fully compatible with each other given the assumption that curtailments and restrictions on supply are driven by the drought flow status of the river. If the irrigation and domestic requirement lines were to be added to the Reserve line the result would be a total flow ‘requirement’ (it is assumed that the Reserve is the requirement at the outlet of the catchment and that the other requirements are fully utilised within the catchment). This could then be compared with the total available water, or the dashed line. If the two cross, this simple analysis would indicate that there is not enough water to satisfy all requirements.
Small farm dams As part of the development of this simple model, the results of simulating various configurations of farm dams (storage volumes, contributing catchment areas, seasonal abstraction patterns) in a variety of quaternary catchments with different flow
regimes using a hydrological model (the monthly Pitman model) have been analysed. The intention was to identify patterns of flow duration curve impacts that could be generalised on the basis of the flow regime type and the farm dam/abstraction characteristics. It was not possible to find any patterns that could be reliably generalised and it was therefore considered necessary to adopt a time series simulation approach to estimating the effects of farm dams and associated evaporation and abstraction losses. The modelling process The first step in the modelling process is to convert the time series of natural monthly flow data (from WR90) to calendar month FDCs. The revised SFRA database (Gush, 2005) is then used, together with user-supplied present-day afforestation information (% of the catchment covered by pines, eucalypts and wattle as well as the soil depth type – see Fig. 2), to generate reduction factors for 17 FDC percentage points (0.5, 1, 5, 10, 15, 20, 30, 40, 50, 60, 70, 80, 85, 90, 95, 99, 99.5). The second component of the model performs simple water balance calculations on the time series of natural flows given the user-supplied small farm dam information. The natural flow in each month of the time series is interpreted as an FDC % point (using the calendar month FDCs) and the appropriate forestry reduction factor applied. The resulting flow multiplied by the fraction of the catchment contributing to farm dams becomes the dam inflow, while the monthly abstraction determines the losses from the dam. Any overflows are combined with the natural flow (reduced by the forestry reduction factor) from the remaining fraction of the catchment. To reduce data input requirements, evaporation losses and rainfall on the dam surface are not explicitly accounted for in the model. If it is considered necessary to include evaporative losses, net evaporation (mean monthly potential evaporation minus mean monthly rainfall) could be incorporated into the annual dam abstraction parameter and the seasonal distribution (Fig. 2). While spatial coverages of small farm dam information are available and additional information on abstraction from farm dams is available from WARMS, neither of these provide the required information in a suitable format. It will therefore be relatively difficult to quantify the farm dam parameters of the model from existing information.
Figure 2 Data input/editing screen for the model including the selection options for the graphical displays
Available on website http://www.wrc.org.za ISSN 0378-4738 = Water SA Vol. 32 No. 3 July 2006 ISSN 1816-7950 = Water SA (on-line)
413
The next part of the model process for the present-day scenario is to calculate the appropriate run-of-river abstraction for each month from the appropriate abstraction parameter (based on the assurance level defined by the natural flow calendar month FDC % level) and the seasonal distributions. It is important to note that the basis for selecting the appropriate abstraction assurance level is the % point on the specific calendar month FDC (i.e. the FDC constructed from only the flows in that calendar month) and not the period of record FDC (i.e. the FDC constructed from all flows in the time series). If the latter were to be used, it is inevitable that in strongly seasonal flow regimes all the curtailments would occur in the dry season. One of the issues associated with using monthly flow data that has been frequently recognised is that not all of the volume of flow within a month is available for run-of-river abstraction when there is little or no storage involved. This is because the majority of the volume associated with high flows during the month will not be accessible to abstractors. There are two approaches to resolving this issue: • Disaggregate the monthly flow into daily flows and perform the analysis on the daily flows • Separate the total monthly volume (after the impacts of afforestation and farm dams) into the high-flow and lowflow components and assume that only the low flows are accessible to the run-of-river abstractors Any method of incorporating the former approach into the software will almost certainly depend on representative daily flow data, which may not be available for many areas of the country. In contrast, default parameters of a monthly, digital filtering, baseflow separation process have already been established for all quaternary catchments in South Africa (Hughes et al., 2003). The monthly total flows remaining after afforestation and farm dam impacts are therefore subjected to baseflow separation and the run-of-river abstractions deducted from the baseflows only. The separated high-flow component can then be added back to generate the final modified time series after the effects of all three water uses (afforestation, farm dams and run-of-river abstractions) have been accounted for. The final time series is then reduced to 12-calendar month FDCs for display purposes. The whole analysis is repeated for the future scenario and
the end result is a set of calendar month FDCs for natural-, present- and future-flow scenarios that can be compared with the Reserve requirements expressed in the same way.
The application environment The simple model has been implemented as part of the SPATSIM modelling framework (Hughes, 2004b). The use of SPATSIM facilitates access to default information (natural flow time series, forestry reduction factors, Desktop Reserve Model results and parameters, etc.) and a facility for storing the wateruse parameters. If additional natural flow data, or alternative Reserve requirement information, need to be generated the necessary models have already been incorporated as part of the framework. SPATSIM also contains a facility for recording metadata within memo type attributes that can be used to store comments about data sources and quality. A link to existing WARMS data is also currently under development which will eventually allow information within the WARMS database to be aggregated to the catchment scale.
Display options and results interpretation Figure 2 illustrates that an option of showing the results for total flow or baseflows only has been included in the software. Selecting either of these options does not affect the way in which the model runs, but potentially affects the interpretation of the results. For example, if the specified run-of-river abstractions cannot be met by the low-flow component of the monthly flows, this does not mean that the total modified flow in that month will be zero. It does, however, mean that the low flow will be zero and this feature will only be identified correctly if the ‘Baseflows only’ display option is selected. It follows that if this option is selected, the ‘Excluding high flows’ Reserve requirements display option should also be selected and this is done automatically. If time series of present-day conditions (and/or a future scenario) have been generated by a different model, these can be incorporated into the input data and this model used to display the results as FDCs. Figure 3 shows a grey scale screen copy of the output of the model (which is displayed with a colour coded key on the
Figure 3 Graphical display screen for the model (refer to text for further explanation)
414
Available on website http://www.wrc.org.za ISSN 0378-4738 = Water SA Vol. 32 No. 3 July 2006 ISSN 1816-7950 = Water SA (on-line)
screen). The left-hand side displays the three FDCs (natural – top line, present day – 2nd from top and future scenario – 3rd from top) for the selected month, together with the Reserve requirements (bottom line). The right-hand side shows the results for all months at one selected FDC % point (the line orders are the same). These graphs can readily be used to interpret the impacts of the present day and future scenario in various ways: • If either the present-day or future scenario FDCs cross (are lower than) the Reserve requirement line, it is apparent that the Reserve would not be met if the specified abstractions were to be permitted. • If the length of time of zero flow for the present-day or future scenario FDCs is greater than the zero flow duration of the natural FDC, it is clear that the specified abstractions (and associated assurances in the case of the run-of-river abstractions) are not possible, regardless of the Reserve requirements. • If there is an impact due to alien vegetation (wattle, for example), the future scenario could include a reduction of this area through clearing and the results used to assess the additional water available to other users. The display screen includes buttons that allow the graphs to be printed or saved as graphics files for use in a report, as well as a facility to output the results as a text file for further processing, e.g. in a spreadsheet program. There is also an option to display some decision support information (Fig. 4). This screen analyses the difference between the selected scenario FDCs (presentday or future) and the Reserve requirement and presents these differences for 5 FDC % points (50, 70, 80, 90 and 99). Zero or negative differences are reported as a problem, while those months where the Reserve is within 75% of the present-day flow, or within 90% of a future scenario flow are identified as potential problems.
Sources of uncertainty With any model used in water resource management decision making it is of great importance to recognise the sources of uncertainty that are inherent in the use of the model. The sources of uncertainty may be associated with the modelling approach or with the quality and accuracy of the input data. With respect to the former, the main uncertainty in the model formulation lies in the simple water balance approach used for assessing the impacts of farm dams. A further source of uncertainty in the modelling approach is associated with the use of a monthly time step and the fact that run-of-river abstractions are assumed to be evenly distributed throughout the month. The other sources of uncertainty will be largely associated with the input data. • It is assumed that the default natural flow data will be the time series available from the WR90 database. These are simulated data based on model calibrations against a limited amount of available observed streamflow data which were subjected to a process of naturalisation. There are inevitably uncertainties in the naturalisation process as well as the regional calibration of the model parameters. These uncertainties are difficult to quantify and will be highly variable across different parts of the country. However, it is important to note that the results of the model presented in this paper will be very dependent upon the accuracy of the lowflow simulations. It is also important to note that the same flow data time series will almost certainly have been used in the Reserve determination process and any errors will have been propagated into the Reserve requirements. • Additional uncertainties will exist in the Reserve requirement data, depending upon the degree of confidence in the Reserve determination process. If a comprehensive or intermediate determination had been undertaken, it may be assumed that reasonable confidence can be expressed in the Reserve data, as they will have been checked against
Figure 4 Decision support display screen for the model (refer to text for further explanation)
Available on website http://www.wrc.org.za ISSN 0378-4738 = Water SA Vol. 32 No. 3 July 2006 ISSN 1816-7950 = Water SA (on-line)
415
•
•
the best available biological information. At the other end of the scale, it is accepted that estimates using the Desktop Reserve Model with default regional parameters will contain a much higher degree of uncertainty. The forestry reduction factors are based on the outputs from a hydrological simulation model (Gush et al., 2002) and are subject to a relatively high degree of uncertainty due to the lack of observed data on forestry impacts at the quaternary catchment scale. The data are provided as reductions for 100% forest cover under three different soil-depth categories. There will be uncertainty associated with the assumption of a specific soil depth category, as well as the linear scaling method used for less than 100% spatial coverage of forest. The SFRA reduction factors are based on running the ACRU model (Schulze, 2000) for natural baseline conditions and for the different forest coverages. However, there is a degree of uncertainty associated with the fact that baseline conditions assumed for the ACRU model simulations could be different to the baseline (or natural) conditions assumed during the naturalisation process undertaken during the WR90 study. The other sources of uncertainty are associated with the ability of the model user to accurately define the presentday water uses within the catchment and represent these in an integrated way using the simple model parameters. As already indicated, it is apparent that the information available on ‘real’ existing water use in many parts of the country is sadly lacking or inaccurate. This is one of the main stumbling blocks facing the successful implementation of a model of this type and it appears to be a problem that is widely recognised and accepted by many regional water resource managers (Hughes, 2004b). While the WARMS database represents a serious attempt by DWAF to address this issue, it is apparent that limitations exist in terms of staff resources and the willingness or ability of existing water users to supply accurate information.
Most of these sources of uncertainty are equally applicable to any of the available system yield models that also operate on a monthly time step and are reliant upon the same or similar sources of information. Perhaps the major difference is that there is an expectation when applying a complex model that a substantial amount of the time involved in establishing the model application will be spent on data collection and checking, while the model discussed here is meant to be applied easily and quickly. Although it cannot be stated categorically, it is unlikely that the sources of uncertainty are additive. For example, if the low flows of the natural hydrology are over-estimated, the application of the Desktop Reserve Model will result in excessive low-flow requirements. The difference between them (i.e. the water available for abstractions) might therefore be similar if the low flows had not been over-estimated. It is frequently assumed that the volumes of existing water use in the WRMS database are over-estimates, an assumption based on the premise that existing water users have over-stated their use to protect their future sources. If this is in fact the case, it will result in future applications for water use suggesting that there is too little water available and a more detailed analysis of the ‘real’ situation will be required to evaluate an abstraction licence application. While this may involve more investigative work before regional water managers can finalise licence applications, at least it is unlikely to lead to over-allocation and associated problems.
416
Discussion and conclusions It should again be emphasised that the model discussed in this paper is only appropriate for small- to medium-sized water resource systems that are relatively homogeneous from a hydrological response point of view and that do not include any major water storage components that can be used to supplement low flows with controlled releases. With that constraint in mind, it should offer a rapid method for evaluating a present-day situation (to assess, for example, whether a defined Ecological Reserve is able to be satisfied), as well as being able to evaluate possible future scenarios (to undertake a preliminary evaluation of a licence application for abstractions or SFRAs, for example). One of the main limitations with respect to the application of the model is the lack of adequately accurate and readily accessible information on existing water uses. If these data were available at a quaternary scale for the whole country and incorporated into an existing SPATSIM application, the value of the proposed model would be increased substantially. It should, however, be recognised that this limitation applies to any water resource system model that could be used for the same purposes as this model is intended. This paper has focused on the development of the model, rather than providing examples that test the capabilities of the model. Any future tests of the model will necessarily have to account for the input data uncertainties referred to above. However, it should be possible to find suitable catchments where the model can be tested. The ideal situation would be where a long record of gauged flows exists and where water resource developments (abstractions and SFRA) have changed the flows from being close to natural to highly modified. One improvement that could be considered is to add the effects of groundwater abstractions on surface water resources. There is still a great deal of uncertainty about how this could be achieved in such a simple model in a realistic manner. However, the developments that have been made in terms of adding more explicit groundwater functions to the widely used Pitman monthly model (Hughes, 2004c; Hughes and Parsons, 2005) offer an opportunity to investigate simplified methods of linking groundwater abstractions to impacts on low flows in rivers. A final point is that if a model of this type is to be acceptable to a wide range of users, it is essential that it is linked to input data sources that are accepted as being the ‘best’ available. This is the main reason for making use of WR90 flow data (or the most recent update within a specific region), Ecological Reserve data in the format distributed by the DWAF RDM Office, the Gush SFRA data and WARMS data (where possible) on existing water uses. As one or more of these data sources are updated and improved by other groups, the results that are generated by this simple model will be similarly improved.
Acknowledgements Part of the motivation for the development of the software was a result of the involvement of the IWR in a Water Research Commission-funded project entitled ‘Development of hydrological procedures and tools to support the implementation of the water quantity component of the Ecological Reserve for rivers’ (K8/510). The author is also grateful to many individuals involved in resolving issues associated with the implementation of the 1998 Water Act and who have indirectly contributed to this paper through discussions with the author.
Available on website http://www.wrc.org.za ISSN 0378-4738 = Water SA Vol. 32 No. 3 July 2006 ISSN 1816-7950 = Water SA (on-line)
References BROWNE AE, ZHANG L, MCMAHON, TA, WESTERN AW and VERTESSY RA (2005) A review of paired catchment studies for determining changes in water yield resulting from alterations in vegetation. J. Hydrol. 310 (1-4) 28-61. CROSBY CT and CROSBY CP (1999) A Computer Program for Establishing Irrigation Requirements and Scheduling Strategies in South Africa: Executive Summary. WRC Report No. 624/1/99. Water Research Commission, Pretoria, South Africa. GÖRGENS AHM and HUGHES DA (1982) Synthesis of streamflow information relating to the semi-arid Karoo biome of South Africa. S. Afr. J. Sci. 78 58-68. GUSH MB (2005) Personal communication. Environmentek, CSIR, Pietermaritzburg, South Africa. GUSH MB, SCOTT DF, JEWITT GPW, SCHULZE RE, LUMSDEN TG, HALLOWES LA and GÖRGENS AHM (2002) Estimation of Streamflow Reductions Resulting from Commercial Afforestation in South Africa. WRC Report No. TT 173/02. Water Research Commission, Pretoria, South Africa. HUGHES DA (2004a) Problems of estimating hydrological characteristics for small catchments based on information from the South African national surface water resource database. Water SA 30 (3) 393-398. HUGHES DA (ed.) (2004b) SPATSIM, an integrating framework for Ecological Reserve determination and implementation. WRC Report No. TT 245/04. Water Research Commission, Pretoria, South Africa. HUGHES DA (2004c) Incorporating ground water recharge and discharge functions into an existing monthly rainfall-runoff model. Hydrol. Sci. J. 49(2) 297-311. HUGHES DA and HANNART P (2003) A desktop model used to provide an initial estimate of the ecological instream flow requirements of rivers in South Africa. J. Hydrol. 270 (3-4) 167-181. HUGHES DA, HANNART P and WATKINS D (2003) Continuous baseflow separation from time series of daily and monthly streamflow data. Water SA 29 (1) 43-48.
Available on website http://www.wrc.org.za ISSN 0378-4738 = Water SA Vol. 32 No. 3 July 2006 ISSN 1816-7950 = Water SA (on-line)
HUGHES DA and PARSONS R (2005) Improved explicit ground water recharge and discharge simulation methods for the Pitman model – explanation and example applications. Proc 12th S. Afr. Natl. Hydrol. Symp. (available on CD). Midrand, South Africa, Sept. 2005. JANSE VAN RENSBURG J and GÖRGENS AHM (2001) Komati basin: Juxtaposing conflicting water resources interests via a water resources systems model. Proc. 10th S. Afr. Natl. Hydrol. Symp. (available on CD) University of Natal, Pietermaritzburg, South Africa. Sept. 2001. KING J and LOUW D (1998) Instream flow assessments for regulated rivers in South Africa using the building block methodology. Aquat. Ecosyst. Health Manage. 1 109-124. LANE PNJ, BEST AE, HICKEL K and ZHANG L (2005) The response of flow duration curves to afforestation. J. Hydrol. 310 (1-4) 253265. LOUW D, HUGHES DA and BIRKHEAD A (2000) The IFR process: beyond the specialist workshop. Afr. J. Aquat. Sci. 25 183-190. McMAHON TA (1979) Hydrological characteristics of arid zones. Proc. Symp. Hydrology of Areas of Low Precipitation. IAHS Publ. No 128. Canberra Symposium, Australia. Dec. 1979. 105-123. MIDGLEY DC, PITMAN WV and MIDDLETON BJ (1994) Surface Water Resources of South Africa 1990. Vols I-VI. WRC Reports No. 298/1.1/94 to 298/6.1/94. Water Research Commission, Pretoria, South Africa. NWA (1998) National Water Act of South Africa. Act 26 of 1998. Government Printer, Pretoria. 200 pp. PUCKRIDGE JT, SHELDON F, WALKER KF and BOULTON AJ (1998) Flow variability and the ecology of large rivers. Mar. Freshwater Res. 49 55-72. SMAKHTIN VU, SHILPAKAR RL and HUGHES DA (2006) Hydrology-based assessment of environmental flows: An example from Nepal. Hydrol. Sci. J. 51 (2) 207-222. SCHULZE RE (2000) Modelling hydrological responses to land use and climate change: A southern African perspective. Ambio 29 12-22.
417