Nov 29, 2016 - Simultaneous Estimation of Naproxen and Rabeprazole. Mohammad Firoz Khan ... simultaneously which will reduce the analysis time and cost significantly. However, the ... Application of the developed method. As combined ...
Journal of Applied Pharmaceutical Science Vol. 6 (11), pp. 147-152, November, 2016 Available online at http://www.japsonline.com DOI: 10.7324/JAPS.2016.601123 ISSN 2231-3354
A Simple RP-HPLC Method Development and Validation for the Simultaneous Estimation of Naproxen and Rabeprazole Mohammad Firoz Khan, Shaila Sharmin Zuthi, Md. Shahidulla Kayser, Md. Shariful Islam, Sharmeen Asad, Mohammad A. Rashid* Department of Pharmacy, State University of Bangladesh, Dhaka, Bangladesh. 2Department of Pharmaceutical Chemistry, University of Dhaka, Dhaka, Bangladesh.
ARTICLE INFO
ABSTRACT
Article history: Received on: 06/10/2016 Revised on: 29/10/2016 Accepted on: 06/11/2016 Available online: 29/11/2016
A simple, economic, selective, accurate, precise reverse phase high performance liquid chromatographic method for the simultaneous estimation of naproxen and rabeprazole sodium in pure and pharmaceutical dosage forms was developed and validated. Naproxen and rabeprazole sodium were well separated using a phenomenex ODS C18 column of dimension 4.6 mm × 250 mm, 10 µm and mobile phase comprised of sodium dihydrogen phosphate buffer (pH 7.5±0.1) and acetonitrile in the ratio of 70:30 (v/v) at the flow rate 1 mL/min and the detection was performed at 275nm. The retention time for naproxen and rabeprazole sodium were found to be 3.33 ± 0.027 and 7.61 ± 0.043 min, respectively. The developed method was validated for specificity, linearity, precision and accuracy according to ICH guidelines. The proposed method is highly specific and linear over the concentration range of 2.0-60.0 µg/mL and 1.0-30.2 µg/mL for naproxen and rabeprazole sodium, respectively. The intraday precision (% RSD) of naproxen and rabeprazole sodium was in the range of 0.39 - 1.88% and 0.20 -1.51% while the interday precision ranged from 0.08 - 1.34% and 0.73 -0.87%, respectively. The accuracy (in terms of recover) of the method varied from 99.4-104.2% and 98.1-100.6% for naproxen and rabeprazole sodium, respectively. The LOD and LOQ of naproxen and rabeprazole sodium were found to be 0.6 and 0.1 µg/mL and 1.7 and 0.4 µg/mL, respectively. The sample solutions were stable for at least three hours. However, the developed method was successfully applied to assay naproxen and rabeprazole sodium brands available in Bangladesh.
Key words: Naproxen, Rabeprazole sodium, Retention time, Sample stability.
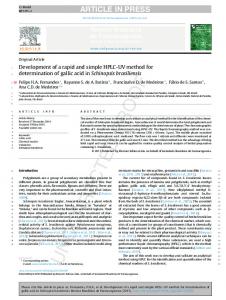
INTRODUCTION Naproxen (Figure 1A) is a class of 2-arylpropionic acid derivatives of NSAIDs. It possesses analgesic, anti-inflammatory and antipyretic activities by inhibiting the biosynthesis of prostaglandins (Brogden et al., 1975). This drug is used for the management of rheumatoid arthritis, osteoarthritis, juvenile arthritis, ankylosing spondylitis, tendonitis, bursitis and acute gout. It poses lower adverse effects and comparable efficacy to aspirin and indomethacin (Brunton et al., 2005). Rabeprazole (Figure 1B) is a proton pump inhibitor that covalently binds and inactivates the gastric parietal cell proton pump (H+/K+ ATPase). It has efficacy in healing, symptom relief and prevention of
* Corresponding Author Email: rashidma @ du.ac.bd
relapse of gastric ulcer, duodenal ulcer and gastro-oesophageal reflux disease. Naproxen poses a risk of stomach ulcers (Richy et al., 2004) and hence, to reduce stomach ulceration risk, it is often prescribed along with a proton-pump inhibitor such as rabeprozole during long-term treatment of those with pre-existing stomach ulcers or a history of developing stomach ulcers (Rossi, 2013; BNF, 2013). Fewer analytical techniques like HPTLC, RP-HPLC and UV spectrophotometric methods for the estimation of naproxen in presence of proton pump inhiboitors (PPIs) such as pantoprazole or esomeprazole (Patil and Mulla, 2013; Jain et al., 2011; Sloka et al., 2011; Jain et al., 2011) were reported earlier. While analytical methods including spectrophotometric methods (Ramesh et al., 2011; Gopi Raju et al., 2012), LC method (Asfak et al., 2007) and HPLC methods (Rao et al., 2012; Nayak et al., 2010; Saikiran et al., 2014) were reported to determine rabeprazole in presence of aceclofenac or diclofenac.
© 2016 Mohammad Firoz Khan et al. This is an open access article distributed under the terms of the Creative Commons Attribution License -NonCommercialShareAlikeUnported License (http://creativecommons.org/licenses/by-nc-sa/3.0/).
148
Khan et al. / Journal of Applied Pharmaceutical Science 6 (11); 2016: 147-152
According to the information collected from the literature, there is no reported method for the simultaneous estimation of naproxen and rabeprazole in pharmaceutical dosage form. Although the combine dosage form of naproxen and rabeprazole is not available yet, so in the present work as part of our continuous research investigations (Tanam et al., 2014), we are focused on to develop and validate an optimum chromatographic condition for the simultaneous determination of naproxen and rabeprazole in a synthetic mixture. The developed method could be applied for the quality control of pharmaceutical dosage form whenever it will be available in the market or could be used to assay the naproxen and rabeprazole sodium simultaneously which will reduce the analysis time and cost significantly. However, the developed method was applied successfully to assay synthetic mixture of naproxen and rabeprazole sodium prepared from the marketed naproxen and rabeprazole sodium brands available in Bangladesh.
UV-Visible detector (Model-SPD 10Avp) was used for the analysis. The data was recorded using LC solutions software (Version 1.03 SP3, Shimadzu Corporation, Kyoto, Japan). Phenomenex C18 (4.6 mm x 250 mm; 10 µm) analytical column was used for the analysis. Preparation of mobile phase 0.471gm of sodium phosphate monobasic and 0.863gm dibasic sodium phosphate was dissolved in 300 ml of mili-Q water. The undissolved solid was sonicated for about 5 minutes to get clear solution. Then mili-Q water was added for up to 1000 mL. Then the pH was adjusted to 7.5±0.1 with potassium hydroxide solution. Now, the mixture of buffer and acetonitrile were mixed at the ratio of 70:30 (v/v) and filtered through 0.45 µm membrane filter and degassed by sonication. This mixture was then used as mobile phase and diluent. Standard preparation Standard stock solution To prepare standard stock solution, 100 mg of each drug was weighted and dissolved separately with diluents in 100 mL volumetric flask to get the final concentration of 1000 μg/mL.
A
Working standard solution Working standard solutions were appropriately diluting the standard stock solution.
prepared
by
Analytical method validation The experiments for analytical method validation were carried out by following ICH guidelines (International Conference on Harmonisation (ICH), 2005).
B Fig. 1: Chemical structure of (A) naproxen and (B) rabeprazole.
MATERIALS AND METHODS Drugs and reagents Rabeprazole sodium and naproxen were kind gift of Advanced Chemical Industries (ACI) Ltd., Bangladesh. HPLC grade acetonitrile was obtained from Fisher Scientific Company, UK. Sodium dihydrogen phosphate, disodium hydrogen phosphate and other reagents were of analytical grade and used without further purification. A Milli-Q® (Millipore, France) water purification system was used to obtain purified water for the HPLC analysis. Instrumentation HPLC system (Shimadzu-UFLC Prominence) (ModelSCL 10Avp) equipped with a manual injector of 20 µL loop and
System suitability The suitability of the system was checked by injecting one blank followed by six replicate analysis of solution containing 10 μg/mL of rabeprazole sodium and 20 μg/mL of naproxen. To ascertain the system suitability for the proposed method the retention time, theoretical plate number, peak asymmetry, resolution, capacity and selectivity factor were taken. Specificity The specificity of the method was tested by comparing the chromatogram obtained after injecting the diluent, standard solution of naproxen, standard solution of rabeprazole and sample solution of naproxen & rabeprazole. Linearity and range The linearity graphs were obtained over the concentration range of 2.0-60.0 µg/mL and 1.0-30.2 µg/mL for naproxen and rabeprazole sodium, respectively. Method of least square analysis was performed to obtain the slope, intercept, correlation coefficient (R2) and regression equation of the method.
Khan et al. / Journal of Applied Pharmaceutical Science 6 (11); 2016: 147-152
Precision Precision of the assay was assessed with respect to repeatability (intraday) and intermediate precision (interday). The precision of the current method was determined by analyzing three different concentrations. Three replicate of each concentration is used to calculate the relative standard deviation (RSD) by following equation below:
The RSD value of ≤ 2% indicates that the method is adequately precised. Accuracy It measures the bias of the method. Five different concentrations of standard naproxen and rabeprazole sodium solution were used to find the accuracy of the method. Triplicate injections of each concentration were made and mean peak area was taken to calculate the concentration and the accuracy of proposed method was obtained by the following equation:
Limit of detection (LOD) LOD means the lowest amount of analyte in a sample that can be detected but cannot be quantified precisely, under the defined environmental conditions. The LOD was estimated by the following equation:
Where, SD = standard deviation of response σ = slope of regression line Limit of quantification (LOQ) The LOQ is the lowest concentration of analyte in a specimen that can be determined with suitable precision and accuracy under the defined experimental conditions. The LOQ was calculated by the following equation:
Where, SD = standard deviation of response σ = slope of regression line Stability of sample solution The sample solution was analyzed for up to three hours to find the stability of the sample solution. Application of the developed method As combined dosage form of naproxen and rabeprazole sodium is not available in the market so we prepare synthetic mixture of naproxen and rabeprazole sodium. We purchased four (4) naproxen and three (3) rabeprazole sodium brands (tablet dosage form) available in Bangladesh. The naproxen and rabeprazole sodium brands are then coded as N1, N2, N3, N4 and R1, R2, R3, respectively (Table 1). For preparing the sample
149
solution each drug was grounded and powder equivalent to 100 mg of each drug was taken in a 100 mL volumetric flask, dissolved in diluent, shaken and sonicated for about 20 minutes and diluted up to the mark with diluent. Then the solution was filtered through 0.45 µm membrane filter. The filtered solution was further diluted according to the need. Then the sample solutions of different brands were mixed randomly to get the synthetic mixture solutions having concentration of 20 µg/mL naproxen and 10 µg/mL rabeprazole sodium. Table 1: Preparation of sample solution and synthetic mixture. Code for naproxen brands
N1 N2 N3 N4
Batch number
5023 0316 B0141116 SXF122
Code for rabeprazole sodium brands
R1 R2 R3
Batch number
Synthetic mixture
T2356023 16017 SZ127
N1 & R1 N2 & R1 N3 & R2 N4 & R3 N4 & R2
RESULTS AND DISCUSSION HPLC method is one of the most powerful analytical tools in quality control department of Pharmaceutical Industry for its selectivity, sensitivity and reproducibility. The goal of this work was to develop and validate a simple, rapid and sensitive assay method for the simultaneous estimation of naproxen and rabeprazole sodium in Pharmaceutical dosage form. Chromatographic conditions, especially the composition and nature of the mobile phase, were optimized through several trials to achieve the best resolution and increase the signal of naproxen and rabeprazole sodium. Using the optimized chromatographic conditions, the HPLC method was evaluated in terms of specificity, linearity, precision, accuracy, limit of detection and limit of quantification. A good separation was achieved using a phenomenex ODS C18 column of dimension 4.6 mm × 250 mm, 10 µm and mobile phase consisting of sodium dihydrogen phosphate buffer (pH 7.5±0.1) and acetonitrile in the ratio of 70:30 (v/v) at room temperature. The flow rate was 1 mL/min and the detection was carried out at 275 nm. System suitability System suitability was conducted to ascertain the effectiveness of the chromatographic system. For this reason certain system suitability test parameters such as retention time, number of theoretical plates, tailing factor or peak asymmetry, resolution, capacity factor (k) and selectivity factor (α) were checked by repetitively injecting the drug solutions and results have been presented in Table 2. Table 2: System suitability parameters. Parameter Naproxen Retention time (min)* 3.36 ± 0.022 Number of theoretical plate* 6404 ± 224.9 * Tailing factor 1.29 ± 0.08 Capacity factor (k)* 0.601±0.006 Resolution* 17.774±0.239 * Selectivity factor (α) 4.425±0.008 * Each value is the mean ± SD of six determinations.
Rabeprazole sodium 7.58 ± 0.020 9316 ± 203.2 1.17 ± 0.03 2.661±0.025
150
Khan et al. / Journal of Applied Pharmaceutical Science 6 (11); 2016: 147-152
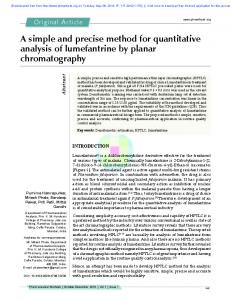
The retention times were 3.33 ± 0.027 and 7.61 ± 0.043 min for naproxen and rabeprazole sodium, respectively. As shown in the figures, there were no interfering peaks observed at the elution time of naproxen and rabeprazole sodium. Therefore, the method exhibited good specificity and selectivity.
Specificity The specificity of the method were assessed by comparing chromatograms of a diluent, diluent spiked with naproxen, diluent spiked with rabeprazole sodium and sample solution of naproxen and rabeprazole sodium (Figure 2).
A
B
C
D Fig. 2: Chromatogram of (A) diluent, (B) diluent spiked with Naproxen, (C) diluent spiked with Rabeprazole sodium and (D) sample solution of Rabeprazole sodium and Naproxen.
Khan et al. / Journal of Applied Pharmaceutical Science 6 (11); 2016: 147-152
Linearity and range When average peak area (y) was plotted against concentration range of 2.0-60.0 and 1.0-30.2 µg/mL for naproxen and rabeprazole sodium, respectively, a good correlation coefficient was obtained. For the equation of calibration curve, correlation coefficient (R2) was obtained as 0.999 and 0.999 for naproxen and rabeprazole sodium, respectively and which was within the acceptable limit and it showed good linear relationship of the newly developed methods. The slope (m) and intercept (c) of the calibration curve were found to be 31319, 211.7 and 40497, 13992 (Figure 3) for naproxen and rabeprazole sodium, respectively (Table 3).
1800000 1600000
Peak area
y = 31319x + 211.71 R² = 0.9994
1200000 1000000 800000 600000 400000 200000 0 0
20
40 60 Concentration (µg/ml)
80
(A) 1400000 1200000
Table 4: Precision of the HPLC method. Sample
Naproxen Rabeprazole sodium
Injected concent ration (µg/mL)
10.0 20.0 40.0 5.1 10.1 20.2
Intra-day (n=3) Concentr ation Precision found (% RSD) (µg/mL)
10.4 19.7 40.6 5.3 10.6 19.9
1.3 1.9 0.4 1.5 0.2 1.2
Inter-day (n=3) Concent Precisio ration n (% found RSD) (µg/mL)
10.3 20.2 38.9 4.9 10.2 20.0
1.3 0.4 0.1 0.6 0.9 0.7
Table 5: Accuracy of the HPLC method. Injected Sample concentration (µg/mL) 32.0 36.0 40.0 Naproxen 44.0 48.0 16 18 20 Rabeprazole sodium 22 24
Concentration found (µg/mL)
Accuracy (%)
33.3 35.8 39.7 44.3 47.9 15.7 18.1 20.1 21.8 23.9
104.2 99.5 99.4 100.7 99.7 98.1 100.3 100.6 99.1 99.4
Since all the values of accuracy and % RSD of precision study were within the acceptable range, the results indicated that the method is reliable, reproducible and accurate.
1000000
Peak area
sodium was in the range of 0.39 - 1.88% and 0.20 - 1.51% while the interday precision was in the range of 0.08 - 1.34% and 0.73 0.87%, respectively.
Accuracy The accuracy of the method was found to be in the range of 99.4-104.2% and 98.1-100.6% for naproxen and rabeprazole sodium, respectively. The result of accuracy is resented in Table 5.
2000000
1400000
151
800000 600000
y = 40497x + 13992 R² = 0.999
400000 200000 0 0
10
20 30 40 Concentration (µg/ml) (B) Fig. 3: Linearity study of (A) naproxen (B) rabeprazole sodium.
Table 3: Linearity and range of the HPLC method. Parameter Linear concentration range (µg/ml) Correlation coefficient (R2) Slope (m) Intercept (c) SE of intercept
Naproxen 2.0 - 60.0 0.999 31319 211.7 8649.70
Rabeprazole Sodium 1.0 - 30.2 0.999 40497 13992 7561.87
Precision The precision of the method has been shown in Table 4. The intraday precision (% RSD) of naproxen and rabeprazole
Limit of detection (LOD) The LOD of naproxen and rabeprazole sodium was found to be 0.6 and 0.1 µg/mL, respectively. Limit of quantification (LOQ) The LOQ of naproxen and rabeprazole sodium was found to be 1.7 and 0.4 µg/mL, respectively. Stability of sample solution In the stability study, the sample solution was found to be stable for at least up to three hours. The result obtained is shown in Table 6. Table 6: Stability study of sample solution. Concentration found (µg/mL) Injected Sample concentration 1 2 3 0 hour (µg/mL) hour hour hour Naproxen 20.0 19.2 19.1 19.3 19.3 30.0 29.6 29.7 29.8 29.2 40.0 40.6 39.6 40.2 40.0 Rabeprazole 10.0 10.6 10.7 10.6 10.3 sodium 15.0 15.5 15.7 15.4 14.6 20.0 20.9 20.7 20.8 19.6
152
Khan et al. / Journal of Applied Pharmaceutical Science 6 (11); 2016: 147-152
Application of the developed method The assay result of synthetic mixtures of marketed naproxen and rabeprazole sodium brands available in Bangladesh were ranged from 99.5 to 103.5% and 90.4 to 100.9%, respectively. The results are presented in Table 7. Table 7: Assay of marketed formulations. Potency of Combination Naproxen, N (%) N1 & R1 102.5 N2 & R1 103.5 N3 & R2 99.5 N4 & R3 103.5 N4 & R2 103.0
Potency of Rabeprazole, R (%) 100.4 100.9 96.9 90.4 99.5
CONCLUSION The novelty of the work is the development of a simple, rapid, accurate, precise, reproducible and selective HPLC method for the single and simultaneous analysis of naproxen and rabeprazole sodium in pharmaceutical dosage form. The successful application of the developed method warrants that the method will be a valuable addition in the quality control department of pharmaceutical industry as it will reduce the analysis time and cost greatly. Financial support and sponsorship: Nil. Conflict of Interests: There are no conflicts of interest. REFERENCES Asfak V, Mrinalini D, Leena B, Rahul G. Simultaneous Determination of Diclofenac Sodium and Rabeprazole Sodium in Bulk and Pharmaceutical Dosage Form by LC. Chromatographia, 2007; 66: 941-943. Brogden RN, Pinder RM, Sawyer PR, Speight TM, Avery GS. Naproxen: A Review of its Pharmacological Properties and Therapeutic Efficacy and Use. Drugs, 1975; 9: 326-363. Brunton L, Lazo J, Parker K, editor. Goodman and Gillman's. The Pharmacological Basis of Therapeutics. 11. New York, NY: McGrawHill Publishing; 2005. Gopi Raju T, Vinukonda A, Akki R, Gayatriramya M, Gupta SK, Naik VV. Simultaneous Estimation of Diclofenac Sodium and Rabeprazole in Combined Dosage Form. IJRPC, 2012; 2: 873-875. International Conference on Harmonisation (ICH), 2005. Harmonised Tripartite Guideline: Validation of Analytical Procedures: Methodology (Q2B), 2005. Jain DK, Jain N, Charde R, Jain N. The RP-HPLC method for simultaneous estimation of esomeprazole and naproxen in binary combination. Pharmaceutical Methods, 2011; 2: 167-172.
Jain NA, Lohiya RT, Umekar MJ. Spectrophotometric Determination of Naproxen and Esomeprazole in A Laboratory Mixture by Simultaneous Equation, Absorption Correction, Absorption Ratio and Area Under Curve Methods. IJPSR, 2011; 2: 130-134. Joint Formulary Committee. 2013. British National Formulary (BNF) (65 ed.). London, UK: Pharmaceutical Press. ISBN 978-0-85711084-8. Nayak DK, Kumar VK, Patnaik A. Simultaneous Estimation of Rabeprazole Sodium and Diclofenac Sodium by RP-HPLC Method in Combined Tablet Dosage Form. Int J PharmTech Res, 2010; 2: 14881492. Patil A, Mulla S. Development and Validation of HPTLC Method for the Simultaneous Estimation of Naproxen and Pantoprazole in Combined Dosage Form. Int J Pharm Pharm Sci, 2013; 5: 223-225. Rao JR, Bharekar VV, Mulla TS, Yadav SS, Rajput MP. Simultaneous Estimation of Rabeprazole Sodium and Aceclofenac in Pharmaceutical Dosage Form By HPLC. Int J Chem Tech Res, 2012; 4: 1596-5-1600. Richy F, Bruyere O, Ethgen O, Rabenda V, Bouvenot G, Audran M, Herrero-Beaumont G, Moore A, Eliakim R, Haim M, Reginster JY. Time dependent risk of gastrointestinal complications induced by nonsteroidal anti-inflammatory drug use: a consensus statement using a meta-analytic approach. Annals of the Rheumatic Diseases. 2004; 63: 759–66. Rossi S, ed. (2013). Australian Medicines Handbook (2013 ed.). Adelaide: The Australian Medicines Handbook Unit Trust. Saikiran BH, Rao PV, Thangabalan B, Babu SM. Development and Validation of RP-HPLC Method for Simultaneous Estimation of Rabeprazole and Diclofenac in Pure And Tablet Dosage Form. IJRPNS, 2014; 3: 132 - 138. Sawant RL, Hadawale SD, Dhikale GK, Bansode CA, Tajane PS. Spectrophotometric methods for simultaneous estimation of rabeprazole sodium and aceclofenac from the combined capsule dosage form. Pharm Methods, 2011; 2: 193-197. Sloka SN, Gurupadayya BM, Kumar CA. Simultaneous Spectrophotometric Determination of Naproxen and Pantoprazole in Pharmaceutical Dosage Form. J Appl Chem Res, 2011; 17: 65-74. Tanam AA, Khan MF, Rashid RB, Sultan MZ, Rashid MA. Validation and Optimization of a Simple RP-HPLC Method for the Determination of Paracetamol in Human Serum and its Application in a Pharmacokinetic Study with Healthy Bangladeshi Male Volunteers. Dhaka Univ J Pharm Sci, 2014; 13: 125-131.
How to cite this article: Khan MF, Zuthi SS, Kayser MS, Islam MS, Asad S, Rashid MA. A Simple RP-HPLC Method Development and Validation for the Simultaneous Estimation of Naproxen and Rabeprazole. J App Pharm Sci, 2016; 6 (11): 147-152.