A Simple Technique Based on a Single Optical Trap for the Determination of Bacterial Swimming Pattern Ignacio A. Martı´nez1, Susana Campoy2*, Meritxell Tort2, Montserrat Llagostera2, Dmitri Petrov1,3 1 ICFO-Institut de Cie`ncies Foto`niques, Castelldefels, Spain, 2 Departament de Gene`tica i de Microbiologia, Universitat Auto`noma de Barcelona, Bellaterra, Spain, 3 ICREA Institucio´ Catalana de Recerca i Estudis Avanc¸ats, Barcelona, Spain
Abstract Bacterial motility is associated to a wide range of biological processes and it plays a key role in the virulence of many pathogens. Here we describe a method to distinguish the dynamic properties of bacteria by analyzing the statistical functions derived from the trajectories of a bacterium trapped by a single optical beam. The approach is based on the model of the rotation of a solid optically trapped sphere. The technique is easily implemented in a biological laboratory, since with only a small number of optical and electronic components a simple biological microscope can be converted into the required analyzer. To illustrate the functionality of this method, we probed several Salmonella enterica serovar Typhimurium mutants that differed from the wild-type with respect to their swimming patterns. In a further application, the motility dynamics of the S: Typhimurium cheV mutant were characterized. Citation: Martı´nez IA, Campoy S, Tort M, Llagostera M, Petrov D (2013) A Simple Technique Based on a Single Optical Trap for the Determination of Bacterial Swimming Pattern. PLoS ONE 8(4): e61630. doi:10.1371/journal.pone.0061630 Editor: Christof Markus Aegerter, University of Zurich, Switzerland Received January 15, 2013; Accepted March 12, 2013; Published April 29, 2013 Copyright: ß 2013 Martı´nez et al. This is an open-access article distributed under the terms of the Creative Commons Attribution License, which permits unrestricted use, distribution, and reproduction in any medium, provided the original author and source are credited. Funding: The authors acknowledge financial support from the Fundacio Privada Cellex Barcelona, the Spanish Ministry of Science and Innovation (MICINN FIS2008-00114, FIS2011-24409 and BFU2011-23478), and the Generalitat de Catalunya (2009SGR-1106). The funders had no role in study design, data collection and analysis, decision to publish, or preparation of the manuscript. Competing Interests: The authors have declared that no competing interests exist. * E-mail:
[email protected]
Running and tumbling underlie the process of chemotaxis [10] and provide the means by which bacterial cells migrate towards favorable chemicals (attractants) or away from unfavorable ones (repellents). In S: Typhimurium and other bacteria, the presence of chemoattractants/repellents is detected by transmembrane receptors, the methyl-accepting chemotaxis proteins (MCPs) [11], which are associated through the adaptor CheW protein to the CheA kinase [10]. Signal recognition at the chemoreceptor level is determined by degree of MCPs methylation, which in turn reflects the activities of CheR and the methylesterase CheB, and modulates CheA autophosphorylation activity [12]. The phosphorylated kinase (CheA-P) phosphorylates the CheY response regulator, with CheY-P then acting on the flagellar motor. In the absence of CheY-P, the flagella turn CCW and therefore the bacterium runs whereas in the presence of CheY-P the flagella rotate CW and thereby induces tumbling (Fig. 1). When a bacterium senses an attractant gradient, its runs become longer as the number of tumbles decreases, such that the cell migrates up the gradient [13]. Consequently, chemotaxis enables the bacterial cell to find better environments for growth. Chemotaxis and swimming are also key to the virulence of many pathogens [14–16]. In this context, flagellar movement has been intensively studied, mainly via two different strategies: direct visualization of free-moving bacteria and investigations of the rotation of tethered cells. The former typically involves the use of dark-field, differential interface contrast microscopy or, in cells specifically labeled with a fluorescent tag, fluorescence microscopy [9,17–19]. In addition, the motile behavior of cells has been directly studied using microfluidics assays. [20,21]. Alternatively, in tethered cells assays, the bacteria are fixed to a surface via their
Introduction The locomotion of unicellular organisms in aqueous media is mediated by several different mechanisms, among which, the bacterial flagellum is the most thoroughly studied [1–4]. This complex structure is composed of several elements that act together to produce helical rotation [5–7]. As a semi-rigid helical filament, the flagellum consists of three substructures analogous to an artificial mechanical system: the basal body, which provides an anchor to the bacterial envelope and contains the motor; the filament, which acts as the propeller; and the hook, which connects the basal body to the filament, and acts as a universal joint [2,7]. Flagella propelled swimming has been thoroughly studied in enteric bacteria such as Salmonella enterica serovar Typhimurium (referred to in the following as S: Typhimurium) [4,7], the bacterium used to develop the method described herein. As other peritrichous bacteria, S: Typhimurium have several flagella over its surface. There are between five and ten flagella several micrometers in length but only about 20 nm in diameter that can rotate both clockwise (CW) and counterclockwise (CCW) [8,9]. Bacterial motion can be described as a combination of two types of behavior: running and tumbling. During running, the bacterial flagella rotate CCW and form a bundle that pushes the cell along [8,9]. The bundle collapse when one or more motors of the flagella turn in the CW direction, in which case the bacterium tumbles and reorients itself in another direction [8,9]. While at the beginning of each run, the cell moves in a random direction, the combination of both movements, i.e., straight lines (running) and random changes (tumbling), allows the cell to explore its environment.
PLOS ONE | www.plosone.org
1
April 2013 | Volume 8 | Issue 4 | e61630
Single Optical Trap for Swimming Pattern Detection
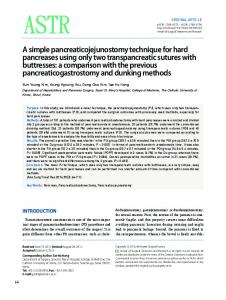
Figure 1. The chemotaxis pathway. (a) When the methyl-accepting chemotaxis proteins (MCPs) are highly methylated or unbound (yellow), CheA is activated by phosphorylation. Once activated, it phosphorylates the CheY and CheB response regulators. CheB-P demethylates the MCPs and the high level of CheY-P interacts with the flagellar motor, increasing the frequency of clockwise (CW) rotation, which causes the cell to tumble. (b) MCPs associated with a ligand (attractant) or less methylated (orange), maintain the CheA in a non-phosphorylated, inactive state. Consequently, the CheB methylesterase is not active and does not demethylate the MCPs. CheR methylation of the MCPs, decreases the sensitivity of these receptors. In addition, the CheY-P levels are reduced, leading to an increase in counterclockwise (CCW) flagellar rotation frequency, causing the cell to run. PE, periplasm; IM, inner membrane; Z, CheZ; W, CheW. The grey discontinuous arrows indicate non-occurring reactions (based on [11,12]). doi:10.1371/journal.pone.0061630.g001
flagella [18]. In this case, there is CW or CCW rotation of the basal body depending on the rotational direction of the flagella. Tethered assays normally rely on high-speed video recorders and image processing software programs that quantify swimming speed, the time between the running and tumbling steps, etc. Among the other experimental approaches used to characterize chemotaxis and flagellar rotation are those based on optical trapping (for example, [22–29]). This method exploits
PLOS ONE | www.plosone.org
the fact that the inner refractive index (cytoplasm) of the bacterium is larger than that of its surrounding medium, such that in the presence of a tightly focused optical beam a radiation force directed towards the beam focus is produced. This results in the immobilization of the bacteria, whose trapped position can be examined using several techniques that provide a microsecond time and nanometer spatial resolutions. The most detailed information on chemotaxis is obtained when
2
April 2013 | Volume 8 | Issue 4 | e61630
Single Optical Trap for Swimming Pattern Detection
flagellar bundle rotation and the counter-rotation of the cell body are analyzed simultaneously. However, until now, this was possible only by using the dual optical trap system proposed in [28] in which a bacterium is trapped at each end by two optical beams polarized orthogonally. The scattered light of both beams is then analyzed separately by two position-sensitive detectors. The Power Spectral Density (PSD) of the output signals from the detectors yields two peaks corresponding to flagellar rotation and body rotation. An analysis of the phase between the detector signals provides a description of the rotation. An important step in the simplification of this experimental setup (but without a loss of information) was recently reported by [29] where a single optical trap was used to capture a bacterium with a single polar flagellum rotating either CCW or CW. Using a position sensitive photodetector, the authors were able to detect the characteristic frequencies of the bacterium motion by analyzing the PSD of the cell’s position. In addition, they could measure the flagellar motor switching rate under different chemical simulations. In the following we describe the further refinement of this simple but informative single optical trap technique. We demonstrate that additional information can be obtained if the analysis of the temporal position of the bacterium also includes calculations of the cross-correlation function of the cell trajectory in the plane normal to the optical axis. By applying this approach to a bacterium that uses the run-tumble swimming pattern to navigate within its environment, we were able to study the swimming patterns of different mutant strains across the entire range of bacteria motion within the optical trap. The procedure was validated in dead, running (cheY , cheW ), tumbling (cheB mutant) and wild-type strains of S: Typhimurium. It was then used, as an example of its potential applications, to identify the role of the CheV protein in the rotation of S: Typhimurium flagella.
Construction of S: Typhimurium LT2 mutant Derivatives The S: Typhimurium LT2 mutant derivatives used in this work were knockout mutants constructed by the one-step PCR based gene replacement method [33]. All DNA techniques were performed as described elsewhere [34]. The chloramphenicol resistance cassette from the plasmid pKD3 was amplified using suitable 100-nucleotide (nt)- oligonucleotides containing 80-nt stretches homologous to each of the insertion sites (Table S2). The PCR product was DpnI digested and transformated into the S: Typhimurium LT2 electrocompetent cells containing the pKOBEGA plasmid [35]. Following selection of the transformant clones, the pKOBEGA plasmid was eliminated by taking advantage of its temperature sensitivity, growing the clones at 42uC. Gene substitution was confirmed by PCR and sequencing. In all cases, the resulting construct was transferred to a wild type S: Typhimurium LT2 strain by transduction, using the P22 HT bacteriophage [36]. The absence of the prophage in the selected transductant clones was determined by streaking them onto green plates as previously described [37]. The resulting strains were again verified by PCR and sequencing.
Optical Setup Optical trapping was carried out using a 1064 nm optical beam from a laser coupled to a single-mode fiber (Avanex) expanded up to 10 mm and then focused by a 100|NA~1:3 objective (Nikon, CFI PL FL 100X AN 1.30 WD 0.16 mm), as shown in Fig. 2. The optical trapping intensity during the experiments (25 mW) was kept as low as possible in order to immobilize the bacteria while minimizing any oxidative damage. The forward scattered light of the trapping beam was collected by a 40 | objective, and analyzed using a quadrant-position detector (QPD) (NewFocus 2911). The resulting signals were then transferred to a computer software via an analog to digital conversion card (National Instruments PCI-6120). Cell position data were acquired at a rate of 20 kHz. During the experiments, and especially at the beginning (capture) and end (liberation) of the measurements, videos were recorded using a CCD camera.
Materials and Methods Bacterial Strains, Media, and Growth Conditions All bacterial strains and plasmids used in this work are listed in Table S1. Except when indicated, the bacteria were grown at 37uC in Luria–Bertani (LB) broth or plates. Ampicillin (100 mg/ml) or chloramphenicol (34 mg/ml) was added to the culture as necessary. Bacteria used in the optical trapping experiments were grown overnight in 2 ml of LB broth supplemented, when needed, with the appropriate antibiotic. Each culture was then diluted 1/10 into LB broth without antibiotic and incubated at 37uC for 1 h. To reduce trapmediated oxidative damage to the bacterial cells and ensure that a steady level of oxygen was reached during the optical measurements [28], an oxygen scavenging system, consisted of glucose oxidase and catalase at final concentrations of 100 mg/ mL and 20 mg/ml, respectively, was added at least 2 h before the measurements [30]. The added glucose is a substrate for the oxygen scavenging system and provides the energy needed for swimming in anaerobic conditions [31]. For the optical traping measurements, the culture was further diluted 100-fold in trapping medium (1% Bacto Tryptone, 0.8% NaCl, 2% glucose, 100 mM Tris-Cl, pH 7.5). The use of tryptone broth for the optical trapping experiements is appropriate to obtain reproducible cell motility assays [32]. Dead cells used as controls were prepared by addition of 2% formaldehyde to the culture, with subsequent dilution steps carried out following the same protocol used for the live bacterial cultures.
PLOS ONE | www.plosone.org
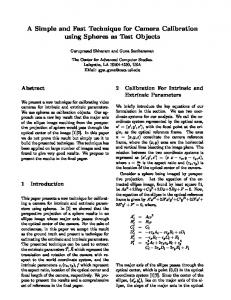
Figure 2. Optical trap layout. A trapping beam (1064 nm) is expanded by a lens in order to overfill the input pupil of the trapping objective, O1, and, hence, increase the trapping force. The position of a trapped object is detected by monitoring the spatial distribution of the trapping beam scattered by the object. This scattered light is collected by an objective, O2, and projected into a quadrant-position detector (QPD). doi:10.1371/journal.pone.0061630.g002
3
April 2013 | Volume 8 | Issue 4 | e61630
Single Optical Trap for Swimming Pattern Detection
bacterial cell has two main sources of movement: the flagellar rotation and the thermal energy of the bath. Based on the PSD and the traces, two discrete frequencies can appear in the motion of living cells [28,40]: the body roll characterized by the frequency V (around 1–10 Hz), and the flagellar bundle rotation with the frequency v (between 70 and 140 Hz) (see Fig. 3). From the study of the PSD we can infer that the dynamics of a flagellated bacterium are governed more by rotations with frequency V than by those with frequency v, due to a two orders of magnitude difference in the values of the corresponding peaks in the PSD. Therefore, in the equations describing bacterial movement (1) and (2) rotations with the frequency v, can be neglected, while in the equations (1), (2), (3) and (4). The CCF is studied for a short correlation time of t~+50ms, when the entire expression (4) can be approximated by the Taylor V V series, Sx(t)y(tzt)TNorm ~e{kt=c sin t? t:Ht, where the c c physical meaning of H is the angular velocity of the cell around the optical axis. Accordingly, bacterial cell dynamics can be classified in terms of three different scenarios: dead, running, or tumbling: In a dead cell, the mean value of H (SHT) is zero since there is no flagellar movement, but only broadening (DH) due to thermal fluctuation of the cell. In a running cell, SHT has a non-zero value due to rotation of the cell body as a whole. This value can be positive or negative depending on the orientation of the cell inside the trap. As the number of flagella is small, from 5 to 10, the individual behavior of a single flagellum can affect the statistical distribution of SHT, resulting in a DH that is larger than in the case of a dead cell. In a tumbling cell, flagella do not form a bundle, thus, while the rotation frequency around the z-axis has a zero average, SHT~0, the rotation motion with frequency v is still present (see 5), causing a larger broadening of the histogram H than in occurs with a dead cell. Data for each bacterial strain were obtained from ten different randomly chosen cells of four distinct biological replicates, and thus a total of 40 cells per strain. The position of each trapped cell was acquired for 1000 s. The entire set of acquired data was then divided into 1-s-blocks (i.e., 2|104 points in each block). For each block of data the CCF was calculated and the dependence of the CCF near t~0 was linearly fit, thereby yielding the value of H. By repeating the protocol for all blocks a histogram of H was produced for each measured cell. Then the next cell was trapped and its corresponding histogram was obtained. About 80% of the histograms were found to behave in a very similar manner. All plots shown below for the wild-type, mutant strains, and dead bacteria, present the x and y traces, PSD, CCF and H histogram of one trapped cell either from the corresponding bacterial strain or from a dead cell control. In all cases, the selected histograms were within the above-mentioned 80%.
The optical beam traps those cellular constituents with refractive indices higher than that of the surrounding medium, hence the QPD signals yield information on the momentary position (x and y in the plane perpendicular to the trapping beam propagation direction, and z along the propagation direction) of these parts of the bacterial cell. The trajectory of the optically trapped bacteria depends on several factors, both physical (such as the trap stiffness, size of the cell, and viscosity of the medium) and biological (such as the intensity of the flagellar movement). Moreover, cells that are otherwise similar may propel themselves with different velocities, which also affects the trajectories. Due to the cylindrical shape of bacteria, a cell trapped in the single optical beam aligns itself along the optical axis [38]. Besides Brownian motion, the torque produced by the flagella alters the dynamics of the cell due to the possibility of single or double rotations, as shown schematically in Fig. 3.
Processing of the Experimental Data The different motility phenotypes are classified based on the study of the trajectory, fx(t),y(t)g, of a single cell optically trapped by the optical tweezers. The starting point of this analysis is the model of the rotation of a solid sphere [39]. Consider a sphere suspended in a liquid medium and confined within a harmonic potential well, where it moves randomly due to thermal excitation. An external torque is exerted on the sphere such that in the absence of any trapping potential the sphere rotates around the zaxis with a constant angular velocity due to friction. The angular velocity is determined by the balance between the torque applied to the sphere and the drag torque. The Langevin equations in the overdamped conditions describe the trajectory (x(t),y(t)) of the sphere as: pffiffiffiffiffiffiffiffiffiffiffiffiffiffi cx_ (t)zkx(t)zHy(t)~ 2kB Tcgx (t),
ð1Þ
pffiffiffiffiffiffiffiffiffiffiffiffiffiffi cy_ (t)zky(t){Hx(t)~ 2kB Tcgy (t),
ð2Þ
where c is the friction coefficient, k is the trap stiffness, H is the torque parameter for an arbitrary rotation, kB is the Boltzmann constant, T is the temperature, and g(t) is the white gaussian noise term. The autocorrelation functions (ACF) and the crosscorrelation functions (CCF) are calculated from (1) and (2): ð? ACF (t)~
ð? x(t)x(tzt)dt~
{?
~
y(t)y(tzt)dt {?
kB T {kt=c H e cos t, k c
ð? CCF (t)~
x(t)y(tzt)dt~ {?
kB T {kt=c H e sin t: k c
ð3Þ
Results
ð4Þ
In the following, the results obtained using dead bacteria, live wild-type cells, and the three S: Typhimurium mutant derivatives (cheB, cheY , and cheW , whose behavior has been wellcharacterized [41–43]) are shown. The motion profiles obtained with the proposed technique consist of the ACF and CCF of the trajectories resulting from the different bacterial motility patterns and they provide a reference for further studies.
The ACF (t) and Power Spectral Density (PSD) form a Fourier pair and both functions can be calculated from the experimental traces of an optically trapped object. As seen from (3) and (4), in the absence of rotational motions of the trapped object then (H~0), CCF (t)~0, and ACF (t) is an exponential function proportional to the viscous force acting on the object. To apply this model to trapped cells able to rotate in the optical trap, the possible types of rotations must be specified. A flagellated PLOS ONE | www.plosone.org
Dead Bacteria Pattern Figure 4 shows the x{ and y{ trajectories of the dead bacteria, with their corresponding PSD, ACF, and CCF. For these 4
April 2013 | Volume 8 | Issue 4 | e61630
Single Optical Trap for Swimming Pattern Detection
Figure 3. A simplified explanation of the two possible flagellar conformations. On the left is a cell with all flagella rotating CCW and consequently forming a bundle that gives a translation velocity to the bacteria, which runs. The motion of a living bacterial cell is characterized by a body roll with frequency V, and by flagellar bundle rotation v. On the right is a tumbling cell with the flagella rotating CW such that no bundle is formed. This process gives extra energy to the cell’s dynamics, but does not produce any rotation around the optical axis of the trapping system. doi:10.1371/journal.pone.0061630.g003
cells, the PSDs lack the characteristic discrete frequencies seen with live motile bacteria, and they are very similar to the PSDs of the motion of an optically trapped solid sphere thus, the Lorentzian curve is that expected from the experimental conditions. A cross-correlation is also absent from the trajectory since a dead cell does not have any rotational motion. Therefore, as for an optically trapped bead, the ACF depends only on the viscous drag coefficient and the trap stiffness and therefore decays exponentially.
PLOS ONE | www.plosone.org
Tumbling Pattern: The cheB Mutant The S: Typhimurium LT2 cheB mutant derivative is a knockout mutant of the CheB methylesterase, which in the bacterial chemotaxis pathway controls the level of MCPs methylation (Fig. 1). The cheB mutants are characterized by a high frequency of tumbling [43]. The statistical characteristics of the trajectory of this mutant in the optical trap are presented in Fig. 5. Rotations with angular frequencies in a band near v~100 Hz are seen in the PSD, ACF, and CCF, but their presence is also evident even in the trajectories (Fig. 5a). As flagella normally rotate CW, there is no bundle formation. The CCF is not a stable function but instead gives a
5
April 2013 | Volume 8 | Issue 4 | e61630
Single Optical Trap for Swimming Pattern Detection
Figure 5. Dynamic characteristics of the cheB mutant: the trajectories of the x and y positions during 1 s (a) and their corresponding PSD (b), ACF and CCF (c). The red and blue curves are the trajectories, PSD, and ACF of the x and y positions, and the green curve is the CCF. doi:10.1371/journal.pone.0061630.g005
Figure 4. Dynamic characteristics of the motion of a dead bacterium: time-traces of the x and y positions during 1 s (a) and their corresponding PSD (b), ACF, and CCF (c). In (a), the y(t) trajectory is shifted in order to improve its visibility. In (c) the red and blue curves are the ACFs of the x and y positions, and the green curve is the CCF. doi:10.1371/journal.pone.0061630.g004
only running pattern of motility not tumbling, what is also known as the smooth swimming profile [42]. In Fig. 6, cheY mutant rotations with v around 100 Hz, and V from 5 to 15 Hz are clearly seen, both in the trajectories (Fig. 6a) and in the ACF and CCF (Fig. 6c). The differences in the V values of the different cells are due to the size differences, which can vary by as much as 30% of the length of a typical cell. The same results are observed for the cheW mutants. In both mutants, the dynamics of the bacterial
fluctuating value of H. This behavior is related to the continuous chaotic movement of the cell inside the trap.
Running Pattern: The cheY and cheW Mutants The S: Typhimurium LT2 cheY and cheW mutants are ideal candidates for exploring running motility, because both present
PLOS ONE | www.plosone.org
6
April 2013 | Volume 8 | Issue 4 | e61630
Single Optical Trap for Swimming Pattern Detection
Figure 7. Dynamic characteristics of the S: Typhimurium wildtype strain: the x (bottom) and y (upper) coordinates of the wild-type bacteria during a 7 s time interval. The the switch of the flagellar motor from the running to the tumbling state is shown. The trace of the y coordinate is shifted in order to avoid overlap with that of the x coordinate. doi:10.1371/journal.pone.0061630.g007
different type of dynamic profile from that of tumbling or dead bacteria (See below).
Wild-type Swimming Pattern As described above, the swimming pattern of the wild-type strain combines both tumbling and running. In this case, the pattern observed in the representation of the CCF slope for short correlation times is composite of those of the two dynamic types, the tumbling mutant and the running mutant. Figure 7 illustrates the traces of the wild-type bacterium, showing the switch from a tumbling to a running state. The traces also allows measurement of the characteristic switching rate of the bacterial motor.
Histograms of H The results obtained for each bacterial strain with known dynamic properties can now be summarized using the parameter H, i.e., the slope of the CCF for short correlation times. A comparison of the H histograms of the four motility patterns (dead cell, tumbling, running, and wild-type cells), distinguishes four types of dynamics (Fig. 8). The widths of the histograms indicate contributions beyond Brownian motion. Accordingly, the histograms from the live cells are different from those of dead bacteria (Fig. 8). In the former, the flagellar frequency does not remain constant, which implies changes in the translational direction [28]. The H histogram for the wild-type strain is shown in Fig. 8. The correlation functions of this cell should change with time. In dead cells, just the Brownian motion contributes to the width of the histogram, whereas in live cells the contribution of the thermal energy is smaller than that of flagellar motion, resulting in greater broadening of the histograms. Moreover, considering that S: Typhimurium has only five to ten flagella per cell, the histograms also reflect the differential dynamics of a single flagellum since changes therein would affect overall cell movement.
Figure 6. Dynamic characteristics of the cheY mutant: the trajectories of the x and y positions during 1 s (a) and their corresponding PSD (b), ACF, and CCF (c). The red and blue curves are the trajectories, PSD, and ACFs of the x and y positions, and the green curve is the CCF. doi:10.1371/journal.pone.0061630.g006
cells inside the trap, with most of the flagella rotating CCW, reflect the rearrangement of all the individual flagellum as a collective bundle positioned at one end of the bacterium. This collective process generates a forward velocity (without the trap it is represented by a quasi-straight line [44]) that is responsible for the global bacterial rotation V. The PSD has two peaks, one centered at 5–15 Hz, corresponding to the cell body roll (V) around the trapping point, and the flagella bundle roll around 100 Hz, indicative of rolling by the flagellar bundle (Fig. 6, and data not shown). Accordingly, in these running mutants the histogram of the slope of the CCF for short correlation times clearly points to a
PLOS ONE | www.plosone.org
7
April 2013 | Volume 8 | Issue 4 | e61630
Single Optical Trap for Swimming Pattern Detection
description contradicts earlier published results [41,43,46]. For this reason, we chose to apply our newly developed, validated technique to study flagellar rotation in the S: Typhimurium cheV mutant. A video analysis as well as examination of the ACF and the slope of the CCF for short correlation times (Fig. 9) showed that the cheV knockout mutant has a tumbling pattern. The absence of the CheV protein modifies the H distribution, centering it around zero, with an additional contribution to the H histogram from the random rotations.
Discussion The simple single optical trap used in this study to analyze the swimming pattern of S: Typhimurium and several mutants can be broadly applied to measure the full range of bacterial motility and alterations thereof. The core of the method is based on our previous study [39], which described the movement of a submicron object confined in an optical trap in the presence of a torque exerted on or produced by the object. The single optical trap assay can detect differences in the dynamic properties of cells of the same culture, seen as a change in the mean value of H, expressed as V, from one cell to another. Our study of ten independent cells from four independent cultures showed that the distribution of the histograms remained very similar, such that the individual phenotype of a single bacterium could be distinguished. The importance of the different parameters is more readily appreciated in the case of the running mutants. For some bacteria, H can achieve values close to 100 Hz. It is important to note that in these cases, the widths of the histogram are similar to those obtained for running mutants with only 10 Hz. Photodamage to the trapped bacterium has been considered [47] given that infrared light in the presence of oxygen produces free radicals inside the cell, which induce death within a short period of time. In our optical trap system, this problem is avoided by including an oxygen scavenging system in the sample preparation medium, which guarantees a constant low level of oxygen and, hence, cell survival during the measurements. The obtained results validate the utility of this optical trap setup to characterize bacterial motility. The analysis of dead cells as well as running, tumbling and wild-type strains of S: Typhimurium demostrated the possibility to correlate the motility characteristics widely described for these cells with specific H distribution profiles. Thus, the trajectory of the running mutants is characterized by a mean value of H different from zero and that of tumbling mutants by a mean value of H near zero with a certain standard deviation in the latter case due to the random disposition of the flagella and the absence of an equilibrium position. Changes in bundle formation, from the tail to the head and vice-versa, must also be considered [48]. This effect is unlikely to be stable because the bacteria should work against the radiation pressure in the optical trap, it not being possible to define a stable equilibrium position. In studying the slope of the CCF for the tumbling bacteria, near t~0, we found that the flagella of these cells rotate in the CW direction and that, like wild-type and running strains, the bacterial dynamics differ from those of dead bacteria (Fig. 4). A dead bacterium behaves as a solid body, therefore, when an extra force is applied, the entire sphere revolves around the trapping point. The sum of these torques will be uniform when averaged over a long time. For a tumbling cell, while the mean value of H is close to zero, the histogram will be wider than those obtained from a dead bacterium, since the motion detected in the latter case is Brownian motion (Fig. 8).
Figure 8. The slope, H, of the CCF near t~0 obtained from the trajectories of single optically trapped dead (diamonds), running (circles and crosses, corresponding to cheY and cheW mutants, respectively), cheB mutant tumbling (squares), and wild-type (triangles) bacteria. The histograms of the distributions can be classified into three main groups: (1) The histograms with a single maximum centered at zero that corresponds to tumbling bacteria (cheB mutant); (2) those with a single maximum not centered at zero correspond to a deterministic rotation associated with the rotation of a solid sphere, as is the case for running bacteria (cheY and cheW mutants); and (3) a combination of both profiles, as occurs in the wild-type strain. doi:10.1371/journal.pone.0061630.g008
Identification of the cheV Mutant Swimming Pattern The function of the CheV protein in the chemotaxis pathway is still not well understood. Although the swimming profile of S: Typhimurium cheV mutants has been characterized [45], the
Figure 9. The slope, H, of the CCF near t~0, obtained from the trajectories of the optically trapped cheV mutants. doi:10.1371/journal.pone.0061630.g009
PLOS ONE | www.plosone.org
8
April 2013 | Volume 8 | Issue 4 | e61630
Single Optical Trap for Swimming Pattern Detection
In addition, for a dead bacterium, there is no flagellar rotation, and therefore neither the ACF nor the CCFs will have a discrete spectrum. The histogram of H for a dead bacterium has a width much smaller than for a live one, due to the bacterium’s Brownian motion. Some bacterial species utilize CheV instead of the CheW, whereas in others, including S: Typhimurium, both proteins are present. In the latter case, the role of CheV is unknown [47]. Most hypotheses regarding CheV function have focused on the two different protein domains: a CheW-like domain and a phosphorylated receiver domain similar to that of CheY. Accordingly, it has been suggested that CheV plays a role in receptor coupling and in the adaptation of the chemotactic response [45,49,50]. Furthermore, a cheV knockout mutant was shown to exhibit the same swimming and chemotactic phenotypes as the wild-type strain [51]. Nevertheless, our single optical trap analysis clearly demonstrated the tumbling phenotype of the cheV knockout mutant. It should be noted, however, that single optical trap experiments are performed under anaerobic conditions, to avoid cell damage, while in the previously mentioned work the experimental conditions included the presence of oxygen. This is an important consideration because expression of the cheV gene is controlled by the global regulators Fnr and ArcA, both of which are involved in O2 sensing and adaptation [52,53]. Thus, when the O2 concentration decreases, ArcA and Fnr directly activate cheV expression, greatly increasing the concentration of CheV inside the cell. Therefore, under anaerobic conditions, such as used in the single optical trap, CheV protein are greatly magnified. In addition, the fact that the cheV and cheB mutants share the tumbling phenotype suggests that the role of CheV in S: Typhimurium is more closely associated with adaptation more than with receptor coupling. However, further work is needed to elucidate the role of S: Typhimurium cheV expression in the chemotactic pathway and its relation to the anaerobic metabolism.
Conclusions By analyzing the statistical functions derived from following the trajectories fx(t),y(t)g of a bacterium trapped by a single optical beam the different dynamic properties of different bacteria can be distinguished. The approach described herein is based on a model of the rotation of a solid optically trapped sphere. The optical trap technique can be easily implemented in a biological laboratory, since it requires only a small number of optical and electronic parts to convert a simple biological microscope into the required analyzer. In a demonstration of the utility of this method, we determined the motility profile of the S: Typhimurium cheV mutant derivative under anaerobic conditions, which case it exhibits tumbling behavior. This observation will contribute to elucidating the role of the CheV protein in the bacterial chemotaxis pathway.
Supporting Information Table S1 Bacterial strains and plasmids used in this
work. (DOC) Table S2 Oligonucleotides used in this work.
(DOC)
Acknowledgments We wish to acknowledge the assistance of Denis Spricigo in optimizing the bacterial culture preparations for the experiments.
Author Contributions Conceived and designed the experiments: IM SC ML DP. Performed the experiments: IM MT. Analyzed the data: IM SC MT. Contributed reagents/materials/analysis tools: SC MT IM. Wrote the paper: IM SC ML DP.
References 17. Macnab RM (1976) Examination of bacterial agellation by dark- field microscopy. J Clin Micro- biol 4: 258–265. 18. Alon U, Camarena L, Surette MG, Aguera B, Liu Y, et al. (1998) Response regulator output in bacterial chemotaxis. EMBO J 17: 4238–4248. 19. Staropoli JF, Alon U (2000) Computerized analysis of chemotaxis at different stages of bacterial growth. Biophys J 75: 513–519. 20. Whitesides GM, Ostuni E, Takayama S, Jian X, Ingber DE (2001) Soft lithography in biology and biochemistry. Annu Rev Biomed Eng 3: 335–373. 21. Ahmed T, Stocker TSSR (2010) Microuidics for bacterial chemotaxis. Integr Biol (Camb) 2: 604–629. 22. Berry RM, Berg HC (1997) Absence of a barrier to backwards rotation of the bacterial agellar motor demonstrated with optical tweezers. PNAS 94: 14433– 14437. 23. Koch M, Rohrbach A (2012) Object-adapted optical trapping and shapetracking of energy-switching helical bacteria. Nature Photonics 6: 680–686. 24. Ashkin A, Dziedzic JM (1987) Optical trapping and manipulation of viruses and bacteria. Science 235: 1517–1520. 25. Ashkin A, Dziedzic JM, Yamane T (1987) Optical trapping and manipulation of single cells usin infrared laser beams. Nature 330: 769–771. 26. Block SM, Blair DF, Berg HC (1987) Compliance of bacterial agella measured with optical tweezers. Nature 338: 514–518. 27. Ryu WS, Berry RM, Berg HC (2000) Torque-generating units of the agellar motor of Escherichia coli have a high duty ratio. Nature 403: 444–447. 28. Min TL, Mears PJ, Chubi LM, Rao CV, Golding I, et al. (2009) Highresolution, long-term char- acterization of bacterial motility using optical tweezers. Nature Methods 6: 831–835. 29. Altindal T, Chattopadhyay S, Wu XL (2011) Bacterial chemotaxis in an optical trap. PLOS one 6: e18231. 30. Landry MP, McCall PM, Qi Z, Chemla YR (2009) Characterization of photoactivated singlet oxygen damage in single-molecule optical trap experiments. Biophys J 97: 2128–2136. 31. Adler J, Templeton B (1967) The effect of environmental conditions on the motility of Escherichia coli. Microbiology 46: 175–184. 32. Adler J, Templeton B (1973) A method for measuring chemotaxis and use of method to determine optimum conditions for chemotaxis by Escherichia coli. J Gen Microbiol 74: 77–91.
1. Berg HC, Anderson RA (1973) Bacteria swim by rotating their flagellar filaments. Nature 245: 380–382. 2. Silverman M, Simon M (1974) Flagellar rotation and the mechanism of bacterial motility. Nature 249: 73–74. 3. Terashima H, Kojima S, Homma M (2008) Flagellar motility in bacteria structure and function of agellar motor. Int Rev Cell Mol Biol 270: 39–85. 4. Jarrell KF, McBride MJ (2008) The surprisingly diverse ways that prokaryotes move. Nat Rev Microbiol 6: 466–476. 5. Aizawa SI (1996) Flagellar assembly in Salmonella typhimurium. Mol Microbiol 19: 1–5. 6. Macnab RM (2003) How bacteria assemble agella. Annu Rev Microbiol 57: 77– 100. 7. Thomas DR, Francis NR, Xu C, DeRosier DJ (2006) The three-dimensional structure of the agellar rotor from a clockwise-locked mutant of Salmonella enterica serovar Typhimurium. J Bacteriol 188: 7039–7048. 8. Macnab RM (1977) Bacterial agella rotating in bundles: a study in helical geometry. Proc Natl Acad Sci U S A 74: 221–225. 9. Turner L, Ryu WS, Berg HC (2000) Real-time imaging of uorescent agellar _laments. Journal of Bacteriology 182: 2793–2801. 10. Stock JB, Surette M (1996) Chemotaxis in: Escherichia coli and Salmonella typhimurium: Cellular and Molecular Biology. ASM Press, Washington, DC. 11. Parkinson JS, Ames P, Studdert CA (2005) Collaborative signaling by bacterial chemoreceptors. Curr Opin Microbiol 8: 116–121. 12. Jurica MS, Stoddard BL (1998) Mind your B’s and R’s: bacterial chemotaxis, signal transduction and protein recognition. Structure 6: 809–813. 13. Macnab RM, Koshland DE (1998) The gradient-sensing mechanism in bacterial chemotaxis. Proc Natl Acad Sci USA 69: 2509–2512. 14. Ibarra JA, Steele-Mortimer O (2009) Salmonella{the ultimate insider. Salmonella virulence factors that modulate intracellular survival. Cell Microbiol 11: 1579–1586. 15. Sano G, Takada Y, Goto S, Maruyama K, Shindo Y, et al. (2007) Flagella facilitate escape of Salmonella from oncotic macrophages. J Bacteriol 189: 8224– 8232. 16. Jones BD, Lee CA, Falkow S (1992) Invasion by Salmonella typhimurium is affected by the direction of agellar rotation. Infect Immun 60: 2475–2480.
PLOS ONE | www.plosone.org
9
April 2013 | Volume 8 | Issue 4 | e61630
Single Optical Trap for Swimming Pattern Detection
44. Berg HC, Brown DA (1972) Chemotaxis in Escherichia coli analysed by threedimensional tracking. Nature 239: 500–504. 45. Alexander RP, Lowenthal AC, Harshey RM, Ottemann KM (2010) CheV: CheW-like coup proteins at the core of the chemotaxis signa network. Trends Microbiol 18: 494–503. 46. Dean GE, Aizawa SI, Macnab RM (1983) flaaii (motC, cheV ) of Salmonella typhimurium is a structural gene involved in energization and switching of the agellar motor. J Bacteriol 154: 84–91. 47. Neuman KC, Chadd EH, Liou GF, Bergman K, Block SM (1999) Characterization of photodamage to Escherichia coli in optical traps. Biophys J 77: 2856–2863. 48. Berg HC, Turner L (1995) Cells of E: coli swim either and forward. PNAS 92: 477–479. 49. Szurmant H, Ordal GW (2004) Diversity in chemotaxis mechanisms among the bacteria and archaea. Microbiol Mol Biol Rev 68: 301–319. 50. Porter SL, Wadhams GH, Armitage JP (2011) Signal processing in complex chemotaxis pathways. Nat Rev Microbiol 9: 153–165. 51. Frye J, Karlinsey JE, Felise HR, Marzolf B, Dowidar N, et al. (2006) Identification of new agellar genes of Salmonella enterica serovar Typhimurium. J Bacteriol 188: 2233–2243. 52. Fink RC, Evans MR, Porwollik S, Vazquez-Torres A, Jones-Carson J, et al. (2007) Fnr is a global regulator of virulence and anaerobic metabolism in Salmonella enterica serovar Typhimurium (atcc 14028s). J Bacteriol 189: 2262– 2273. 53. Evans MR, Fink RC, Vazquez-Torres A, Porwollik S, Jones-Carson J, et al. (2011) Analysis of the ArcA regulon in anaerobically grown Salmonella enterica serovar Typhimurium. BMC Microbiol 11: 58.
33. Datsenko KA, Wanner BL (2000) One-step inactivation of chromosomal genes in Escherichia coli K-12 using PCR products. PNAS 97: 6640–6645. 34. Sambrook J, Russell D (2001) Molecular cloning: a laboratory manual. Cold Spring Harbor Laboratory Press, Cold Spring Harbor, NY. 35. Chaveroche MK, Ghigo JM, dEnfert C (2000) A rapid method for efficient gene replacement in the filamentous fungus Aspergillus nidulans. Nucleic Acids Res 28: E67. 36. Campoy S, Jara M, Busquets N, Perez AM, Badiola I, et al. (2002) Role of the high-affinity zinc uptake znuABC system in Salmonella enterica serovar Typhimurium virulence. Infect Immun 70: 4721–4725. 37. Davis RW, Botstein D, Roth JR (1980) Advanced bacterial genetics. A manual for genetic engineering. Cold Spring Harbor Laboratory Press, Cold Spring Harbor, NY. 38. Ling L, Zhou F, Huang L, Li Z (2010) Optical forces on arbitrary shaped particles in optical tweezers. J Appl Phys 108: 073110. 39. Volpe G, Petrov D (2006) Torque detection using Brownian uctuations. Phys Rev Lett 97: 210603. 40. Berg HC (2004) E: coli in motion. Springer, New York. 41. Collins AL, Stocker BA (1976) Salmonella typhimurium mutants generally defective in chemotaxis. J Bacteriol 128: 754–765. 42. Warrick HM, Taylor BL, Koshland DE (1977) Chemotactic mechanism of Salmonella typhimurium: preliminary mapping and characterization of mutants. J Bacteriol 130: 223–231. 43. DeFranco AL, Parkinson JS, Koshland DE (1979) Chemotactic mechanism of Salmonella typhimurium: preliminary mapping and characterization of mutants. J Bacteriol 139: 107–114.
PLOS ONE | www.plosone.org
10
April 2013 | Volume 8 | Issue 4 | e61630