SIMULATION http://sim.sagepub.com/
A simulation-based decision support system for workforce management in call centers Asli Sencer and Birgul Basarir Ozel SIMULATION 2013 89: 481 originally published online 11 February 2013 DOI: 10.1177/0037549712470169 The online version of this article can be found at: http://sim.sagepub.com/content/89/4/481
Published by: http://www.sagepublications.com
On behalf of: Society for Modeling and Simulation International (SCS)
Additional services and information for SIMULATION can be found at: Email Alerts: http://sim.sagepub.com/cgi/alerts Subscriptions: http://sim.sagepub.com/subscriptions Reprints: http://www.sagepub.com/journalsReprints.nav Permissions: http://www.sagepub.com/journalsPermissions.nav Citations: http://sim.sagepub.com/content/89/4/481.refs.html
>> Version of Record - Apr 30, 2013 OnlineFirst Version of Record - Feb 11, 2013 What is This?
Downloaded from sim.sagepub.com at BOGAZICI UNIV LIBRARY on August 5, 2014
Simulation
A simulation-based decision support system for workforce management in call centers
Simulation: Transactions of the Society for Modeling and Simulation International 89(4) 481–497 Ó 2013 The Society for Modeling and Simulation International DOI: 10.1177/0037549712470169 sim.sagepub.com
Asli Sencer and Birgul Basarir Ozel
Abstract Workforce management is critical in call centers, where thousands of calls are handled by hundreds of agents every day. In a call center, where the call arrival rates tend to fluctuate during the day, the agent allocation plans are required to be planned flexibly and the number of operating call center agents ought to be updated whenever needed, in order to keep the customer satisfaction level over a predefined level. Workforce plans are usually generated by the use of queuing models that are based on Erlang C calculations. However, they have assumptions that oversimplify the real system and jeopardize the validation of the model. At this point, the simulation models, which do not have such restrictive assumptions, are effective in calculating the required number of agents for each time period and measuring the performance of a given shift schedule. In this study, a simulation-based decision support system (DSS) is developed that runs on real-time data for one of the largest call centers in Turkey. The graphical user interfaces (GUIs) are designed in accordance with the man–machine interaction consideration to increase the usability, functionality and effectiveness of the DSS. It is shown that the combination of the advantages of simulation with a flexible and user-friendly DSS environment provides more effective and efficient workforce planning and performance reporting in call centers.
Keywords simulation, call center, workforce management, decision support system
1. Introduction A company’s call center is its most visible strategic weapon. It is a business battlefront where millions of dollars of products and services are purchased, sold and traded. It is also a place where thousands of customers are won and lost every second of every minute. So the importance of call centers grows rapidly day by day, as companies become more creative in disseminating information and providing value to their customers over telephone lines.1 It has been stated by the International Customer Management Institute (ICMI) that about 5,500,000 agents were working in nearly 100,000 call centers across the world by 2008. From another perspective, with the growing number of agents working in the sector, labor costs constitute a substantial part of the business expenses. According to Gans et al.2 and Bouzada,3 the main expenses in a typical call center are due to human resources (64% of the total costs), far beyond those related to technology (16%), the second most expensive issue. So, it is crucial to determine correct strategies for staffing and workforce
schedules that directly affect the profitability and the efficiency of call centers. A general workforce management (WFM) problem is to optimally allocate the staff to predefined shifts such that the service level requirements are met at all times. More specifically, a classical eight-hour shift is composed of fixed time periods, say hours, and the average customer arrival rates differ between these periods, although the staff level is fixed in an eight-hour shift. The aim of workforce scheduling is to allocate the least number of agents to an eight-hour shift that will meet the minimum service level requirements at every one-hour period. The problem becomes more complex if there are different types of incoming customers and, moreover, if the staff members
Department of Management Information Systems, Bogazici University, Istanbul, Turkey Corresponding author: Asli Sencer, Department of Management Information Systems, Bogazici University, Bebek 34342, Istanbul, Turkey. Email:
[email protected]
Downloaded from sim.sagepub.com at BOGAZICI UNIV LIBRARY on August 5, 2014
482
Simulation: Transactions of the Society for Modeling and Simulation International 89(4)
are non-identical, that is, staff members belonging to different skill sets have different knowledge levels in handling particular types of incoming tasks. In the latter case, the decision variable is the number of staff to be allocated to an eight-hour shift from each skill set. Workforce scheduling in call centers is even more complex, since the period length in an eight-hour shift may be as short as 15 minutes, and the average arriving call rates change drastically between these periods in a day. Thus, it is impossible to treat each period independently, since the uncompleted services at a period can drastically decrease the service levels in the latter 15-minute periods. Noting that there are often unexpected increases/decreases in the incoming call rates due to non-prespecified campaigns, the workforce manager has to reallocate the staff urgently or use part-time agents so as to meet the minimum service levels at all 15-minute periods. The basic input of general workforce scheduling models is the minimum agent requirements in every 15-minute period to meet the customer service levels. Given this major input, the optimal agent allocation to an eight-hour shift can be derived by using mathematical programming methods as well as simulation techniques. When the customer arrival rates are stochastic and highly variable, mathematical modeling techniques, which aim to optimize the ‘‘expected’’ performance in the form of costs, service levels, etc., and ignore the variability in the output performance, often lead to unrealistic agent allocation plans that do not meet the minimum service levels at some periods. Another reason for this unfavorable result is that the minimum agent requirements in 15-minute periods are estimated by Erlang C calculations, which assume that arrival rates are Poisson, call types are identical, agents have identical skills, queues have no priorities, customers do not abandon the calls, etc. In the call centers where these assumptions do not hold, Erlang C estimations provide usually incorrect inputs to the mathematical or simulation models, which lead to unexpected output performances in application. To deliver both low operating costs and high service quality, call center managers are challenged with deploying the right number of agents with the right skills to the right schedules in order to meet an uncertain, time-varying demand for service. Traditionally, call center managers deploy a workforce management system (WFMS) to handle this problem. WFMS is the codeword for forecasting and scheduling software in the call center industry. With the help of WFMSs, demand forecasting, agent scheduling and performance tracking of the call centers are more rational and practical. Although WFMSs with analytical models have historically performed an important role in the management of call centers, they are based on the strict Erlang C assumptions that usually threaten the validity of the results, mentioned above. In today’s call centers, more
sophisticated approaches are needed to accurately describe the reality of operations. Simulation analysis is often used as an efficient methodology to overcome these limitations. With simulation methodology, ‘‘what-if’’ analysis can be performed and scenarios can be generated to evaluate the efficiency of workforce schedules, call handling strategies and call center design. The current study takes place in one of the largest call centers in Turkey (which will be referred to as ‘‘Company A’’) as part of a funded research project. The call center under consideration has a rather exceptional workforce management problem due to its location in Istanbul, one of the largest metropolitan cities in the world with 12 million citizens. A WFMS is used to generate the optimal daily agent allocation plans; however, the transportation of these agents between their houses and the call center location is an extremely costly process. With this motivation, two mathematical programming models have been developed ¨ rmeci et al.4 to handle the agent allocation problem by O and the transportation/routing problem. These models are solved iteratively by a heuristic method until a reasonably low-cost agent allocation plan is generated. Furthermore, a simulation model is generated to overcome the drawbacks of the Erlang C approximations used in the analytical models and provide further facilities by a simulation environment. For instance, call rates are highly affected by the temporary campaigns that may be set with a short notice by the marketing department. The workforce manager needs to fine tune the agent allocation plans during the day due to these unexpected increases in the call rates. Simulation analysis is appropriate for this purpose as well. With these inspirations, a simulation-based decision support system (DSS) is developed in this study for efficient WFM and accurate performance estimation in a call center. The developed system allows the call center executives to manage the workforce efficiently and flexibly with respect to the dynamically changing call rates during the day. The environment is tested in one of the largest call centers in Turkey and findings are discussed. The organization of the paper is as follows: In Section 2, a literature review on the usage of simulation methodology for WFM and simulation-based DSSs for call center management is introduced. In Section 3, the general architecture of the DSS is introduced and its basic components are generated. In Section 4, the DSS environment is illustrated by a scenario analysis and its functionalities are discussed. Section 5 provides the conclusion and the summary of the study.
2. Literature review There is an extensive and growing literature on workforce allocation at call centers. Detailed summaries of the callcenter-oriented literature are provided in Gans et al.2 and
Downloaded from sim.sagepub.com at BOGAZICI UNIV LIBRARY on August 5, 2014
Sencer and Ozel
483
Aksxin et al.5 The literature related to this study spans mainly two areas. The first deals with the deployment of simulation combined with analytical methods for WFM in call centers. The second deals with the simulation method as a decision support tool for call center management. Simulation has always played an important role in the call center design and management area. There are numerous studies where simulation is proposed as the most appropriate option for accurate performance measurement and subsequent decision support for call center management.6–8 In an early study, Chokshi9 utilizes simulation as a tool for strategic management for call center re-engineering purposes during a major Re-engineering Initiative at AT&T. Similarly, Tanir and Booth10 present a study in Bell Canada with Simprocess Software. They propose that discrete event simulation provides insight into a call center’s new trends, such as skill-based routing, electronic channels and interactive call handling; and helps to shape call center’s current and future designs. Miller and Bapat11 use simulation with Arena to predict business case benefits and return on investment for the acquisition and utilization of a new call routing technology. Saltzman and Mehrotra12 present a simulation study by Arena to visualize the call center operations of a software company before launching a new technical support program. Lam and Lau13 propose a simulation approach for restructuring call centers in a company that supplies services for computer and office equipment. They use ServiceModel Software for developing simulation models and show that the merger of existing resources into a single call center presents opportunity to the call center. In more recent studies, workforce scheduling approaches in call centers include models that combine analytical methods with simulation. Takakuwa and Okada14 simulate an inbound call center of a city-gas company with Arena to examine the target service level in order to find the optimal number of agents, considering their skills and scheduling of the agents to serve the generated calls. The objective is to minimize the total daily personnel expenses while satisfying a certain service level target. Atlason et al.15 use simulation to evaluate service-level performance of a proposed set of shifts and use integer programming in conjunction with the cutting plane method. Cezik and L’Ecuyer16 adapt the methodology of Atlason et al.15 to the optimal staffing of a multi-skill call center. They propose a model via linear programming and simulation in order to find the optimal solution for minimizing the staffing cost of a multi-skill call center. Avramidis et al.8 propose a simulation-based solution for the workforce scheduling optimization in multiskill call centers. Their solution approach is composed of the combination of simulation and linear programming that optimizes the staffing and the scheduling simultaneously. One of the major drawbacks of the simulation methodology is its requirement for a modeling expert in the
development and analysis of models. As a matter of fact, if a scenario analysis is needed to evaluate a middle- or longterm investment plan, a simulation study may be well performed by a team of experts in the context of a specialized project. However, if a what-if analysis is to be performed for tactical decisions such as daily updates in a workforce plan, the requirement for simulation expertise is more immediate. The dynamic decision-making environment of a DSS that includes an enhanced user interface is often proposed as remedy to this problem by the recent researchers. The studies that incorporate a simulation model into a DSS environment are summarized below. Gulati and Malcolm17 use a simulation model, created by Arena with a Visio interface, to compare the performance of three different approaches (heuristic, daily batches optimization and dynamic optimization) for call scheduling in an outbound call center. Chong et al.18 develop a simulation-enabled DSS for allocating check-in agents. This model is not developed for a call center, but the logic behind it is similar to the call center agent scheduling. A DSS is built through integration of descriptive resource simulation of Air Canada’s passenger check-in process in Arena with Visual Basic for Applications (VBA) front-end. A key output of the DSS is a feasible staff schedule according to what-if analysis results. Salzman and Mehrotra6 propose a simulation-based DSS for call center management. They develop a managerfriendly platform by using Arena and MS Excel to analyze the results with the given parameters and to ask empirical questions in order to discover the behaviors of the call center elements. Erdem and Gedikog˘lu19 propose a DSS framework for designing the shifts and allocating agents to the shifts in a call center, so that target service levels are met. In the proposed system, shifts are designed by solving a linear optimization model. Using this solution as the input, a simulation model is developed by Arena to dynamically update the workforce so that the minimum required service level is met at all times. Recently, Bouzada3 (2009) proposes a methodology to measure the sensitivity of the call center’s performance to potential modifications of critical variables in a large Brazilian call center. The methodology involves a simulation model in the Arena Contact Center software, which works as base case upon where the scenario and sensitivity analyses can be performed. The discussions above show that there are numerous studies that consider simulation as an efficient methodology in WFM in call centers. In the recent studies these models are further embedded into a DSS to achieve a flexible decision-making environment and attain sustainability in efficient decision making. In this study we develop a simulation-based DSS for a private bank call center with Arena Contact Center Software and VBA. The proposed model differs from most
Downloaded from sim.sagepub.com at BOGAZICI UNIV LIBRARY on August 5, 2014
484
Simulation: Transactions of the Society for Modeling and Simulation International 89(4)
Figure 1. The decision support system (DSS) structure. AHT: average handle time.
of the previous models by allowing allocation in a multiskill environment. Similar to Bouzada,3 Arena Contact Center Software, which provides specific panels to contact center simulation and thus enables efficient modeling of contact center operations, is used in this study.
3. The development of the decision support system environment A DSS is a model-based or knowledge-based computerized information system intended to support business and organizational decision-making activities in semi-structured or unstructured situations.20 A properly designed DSS extends the user’s decision-making capabilities through analyzing useful information from many data sources and combining them with the decision maker’s own insights. Therefore, a DSS is a combination of database, model
base, knowledge base, graphical user interface (GUI) and user, which improves management performance, speeds up the decision-making process and provides better monitoring activities. In this section, the general architecture of the DSS is introduced and its basic components are generated. ‘‘CALLSIM’’ supports the agent allocation decisions in a call center and allows the decision makers to perform a series of ‘‘what-if’’ analysis to see how the changes in certain inputs, such as call arrival rates, average handle times (AHTs) or agent allocation plans, affect the performance measures of the call center.
3.1. The DSS architecture The structural overview of the generated DSS is demonstrated in Figure 1 and the components of the DSS are
Downloaded from sim.sagepub.com at BOGAZICI UNIV LIBRARY on August 5, 2014
Sencer and Ozel
485
Table 1. Knowledge levels of agents from a certain skill set in answering different call types (1: moderate, 2: high). Skill sets
English 1 English 2 English 3 Fund Card CC Password CC Password 2
Call types Card
Banking
Password
Fund
English
Campaign
1
1
1 1 2 1 2 1 1
1
1 1 1
1
1 1 1
1
1
1 1 1 1
Application
CC password
1 1
1 1
1 1 1
1 1 1
CC: credit card.
introduced as a model base, GUI and a data repository. The MS Excel data repository covers the input data needed and the output data generated after the model is run. It keeps default distributions and historical data for daily call arrival rates of each call type in 30-minute periods, service time distributions of each call type, that is, AHT, and agent allocation plans. Every time the user selects the day on which the simulation model is to be run, the model input values are retrieved from the DSS data repository and are written into the simulation model objects. If the user wants to make scenario analysis on the current system, then the changes on the default values are transferred via the GUIs to the model data repository, in order to be input to the simulation model. At the end of the simulation runs Arena reports are created respectively for contact times, contact counts and agent groups. Contact times and contact counts are reported for each call type; on the other hand, agent group reports are created for each agent group. These reports are transferred to the data repository; thereafter, the performance measures are calculated and the performance reports are prepared in MS Excel in the required formats. The model base of the DSS is a simulation model and it is developed with the Arena Contact Center Module (Version 11.00). To determine the impact of a change in the input values on the model, the simulation model can be externally accessed via the user interfaces and externally manipulated with the help of VBA codes. The simulation model receives the input data from the data repository, and runs through the GUI. The third component of the DSS is the GUI. The call center manager is the main user of the DSS, who interacts with the system by changing the input values in the system and evaluating the outputs generated by the DSS. The GUIs are developed by using the VBA programming language in the MS Excel environment. Noting the great impact of the GUI on the usability, functionality and effectiveness of the DSS, the GUI has been designed in accordance to the human–machine interaction considerations that exist in the literature.20
3.2. Model base of the DSS: the simulation model In this section, a simulation model is developed that takes the agent allocation plan, call arrival rates and average call handle times as inputs and reports the performance measures, such as service level, average speed of answer, abandonment rate and agent utilization rate. In the progress of the study, the developed simulation model is utilized as the model base of the DSS for agent allocation. 3.2.1. Company overview. Company A groups its services under three main headings: Regular Campaign Calls, Temporary Campaign Calls and Routine Calls. Regular Campaign Calls involve campaigns provided in regular periods during a year; Temporary Campaign Calls are for services in temporary campaigns that can be set anytime; and Routine Calls are for services that exist permanently in the interactive voice recognition (IVR) system. There are eight different types of routine calls that can be answered by 363 agents from seven different skill sets, as shown in Table 1. The current study considers the Routine Calls and aims to develop a DSS to find the best agent allocation plan where the service level considerations are met. 3.2.2. Problem definition and objective. In a call center, an arriving call enters the trunk line, that is, the transmission channel between the caller and the agent. If the capacity of the transmission line is full, the caller gets a busy tone and has to dial the phone once again; otherwise, it is directed to the IVR system, which provides standard services. The IVR system is a self-service application that provides information to callers and performs standard services without the use of human agents so as to reduce cost and improve customer experiences. Service requests that cannot be fulfilled by the IVR system are directed to the queue of the related agent group. WFM deals with the problem of creating a daily work schedule for the call center staff at a low cost while attaining a satisfactory service level for incoming calls. The minimum average service level is based on the 80/20 rule,
Downloaded from sim.sagepub.com at BOGAZICI UNIV LIBRARY on August 5, 2014
486
Simulation: Transactions of the Society for Modeling and Simulation International 89(4)
Figure 2. Current shift schedule.
which means that at least 80% of the incoming calls should be handled within 20 seconds in every 15-minute period. In Company A, there are eight different nine-hour shifts in a day, some of which are overlapping to handle the extra workload during the peak hours (Figure 2). The company needs a daily staff schedule that enables it to meet the target service level and keep agent utilizations at reasonable levels in every 15-minute period. To reach this objective, Company A utilizes a WFMS. The current system has two basic drawbacks. Firstly the minimum agent requirements in each 15-minute period are estimated by the Erlang C calculations, which result in unreasonable service levels. Secondly, total agent allocation cost includes only the regular salaries of the agents. However, in large metropolitan cities like Istanbul, the cost of transporting agents between their houses and the call center location every day is considerably high and should be included in the total cost of a daily agent allocation plan. With this motivation, mathematical models are devel¨ rmeci et al.4 to provide an optimal daily agent oped by O allocation plan that minimizes the total allocation costs and the transportation costs of the agents. Nonetheless, these models still use Erlang C estimations for the minimum agent requirements in a 15-minute period as the model input. Thus, a simulation-based DSS environment is generated in this study to test the performance of the agent allocation plan proposed by the mathematical models in ¨ rmeci et al.4 The proposed plan is applied if the service O levels are found to be above the minimal requirements by the simulation model. Otherwise, the optimal agent allocation is found by scenario analysis in the simulation model. An allocation plan might be subject to changes during its application as well. Call rates might suddenly rise during the day due to some short notice temporary campaigns and the system might fail to adopt the already planned schedule to this new event. The proposed DSS allows the call center executives to observe the performance metrics under real-time data and enables them to fine tune the staff allocation simultaneously to attain the service-level objectives. They can also utilize ‘‘what-if’’ analysis in order to observe the effects of momentary changes on call arrival rates or call handling times.
3.2.3. Required inputs for the simulation model. In order to develop the simulation model, the following annual input data have been obtained from Company A. 1.
2.
3.
4.
5. 6.
Call types: there are eight call types, such as credit card (CC) operations, banking operations, password, fund inquiries, English communication, campaigns, credit application follow-up and CC password. Call arrival rates per call type: call arrival rates have been obtained for each call type for one year. AHT per call type: average call handle times, that is, the service times have been obtained in periods of 15 minutes for each call type for one year. Agent skill sets: there are seven different agent skill sets. The call types that can be handled by those are shown in Table 1. The entries in the table show the knowledge level of the agent for responding that call type, where level 2 indicates a higher knowledge level than level 1. For example; if a ‘‘Password’’ call enters the system, an ‘‘English 3’’ or ‘‘Card’’ agent with level 2 knowledge handles the call. If both these agents are unavailable, then an agent with level 1 knowledge of ‘‘Password’’ answers the call. Agent capacity: agent capacity of each skill set is provided by Company A. Queuing priorities per call type: incoming calls are answered in accordance with their priorities rather than a first-come-first-served (FCFS) rule. Queuing priorities for eight call types differ from each other as follows: Highest priority: fund inquiries, English communication; High priority: banking operations; Medium priority: CC operations, password; Low priority: campaign, CC password, credit application follow-up. An arriving call gets into the queue of the related parent agent group defined in the Arena Contact Center Module. In a multi-skill environment, an
Downloaded from sim.sagepub.com at BOGAZICI UNIV LIBRARY on August 5, 2014
Sencer and Ozel
7.
8.
487
agent can be in more than one parent agent group. If there are calls from different call types waiting in the queue of other parent groups, the next available agent is assigned to a call according to its queuing priority. For example, if there is only a ‘‘Credit card operations’’ call in the system, an agent from the ‘‘Card’’ parent group will be assigned to handle this call. However, if there are both ‘‘Credit card operations’’ and ‘‘Banking operations’’ calls waiting in the queues, the ‘‘Banking operations’’ call has priority to be served initially by the next available agent. Shift design: shifts are designed monthly. The current shift design in the system is shown in Figure 2, showing the fixed time intervals of the shifts. Agent recesses: agent recessing can be planned flexibly according to some rules, which are: (i) lunch/dinner break takes 50 minutes; (ii) there are two coffee breaks, one before and one after lunch/dinner, and each of them takes 20 minutes;
9.
(iii) the first coffee break is assigned 1–3 hours after the beginning of each shift; (iv) the lunch/dinner break is assigned 2.5–4 hours after the beginning of each shift; (v) there should be at least 30 minutes between two breaks; and (vi) there should be at least 30 minutes of working time after the last break. Company A was not able to provide information about the exact number of agents on breaks or lunch/dinner in each shift, so we have planned two consecutive breaks and lunch/dinner for each shift and assigned half the agents to the first break, then assigned the second half to the consecutive break to avoid the complete loss of agents in a shift. Figure 3 shows the agent recesses in the current shift schedule. Skill-set-based agent allocation: skill-set-based agent allocation is the basic input of the simulation model and it is prepared for each day of a month. Table 2 shows the number of agents assigned from each skill set to each shift at a selected day.
Figure 3. Agent recess schedule, that is, meal/coffee breaks in each shift.
Table 2. Agent allocation plan on a selected day (# of agents from each skill set in a shift). Shifts
Shift 1 (00:00–09:00) Shift 2 (07:45–16:45) Shift 3 (08:00–18:00) Shift 4 (09:00–18:00) Shift 5 (09:00–20:00) Shift 6 (11:00–20:00) Shift 7 (11:00–22:00) Shift 8 (18:00–01:00)
Skill sets English1
Fund
English2
CC password1
English3
Card
CC password2
0 6 0 1 1 0 0 0
1 14 9 59 3 14 14 20
0 3 0 0 0 0 0 0
0 17 0 7 0 0 0 2
0 0 0 3 0 0 0 0
1 1 2 41 2 9 7 15
0 0 0 8 5 0 0 1
CC: credit card.
Downloaded from sim.sagepub.com at BOGAZICI UNIV LIBRARY on August 5, 2014
488
Simulation: Transactions of the Society for Modeling and Simulation International 89(4)
Figure 4. Annual averages of call arrival rates in each 15-minute slot for ‘‘banking’’ calls.
10.
Reneging time: reneging time is the duration until a caller hangs up before an agent responds to his/ her contact attempt. This metric provides insight to an important output measure: abandonment rate. Company A provides the distribution of the reneging time to be used in the simulation model.
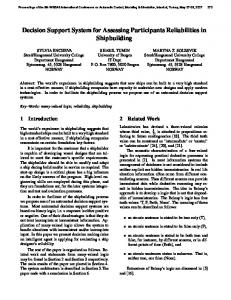
3.2.4. Statistical analysis of the input data. Analysis of call arrival rates and average call handle times, which are provided by Company A in 15-minute periods, are explained below in detail. Noting that there are 96 periods of 15 minutes in a day in a 24/7 call center, over 30,000 data points have been analyzed to estimate the call arrival rate distribution or AHT distribution for each call type. 3.2.4.1. Statistical analysis of call arrival rates per call type. Starting with January, call arrival rates in 15-minute intervals for each call type are plotted for each day of the week to check whether the call arrival rates and call patterns differ on a weekly basis. For any selected weekday, if there are no significant differences in rates and patterns between the weeks of a month, the monthly call rate averages are calculated for each 15-minute period for this weekday. The resulting plot is used to recognize the rate and pattern differences, if any, between months, for a selected weekday. If there is no significant rate and pattern difference between monthly averages, the yearly average of this weekday is calculated for each 15-minute period for this weekday. As an example, we compare the monthly call rate averages for ‘‘Banking operations’’ and observe that the average call arrival rates and call patterns are similar between Tuesdays, Wednesdays and Thursdays; however, all other days of the week are treated separately. To statistically support this conclusion, we build 95% confidence intervals for the average call arrival rates in 15minute slots for ‘‘Banking operations’’ calls. In this way we identify the periods in which the call arrival rates differ significantly during the week. The results show that the average call arrival rates on Mondays are clearly higher than other weekdays, whereas the call rates on Fridays are lower than on other weekdays. In the weekend analysis,
Saturdays and Sundays are handled separately. The results of the analysis are shown in Figure 4. It is assumed that the probability distribution of call arrival rates is Poisson, where the mean rate is defined by the averages obtained by statistical input analysis. 3.2.4.2. Statistical analysis of AHTs. The AHTs for each call type are obtained from Company A in 15-minute periods for 11 months. Compliance of the data to the theoretical distributions is analyzed with the ‘‘Input Analyzer’’ Module of Arena Software based on chi-square tests and sum of squares of deviations from the theoretical distributions. As a matter of fact, since the size of the data is around 30,000 for each call type, none of the theoretical distributions can pass the goodness-of-fit tests. When the sample size is small, any deviation from the theoretical distribution may be attributed to a sampling error; however, for large sample sizes this statement is not valid and thus goodness-of-fit tests fail most of the time. Therefore, it is decided to use empirical distributions for call handle times in the simulation model. 3.2.5. Simulation model development with Arena Contact Center Edition. In this section, the modeling elements of the contact (or call) center process and the components of contact center simulation-specific modules in Arena Contact Center Edition (Version 11.00) are explained. The basic process of contact center simulation is to generate a stream of arriving contacts, assign them to trunk lines, route them through the contact center to an agent and terminate the contact.21 The basic motivation for the choice of special-purpose simulation software for contact center modeling is the fact that there are standard modules for common call center functions and properties. For instance, agent skill groups and their knowledge levels in fulfilling different tasks can be easily defined. The same argument holds for defining call types, their priorities, agent selection rules, etc. Working schedules of agents and the breaks during the shifts are regular settings that can be updated easily in this environment. Arena provides the collection of the standard call center performance measures as well.
Downloaded from sim.sagepub.com at BOGAZICI UNIV LIBRARY on August 5, 2014
Sencer and Ozel
489
Figure 5. Relationship between contact center basic components (Rockwell Automation21).
Service levels, that is, the percentage of calls that can be handled in 20 seconds, call abandonment rates, that is, the percentage of callers that hang up before reaching an agent, and agent utilizations are calculated in predefined intervals; and reports are generated. Arena offers a userfriendly modeling environment that can be integrated with a database system, as well as GUIs for data input and reporting. It integrates VBA into its product architecture so that users may create their own utility tools and custom interfaces. Based on all these issues, special-purpose simulation software is used in this study for modeling and scenario analysis. To create a simulation model of a contact center in Arena, the sequence of events that occurs as contacts move through the system is described. Specific information about the contact center itself, such as trunk line capacity, agent skills, agent schedules, etc., is also needed as inputs to the simulation model. Therefore, the basic components of call center simulation process are: (i) contacts; (ii) arrival patterns; (iii) trunk groups; (iv) routing scripts; (v) agent groups; (vi) parent groups; (vii) agent skills; and (viii) schedules. The relationships between these components are shown in Figure 5. Contact center modeling and analysis begins with describing different types of contacts, that is, calls. Each contact is characterized by its service time, AHT, its inter arrival distribution and the trunk group on which the contacts enter the center. In our model there are eight contact types. Figure 6 shows the contact data modules for modeling card calls.
Figure 6. Contact data for modeling card calls.
Downloaded from sim.sagepub.com at BOGAZICI UNIV LIBRARY on August 5, 2014
490
Simulation: Transactions of the Society for Modeling and Simulation International 89(4)
Arrival patterns describe contact arrivals by specifying expected contact counts for each timeslot. The arrival times of contacts for each timeslot are randomly generated according to a Poisson process with the defined rate. In this study, the average call rates in 15-minute periods are determined by the input data analysis described above. Trunk groups: trunk groups represent phone line groups that are dedicated to a particular set of contact types. Trunk groups have an associated capacity, cost and a default routing script and contact priority. In our system there is a single trunk line with infinite capacity. Routing scripts: routing scripts are sequences of actions that control the flow of contacts through the call center’s system. In our model there are eight scripts corresponding to each type of call. As an example, Figure 7 shows the script for card type calls. Agent groups: an agent group represents a group of agents within the contact center who have the same skill sets and follow the same shift schedule. From a simulation modeling perspective, an agent group is a set of identical agents. In our model there are seven agent skill sets allocated to eight shifts in a day. Parent groups: a parent group is a collection of agent groups. Parent groups are used to implement simultaneous queuing, to simplify routing scripts and to collect statistics across a set of agent groups. In our model, there is an agent parent group identified by each call type. Agent skill sets: agent skill sets define the knowledge level of an agent from a certain skill set in fulfilling the service of a call type. They are composed of what contacts the agent is skilled to handle, the priority in which the agent will handle available work and the agent’s proficiency in each contact.
Figure 7. Script for modeling card calls.
Schedules: schedules define the timetable, which shows when agents are available to handle contacts. Each schedule specifies on-duty shifts for each day in the planning horizon. In addition, they can include lunches, breaks, meetings or other off-duty time. In addition to basic elements, the planning horizon, which indicates the length of the simulation run, and timeslots, which indicate granularity of data specification and collection, need to be defined. The planning horizon is typically one day and a period is 30 minutes. Arena Contact Center Edition Version 11.00 provides specific panels of Contact Data and Script for call center simulation. The Contact Data panel contains modules that are used to describe the various components of the contact center, such as an agent group or a contact name that describes a call type. The Script panel contains modules that are used to create a contact’s routing script. The details of the Arena simulation model are provided by Basarir.22 3.2.6. Validation of the simulation model. Validation of the simulation model is performed to determine whether the simulation model adequately represents the real system. A valid simulation model provides outputs that are aligned with the real system outputs. In the validation study, the simulation model is tested to see whether the model behavior shows an exact copy of the real system behavior. For validation purposes, the average service levels of the real system on a selected day are compared with the simulation model results. ‘‘Fund’’ and ‘‘English’’ call types have the highest queuing priorities. There are three different agent groups that can handle the ‘‘English’’ call type. The ‘‘Fund’’ calls are handled by two different agent groups called ‘‘English1’’ and ‘‘Fund-agents’’. The actual service levels and the average model outputs for these two call types are shown in Figures 8 and 9. Although generally a similar trend is observed between the actual and model output, the actual service levels have
Figure 8. Comparison of service levels for fund calls.
Downloaded from sim.sagepub.com at BOGAZICI UNIV LIBRARY on August 5, 2014
Sencer and Ozel
491
Figure 9. Comparison of service levels for English calls.
Figure 10. The main page of the decision support system.
higher variability in some periods. The main reason for these differences is attributed to the uncertainties in the recess times used as input in the model. The current information system of the company fails to keep track of the exact coffee and meal breaks of the agents. For a sound validation, the input data for the simulation model and the real system should be the same to be able to compare the results precisely. However, it is still noted that the general decreasing/increasing behaviors of the model averages and the real-time averages of the service levels do coincide. Besides, the daily averages of the service levels of the actual system and the model are similar; thus, the generated simulation model is found to be validated. Hence, the
simulation model can be used to make scenario analysis so as to improve the system performance.
3.3. GUI of the DSS The GUI is another basic component of a DSS. In this section, the GUI is introduced by providing examples of the generated screens. The welcome page of the DSS is shown in Figure 10. After reading a brief instruction about the purpose of the CALLSIM, the decision maker can decide on the day to run the simulation model. The welcome page also provides a decision area for scenario analysis. The decision maker
Downloaded from sim.sagepub.com at BOGAZICI UNIV LIBRARY on August 5, 2014
492
Simulation: Transactions of the Society for Modeling and Simulation International 89(4)
Figure 11. Input screen – call arrival rates.
can change model inputs values, such as call rate, AHT and agent allocation plans, or can create alternative scenarios for what-if analysis. If the decision maker wants to create a new simulation scenario, the related input screens are opened sequentially. As an example, call arrival rates can be changed for each call type in each 30-minute timeslots on ‘‘Call Arrival Rates’’ screen, as shown in Figure 11. After all input distributions are defined by the DSS user through the user interfaces, the input data in the model data repository are written automatically in the simulation model, and the simulation model is triggered to run for 10 replications with the given inputs. After the simulation run is completed, the system automatically displays the ‘‘Simulation Results’’ screen, as shown in Figure 12, which enables one to observe the average values for the output measures, such as Service Level, Average Speed of Answer and Abandonment Rate. The tabulated results present the average values of the 10 replications. The average service level, average speed
of answer and average abandonment rate are calculated on call type basis, and the user can display the output graphics of each call type in 15-minute timeslots with upper and lower limits of 95% confidence intervals by clicking on the related ‘‘GRAPH’’ button. An example of a graphics screen is shown in Figure 13. Another output measure of the DSS is the average agent utilizations, which are calculated for each agent group respectively, as seen in Figure 14.
4. Illustration of the decision support system environment In this section, the flow of activities in CALLSIM is illustrated at Company A by a scenario analysis. An alternative agent allocation plan is introduced, which enables the 80% service level objective for all call types to be achieved. Currently, the shift allocation plan that has been generated by the existing WFMS is used as given in Table 2; however, the service level objective is not met
Downloaded from sim.sagepub.com at BOGAZICI UNIV LIBRARY on August 5, 2014
Sencer and Ozel
493
Figure 12. Output screen – simulation results.
Figure 13. Output screen – service levels for banking calls.
for all call types. In order to find a better agent allocation plan, 25 different scenarios with different agent allocation plans have been run with the simulation model. After each scenario run, the service level graphics and agent
allocation plan results are carefully analyzed and the next agent allocation plan is generated accordingly. At the end of the what-if analysis, it is proposed that the number of agents working in the call center should be raised to 335
Downloaded from sim.sagepub.com at BOGAZICI UNIV LIBRARY on August 5, 2014
494
Simulation: Transactions of the Society for Modeling and Simulation International 89(4)
Figure 14. Output screen – average agent utilizations.
Table 3. Alternative agent allocation plan on a selected day (# of agents from each skill set in a shift). Shifts
Shift 1 (00:00–09:00) Shift 2 (07:45–16:45) Shift 3 (08:00–18:00) Shift 4 (09:00–18:00) Shift 5 (09:00–20:00) Shift 6 (11:00–20:00) Shift 7 (11:00–22:00) Shift 8 (18:00–01:00)
Skill sets English1
Fund
English2
CC password1
English3
Card
CC password2
0 6 0 1 1 0 0 0
1 10 15 10 3 10 8 10
0 2 0 0 0 0 0 0
0 0 0 0 0 0 0 0
0 0 0 3 0 0 7 0
2 15 25 35 20 31 20 18
0 25 0 27 5 0 10 15
CC: credit card.
agents from 266 agents, and the final skill-set-based agent allocation plan is figured out as shown in Table 3. Figure 15 shows the comparison of daily average service level of each call type between the current system and the proposed scenario. In the current system, the minimum 80% service level requirement is not met for some call types. For instance, even though the ‘‘English’’ call type has the highest priority, the overall service level is under 80%. Furthermore, the service levels of the lowest priority calls, ‘‘Credit application follow-up’’, ‘‘Credit card password’’ and ‘‘Campaign’’, are far below the acceptable level. Consequently, average speed of answer (ASA) and
the average abandonment rate are higher for these call types. However, it can be observed in the proposed scenario that the minimum service level requirement of 80% is reached for every call type. Figure 16 shows the comparison of daily average speed of answer of each call type between the current system and the proposed scenario. It can be observed that the average speeds of answer times are relatively lower than the current system in this case, which is intuitive, due to the increased service levels in the proposed scenario. Figure 17 shows the comparison of overall daily average abandonment rate of each call type between the current
Downloaded from sim.sagepub.com at BOGAZICI UNIV LIBRARY on August 5, 2014
Sencer and Ozel
495
Figure 15. Comparison of average service levels – scenario 1.
Figure 16. Comparison of average speed of answers (ASA) – scenario 1.
Figure 17. Comparison of average abandonment rates – scenario 1.
system and the proposed scenario. It can be observed that the average abandonment rates in this case are relatively lower than the current scenario. Table 4 shows the comparison of overall daily utilization rate of each agent group between the current system and the proposed scenario. In the comparison table, averages in the first line represent the results of the current system, and averages in the second line represent the
proposed scenario results. If no agent is assigned to a shift, then the average utilization rate of the corresponding shiftskill-set combination is shown as ‘‘not applicable’’. Noting that a comfortable and sustainable level of agent utilization is around 85–88%, the results of the proposed scenario are quite satisfactory. If agents work at higher levels of utilization on their routine, the call center is likely to encounter problems of staff sickness or turnover.
Downloaded from sim.sagepub.com at BOGAZICI UNIV LIBRARY on August 5, 2014
496
Simulation: Transactions of the Society for Modeling and Simulation International 89(4)
Table 4. Daily average utilization rate per agent group in the current system (line 1 in each cell) and the proposed scenario (line 2 in each cell) (%). Shifts
Skill sets English1
Fund
English2
CC password1
English3
Card
CC password2
Shift 1 (00:00–09:00)
N/A
Shift 2 (07:45–16:45)
87.9 84.2 N/A N/A 90.0 87.5 93.0 86.4 N/A N/A N/A N/A N/A N/A
48.9 40.2 87.7 84.1 88.7 84.9 93.1 91.4 94.4 89.3 98.7 92.2 98.5 91.9 86.6 79.0
N/A N/A 78.3 66.1 N/A N/A N/A N/A N/A N/A N/A N/A N/A N/A N/A N/A
N/A N/A 77.3 N/A N/A N/A 86.3 N/A N/A N/A N/A N/A N/A N/A 82.8 N/A
N/A N/A N/A N/A N/A N/A 94.4 91.0 N/A N/A N/A N/A N/A 91.7 N/A N/A
49.9 45.0 85.3 83.8 89.6 84.4 94.1 90.9 95.4 88.4 98.9 91.5 98.9 91.2 87.4 78.5
N/A N/A N/A 69.7 N/A N/A 89.6 78.6 91.4 73.2 N/A N/A N/A 75.8 81.9 61.0
Shift 3 (08:00–18:00) Shift 4 (09:00–18:00) Shift 5 (09:00–20:00) Shift 6 (11:00–20:00) Shift 7 (11:00–22:00) Shift 8 (18:00–01:00) CC: credit card.
Moreover, if the agent utilizations are very high, queue sizes and abandonment rates are likely to arise with unexpected increases in call rates. As a result of this analysis, it is proposed to increase the total agent size by 26% and change the agent allocation plan. The basic reason is the fact that the call rates show a dynamic behavior with high deviations in a day and it is necessary to increase the fixed workforce size to satisfy the service level requirements at all times. As matter of fact, the fixed shifts that appear in Figure 2 can be redesigned to decrease the total workforce requirement as a further improvement.
5. Conclusion In this study, our aim is to develop a flexible DSS environment for call center WFM that provides valid and precise solutions in agent allocation planning and offers detailed reporting facilities. The DSS receives an agent allocation plan generated optimally by a set of optimization models ¨ rmeci et al.4 and tests its performance in a as appear in O simulated environment. The agent allocation plan is applied if the service levels, abandonment rates and agent utilizations are found to satisfy the target levels; otherwise, the simulation environment is used to fine tune the agent allocation to propose a better solution. Although WFMSs with analytical models have historically performed an important role in the management of call centers, they are based on the strict Erlang C assumptions that usually threaten the validity of the results. We claim and show in this study that simulation modeling should be used in addition to mathematical modeling methodologies in WFMSs to generate a fast, reliable and
efficient decision-making environment. WFMSs without the added features of the simulation capabilities generate unreliable agent allocation plans due to the strict queuing assumptions of the tool. The study has been conducted in one of the largest call centers in Turkey. A simulation model is generated and integrated with a flexible and user-friendly DSS environment to help users in decision making. Since the DSS design directly affects the usability, functionality and effectiveness of a DSS, the steps for analyzing the user requirements, tasks and goals, maintaining clarity and consistency are precisely followed. In the pilot study of the DSS, it is observed that the DSS enables an effective and efficient solution platform for agent allocation problem in call centers. The developed DSS works with both theoretical distributions and real-time data. Users can execute scenario analysis in order to understand the call center dynamics, and report the performance measures of the call center, such as service level, abandonment rate, ASA and agent utilization rates. Nevertheless, it is experienced that the simulation software Arena Contact Center Module (V11.00) that has been used to develop the simulation model provides a very efficient modeling, testing and analysis environment. As a future study, the DSS environment can be integrated with other modeling tools that are used to obtain the optimal agent allocation plan for a given day. Furthermore, the tool should be integrated with the current information system of the call center for complete processing and decision support. Finally, the GUIs might be enhanced in accordance to the feedbacks that will be obtained from the users of the DSS.
Downloaded from sim.sagepub.com at BOGAZICI UNIV LIBRARY on August 5, 2014
Sencer and Ozel
497
Funding This work was supported by TUBITAK (Research Project #106M175) and Bog˘azicxi University Research Foundation (Project #09HN301D).
References 1. Bapat V and Pruitte EB Jr. Using simulation in call centers. In: simulations- and automations-technologie GmbH, 1999. 2. Gans N, Koole G and Mandelbaum A. Telephone call centers: tutorial, review, and research prospects. Manuf Serv Oper Manag 2003; 5: 79–14. 3. Bouzada MAC. Scenario analysis within a call center using simulation. J Oper Supply Chain Manag 2009; 2: 89–103. ¨ rmeci L, Aksen D, Erdem AS, et al. Workforce planning in 4. O call centers. Research Project Report (TUBITAK 106M175), 2008. 5. Aksxin Z, Armony M and Mehrotra V. The modern call center: a multi- disciplinary perspective on operations management research. Prod Oper Manag 2007; 16: 665–688. 6. Saltzman RM and Mehrotra V. A manager-friendly platform for simulation modeling and analysis of call center queuing systems. In: proceedings of the 2004 winter simulation conference, 2004, pp.466–473. 7. Avramidis AN and L’Ecuyer P. Modeling and simulation of call centers. In: proceedings of the 2005 winter simulation conference, 2005, pp.144–152. 8. Avramidis AN, Gendreau M and L’Ecuyer P. Simulationbased optimization of agent scheduling in multiskill call centers. In: 2007 Industrial Simulation Conference, 2007. 9. Chokshi R. Decision support for call center management using simulation. In: Proceedings of the 1999 Winter Simulation Conference, 1999, pp.1634–1639. 10. Tanir O and Booth RJ. Call center simulation in Bell Canada. In: proceedings of the 1999 winter simulation conference, 1999, pp.1640–1647. 11. Miller K and Bapat V. Case study: simulation of the call center environment for comparing competing call routing technologies for business case ROI Projection. In: proceedings of the 1999 winter simulation conference, 1999, pp.1694–1700. 12. Saltzman RM and Mehrotra V. A call center uses simulation to drive strategic change. Interfaces 2001; 31: 87–101. 13. Lam K and Lau RSM. A Simulation approach to restructuring call centers. Bus Process Manag J 2004; 10: 481–494.
14. Takakuwa S and Okada T. Simulation analysis of inbound call center of a city-gas company. In: proceedings of the 2005 winter simulation conference, 2005, pp.2026–2033. 15. Atlason J, Epelman MA and Henderson SG. Call center staffing with simulation and cutting plane methods. Ann Oper Res 2004; 127: 333–358. 16. Cezik MT and L’Ecuyer P. Staffing multiskill call centers via linear programming and simulation. Manag Sci 2008; 54: 310–323. 17. Gulati S and Malcolm SA. Call center scheduling technology evaluation using simulation. In: proceedings of the 2001 winter simulation conference, 2001. 18. Chong K, et al. A simulation-enabled DSS for allocating check-in agents. INFOR 2003; 41: 259–273. 19. Erdem AS and Gedikog˘lu B. A DSS for shift design and workforce allocation in call centers. In: proceedings of Portland international conference on management of engineering and technology (PICMET), 2006, pp.1279–1289. 20. Hanna MM, Ahuja RK and Winston WL. Developing spreadsheet-based decision support systems. Dynamic Ideas, 2007. 21. Rockwell Automation. Arena contact center user’s guide, Rockwell Automation Technologies, 2006. 22. Basarir B. A simulation based decision support system for workforce management in call center centers. MA Thesis in Management Information Systems, Bog˘azic xi University, 2011.
Author biographies Asli Sencer is an Associate Professor in the Department of Management Information Systems at Bogazici University, Istanbul, Turkey. She received her BS, MS and PhD degrees in industrial engineering at Middle East Technical University, Bilkent University and Bogazici University in Turkey, respectively. She is currently interested in the development of decision models and DSSs for WFM in call centers, supply chain management and business process management. Birgul Basarir Ozel received her BS at Marmara University and MS degree at Bogazici University, Istanbul, Turkey, in the area of management information systems (MISs). She has worked as a MIS advisor for three years and she is currently employed as a customer relationship management specialist in the private sector.
Downloaded from sim.sagepub.com at BOGAZICI UNIV LIBRARY on August 5, 2014