A small neural net simulates coherence and short-term memory in an insect olfactory system. N. Schinor and F. W. Schneider*. Institute of Physical Chemistry, ...
A small neural net simulates coherence and short-term memory in an insect olfactory system N. Schinor and F. W. Schneider* Institute of Physical Chemistry, University of W uerzburg, Am Hubland, 97074 W uerzburg, Germany Received 12th April 2001 First published as an Advance Article on the web 30th August 2001
We present a simple neural network model which simulates the experimental action potentials measured by Laurent and coworkers from single local (LN) and projection neurons (PN) in the olfactory system of an insect, the locust. Our recurrent network consists of one LN and 80 PNs where the individual units (neurons) are described by the HodgkinÈHuxley model. Bifurcation diagrams for the isolated neurons are calculated, where the PNs are oscillatory whereas the LN is treated as a non-oscillatory steady state neuron. The PNÈPN and PNÈLN synapses are excitatory. Inhibitory synaptic coupling between the LN and all 80 PNs causes all PNs to Ðre coherently generating a local Ðeld potential which precedes the LN by a small phase-shift. The LN and the PNs receive a scaled antennal nerve current from the olfactory receptor neurons (ORNs) where the receptors bind odor molecules with speciÐc binding constants in a simple ““ open ÏÏ binding process. We assume, that the odor-bound receptors exist in two states ; an active state (R ) and an inactive state (R ) leading to 1 2 adaptation where R is assumed to be proportional to the antennal nerve current. All synaptic strengths are 1 augmented by small increments for each successive odor presentation. Thus, the short-term memory e†ect which has been measured by Stopfer and Laurent (M. Stopfer and G. Laurent, Nature, 1999, 402, 664) in 10 repeated presentations of the same odor, is successfully simulated : the PN action potentials decrease in intensity, successive signatures simplify and the PN-coherence increases. High PN-frequencies ([50 Hz) abolish the coherence in the range 20È50 Hz. A previously augmented synaptic strength is retained after 10 trials and a 30 s resting period to produce coherence in a ““ naive ÏÏ part of the antenna in a subsequent trial.
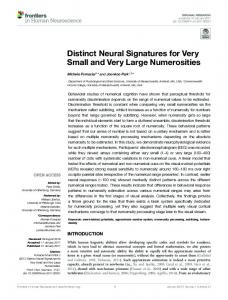
1. Introduction Motivated by analogies to the network dynamics of nonlinear chemical reactions1 we present some model calculations on the fascinating experiments of Laurent and coworkers2h7 who studied the dynamic behaviour of single neurons in the olfactory network of the locust. In particular Stopfer and Laurent8 described short-term memory e†ects over successive odor presentations. Although model calculations are not able to quantitatively reproduce these transient action potentials, they do, however, closely follow the experimental results on the basis of a simple model for odor-receptor binding and for the neural network including synaptic coupling. An odor will cause neural activities in individual LNs and PNs in the antennal lobe of the locust (Fig. 1), which is the functional analogue to the vertebrate olfactory bulb. There are D300 LNs and D830 PNs in the antennal lobe of the locust where about 10% of the neurons are activated during an odor stimulus.2,3 When the insect ““ smells ÏÏ an odor, a sequence of events occurs. First, odor molecules bind to speciÐc receptor molecules as an odorÈair mixture sweeps over the insect antenna. The olfactory receptor newons (ORNs) create a total synaptic nerve current I (Fig. 2) which shows no oscillations AN but a single maximum.7 The excitatory antennal nerve current is transmitted into the excitatory PNs and the inhibitory LNs9 which are synaptically connected in their glomeruli (D1000).10 As a result, an ensemble of PNs Ðres coherently, as evidenced by the observation of a local Ðeld potential (LFP) downstream in the mushroom body. The measured LFP shows sine-type oscillations of low amplitude (D0.2 mV) in contrast to the sharp high-amplitude action potentials which are displayed by the individual PNs. The LFP is known to be 4060
the averaged sum over many PNs which display slight di†erences in their individual starting times and in their individual frequencies. Experiments show5 that the LNs are nonspiking in the locust, they are subthreshold and relatively wide and low in amplitude (D2È5 mV). A LN is a cell with a dendritic tree but without an axon. Furthermore, the simultaneously recorded LN oscillations are similar in appearance to the LFP, and the LN potentials appear to be slightly delayed with respect to the
Fig. 1 Schematic diagram of the insect antenna with ORNs ; antennal lobe with excitatory PNs and LNs which are synaptically interconnected by excitatory (exc.) and inhibitory (inh.) synapses ; LFP is recorded extracellularly in the mushroom body.
Phys. Chem. Chem. Phys., 2001, 3, 4060È4071 This journal is ( The Owner Societies 2001
DOI : 10.1039/b103340a
Fig. 2 Neural recurrent network consisting of one LN and 80 PNs ; each of the 80 PNs has 4 nearest neighbors (on a torus) ; PN ] PN and PN ] LN connections are excitatory, whereas LN ] PN coupling is inhibitory ; when odor molecules bind to the receptors, the ORNs (olfactory receptor neurons) generate the I (antennal nerve current) which is transmitted to the LN and to eachAN of the 80 PNs.
LFP.8 The great similarity between the LN and LFP potentials leads us to assume that the PNs are self-oscillating and they inject their individual excitatory synaptic currents into the inhibitory LNs which are not self-oscillatory. Interestingly, coherence in the PNs is lost and the LFP and LN potentials disappear when inhibition is turned o†, i.e. when an antagonist of GABAa (c-amino butyric acid a) receptors, picrotoxin, is infused.5 Picrotoxin is known to speciÐcally block the inhibitory synapses which connect a local neuron with the projection neurons whereas the signatures of the individual PNs remain largely unchanged except for a somewhat increased Ðring rate. To our knowledge, a quantitative treatment of open odor binding to receptors and its interaction with the antennal lobe neurons has been lacking. On physical chemical grounds, odor molecules will preferentially bind to receptors to which they have the highest binding affinity although there will also be some binding to receptors of lower binding constants if the odor concentration is sufficiently high. In equimolar mixtures of two similar odors A and B the binding curve will therefore be more strongly characterized by the odor with the higher binding affinity. It is most likely that di†erent types of the genetically determined receptors will be connected to di†erent PNs and LNs in spatially segregated glomeruli. In odor mixtures complexities arise when the di†erent PN ensembles overlap. This case has been discussed11 qualitatively on the basis of the spatial and temporal aspects of the neural responses. Short-term memory Simultaneous intracellular recordings of the local Ðeld potential and from a LN and single PNs have been obtained8 (Fig. 3) by delivering a series of identical odor pulses lasting 600 ms at 10 s intervals as 600 ms/10 s/600 ms/10 s/É É É etc. Ten successive odor pulses led to responses that became progressively simpler by strongly decreasing in intensity (in the number of spikes) between trials 1 and 2 and less so over trials 3 to 5, after which they remained practically constant between trials 6 and 10. Simultaneously, the inter-PN coherence increased.
This general behavior was independent of the interstimulus interval (2.5È20 s) and of odor-pulse duration (0.25È2.0 s).8 In order to simulate the short-term memory in successive odor trials, we postulate a simple odorÈreceptor binding model which assumes that the odorÈreceptor complex exists in at least two conformational states, active and passive. We also assume that the synaptic antennal nerve current is proportional to the number of active odorÈreceptor complexes. This assumption is supported by measurements of the antennal nerve activity.7 Individual responses to di†erent odors were very similar in their rise time constants but not in their decay time constants when all measured nerve currents were normalized to the same peak amplitude.7 This partially reÑects di†erences in binding strengths between odor molecules and receptors. We attribute the short-term memory e†ect to two processes, Ðrst, to the ““ open ÏÏ binding process of odor molecules to their receptors which leads to adaptation, i.e. to the simpliÐcation of successive signatures and, second, to a successive increase in the synaptic strength of inhibitory LNÈPN synapses and all other synapses which generates an increased coherence among the PN action potentials in each successive pu†. The increased synaptic strength attained after the 10th trial was still sufficiently strong after a 30 s resting period to produce a coherent oscillatory response in a part of the locust antenna which had been blocked during the preceeding 10 trials.8 However, when a resting period of 12È16 min was allowed after the last odor presentation, the in vivo system had completely lost its short-term memory and its coherence and the same procedure could be repeated with similar results.8 We conclude that all receptors have been reset to their original states in the absence of any odor stimulation. In addition, the increase in synaptic strength has decayed after 12È16 min to its original low (non-zero) value. Odor/receptor binding to two receptor states For the interaction of odor molecules A with the olfactory receptor neurons we propose a simple phenomenological twostep binding model which is an extension of a simple law of mass action binding process. The extension from a one-state to a two-state receptor model is required by experiment in order to explain part of the short-term memory e†ects. Here the bound active receptor complex R is transformed by a 1 conformational transition into an inactive receptor state R . 2 This transformation corresponds to a slow structural change of the receptor molecule leading, in e†ect, to an adaptation process of the whole system. Thus R acts as a ““ kinetic sink ÏÏ 2 e†ectively reducing the availability of free receptor sites in successive odor stimulations. k1 k3 (1a) A ] R AB R AB R 1 2 0 k4 k2 There are three rate equations for the open two-step binding model : dA \ [k (A)(R ) ] k (R ) ] k (A [ A) 1 0 2 1 f 0 dt
(1b)
dR 1 \ k (A)(R ) [ k (R ) [ k (R ) ] k (R ) 1 0 2 1 3 1 4 2 dt
(1c)
and dR 2 \ k (R ) [ k (R ) 3 1 4 2 dt
(1d)
where R \ R ] R ] R . Mass conservation of all A total 0 1 2 species cannot be formulated simply, since the binding process is ““ open ÏÏ, i.e. the substrate molecules are supplied from the outside by a constant inÑow of A during a pulse where A is 0 0 the gaseous inÑow concentration. At the same time, A Ñows out of the contact volume of the receptors with rate k A where f Phys. Chem. Chem. Phys., 2001, 3, 4060È4071
4061
choline binding to its receptors coworkers12h14 in T orpedo californica.
by
Neumann
and
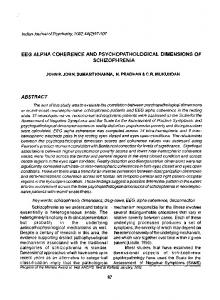
A simple neural net Fig. 3 Experiments by Stopfer and Laurent.8 Simultaneous recording of the LFP in the mushroom body and intracellular recordings from a LN and PN in the antennal lobe. A short-term memory e†ect shows simpliÐed and more synchronized potentials in trials 2, 9 and 10. Trials 1 and 2 and late trials 9 and 10 are shown out of a sequence of 10 successive odor stimulations (pulse duration 600 ms, pulse interval 10 s). With kind permission of the authors. M. Stopfer and G. Laurent, Nature, 1999, 402, 644.
A is the free concentration in the contact volume. The inverse of k represents an average residence time of odor molecules in f a contact volume in the vicinity of the antenna, i.e. 1/k is of f the order of a few hundred ms for normal Ñow velocities of the odor pulse (300 ml min~1).8 For numerical calculations see Results (Fig. 4). Importantly, our model makes the assumption that the temporal behavior of the antennal nerve current I is proAN portional to the active state concentration R , i.e. I \ cR , 1 AN 1 where c is a proportionality constant which is di†erent for PNs and LNs. The receptor state R is inactive in a qualit2 atively similar way to the dimeric state observed for acetyl-
We propose a neural network (Fig. 2) similar in architecture to a recurrent network15 of LNs and PNs. However, there is an important di†erence here : the present inhibitory local neurons (LNs) of the locust are not self-oscillatory but steady state neurons, whereas only the PNs are self-oscillatory. Thus the excitatory PNs oscillate autonomously when activated above a threshold current ; the PNs are the ““ pacemakers ÏÏ. We deÐne a neural unit to consist of one LN and 80 PNs (Fig. 2) which are activated by a large number (D50 000) of olfactory receptor neurons. The number of PNs in a neural ensemble cannot be too small. It has been assumed that about 80 PNs and 30 LNs (i.e. about 10% of all PNs and LNs)2,3 take part in the characterization of a single odor. To simplify our calculations we employ a single LN as being representative of many LNs whose driven oscillations are practically identical for the same odor. The LN of the neural ensemble receives excitatory synaptic inputs from each of the 80 PNs and, in return, the LN inhibits each individual PN to which it is synaptically connected. Our neural ensemble considers synaptic connections between LN ] PN, PN ] LN and PN ] PN. We use the phenomenological model of Hodgkin and Huxley (HH)16 for a neuron which has been investigated by many authors (for reviews see e.g. Arbib17 and Koch18). It has been
Fig. 4 (a) Two-state binding model (eqn. (1)) of odor molecules to receptors generates the active R state in 10 repeated odor trials of 0.6 s length and 10 s intervals. R reaches the highest peak in the Ðrst trial (numbers refer to trials), adaptation1 and short-term memory is created. (b) Trial 1 shows the time series1of A, R , R and R in the Ðrst pulse (0È600 ms). (c) Trial 10 generates a lower R curve whereas R is larger than in trial 1. 0 1 2 1 2
4062
Phys. Chem. Chem. Phys., 2001, 3, 4060È4071
sucessfully applied to the ion currents in the stomatogastric ganglion of crustaceans,19 for example. The synaptic currents are calculated in a standard way.20,21 During odor stimulation the synaptic antennal nerve current I provides an excitatory input to the LN as well as AN to each PN, where the LN proportionally receives a lower I AN current than a single PN. Injecting I will cause an isolated AN PN to Ðre (Fig. 5(a) and (b)) while the LN always remains in a non-spiking steady state with an elevated membrane potential (Fig. 5(c)). In e†ect, the major input current into the network LN stems from the sum of all excitatory synaptic PN currents and not only from I . Thus a non-spiking LN displays AN driven oscillations, namely those of the ““ driving ÏÏ PNs whose averaged sum corresponds to the LFP. Although the LFP is measured downstream in the mushroom body, it is similar in appearance to the experimental LN (Fig. 3) as measured in the antennal lobe. Furthermore, the LFP leads the LN signature by a small phase shift. The smoothness of the measured LFP potential indicates that each of the 80 PNs starts to Ðre at a slightly di†erent starting time. In the model LFP calculations, smoothness is readily achieved by applying a Gaussian distribution to the starting times of each of the Ðring 80 PNs. In addition, the frequencies of each of the 80 PNs are made slightly di†erent by also applying a Gaussian distribution to the Ðring rate parameter / (Table 1). n The spatial arrangement of the PN positions is not known. In general, all 80 PNs may be interconnected by 2, 4, 6 or more nearest PN neighbors per PN. Two nearest neighbors form a linear or circular chain, 4 nearest neighbors may lead to a Ðnite or closed (torus) surface and 6 nearest neighbors may describe a three-dimensional structure of PNs. It turns out that 4 or more nearest PN-neighbors lead to similar qualitative results in the dynamic simulations. For simplicity we consider only 4 nearest PN neighbors for each PN (Fig. 2). The local neuron A LN consists of a single dendritic tree without an axon.5 We use the single-compartment HH16 main equation C m
dV LN \ [ ILN [ ILN [ ILN ] ILN [ IPN?LN Na K L AN syn dt
(2a)
where V LN is the membrane potential of a LN, C is the memm brane capacitance (Table 1), ILN is the antennal nerve synaptic AN current originating from the sum of all ORN potentials (during the binding of odor molecules to their receptors) according to the principle of temporal summation of action
potentials.20 The IPNvLN are the individual excitatory synaptic syn currents from each of the 80 PNs injecting into the LN (Fig. 2). The voltage dependent Na current (ILN), the K current (ILN) Na K and the leak current (ILN) are expressed conventionally21 L according to HH : \ g m3h(V [ E ), I \ g n4(V [ E ), Na Na Na K K K I \ g (V [ E) L L where the individual conductances g and the reversal potentials E are given in Table 1. There are four di†erential equations, one for V LN (eqn. (2a)) and three for the HH variables m (eqn. (2b)), n (eqn. (2c)) and h (eqn. (2d)) : I
dm \ a (1 [ m) [ b m m m dt
(2b)
dh \ U (a (1 [ h) [ b h) h h h dt
(2c)
dn \ U (a (1 [ n) [ b n) n n n dt
(2d)
where the voltage dependent rate constants a and b are identical with those of Chow and White,21 a \ 0.1(V ] 40)/(1 [ exp([(V ] 40)/10)) m b \ 4.0 exp([(V ] 65)/18) m a \ 0.07 exp([(V ] 65)/20) h b \ 1/(1 ] exp([(V ] 35)/10)) h a \ 0.01(V ] 55)/(1 [ exp([(V ] 55)/10)) n b \ 0.125 exp([(V ] 65)/80) n The present choice of the rate parameter / and / (Table 1) n h together with relatively low values of the ion channel conductances ensures that a LN is always in a non-spiking steady state whose (asymptotic) value rises somewhat with increasing injected current as shown in the calculated bifurcation diagram (Fig. 5(c)). As a result of the above coupling interactions, the forced LN potentials are ““ smooth ÏÏ (as are the LFP) and of low amplitude. The steady state of the LN is modulated by the PN synaptic currents which have become coherent mainly due to the e†ect of LN ] PN inhibition. In the absence of a mushroom body in our simpliÐed model we regard our LFP as the mean value of the 80 PN membrane potentials.
Fig. 5 (a) Bifurcation diagram of an isolated HodgkinÈHuxley PN according to eqn. (3) (I \ 0) with parameter values21 in Table 1. Maxima syn : a steady state SS , an oscillatory state between and minima of the membrane potential vs. injection current. Three dynamic states are obtained 1 HB (subcritical Hopf bifurcation) and HB (supercritical Hopf bifurcation) and a steady state SS . Oscillation amplitudes decrease with increas2 ing 1injecting current. When I enters the oscillatory region, PN oscillations (spikes) are obtained.2 (b) Frequency dependence of a PN of part (a). AN The asymptotic frequency ranges from D14.7 to D113.6 Hz. The in vivo frequency (D24 Hz) corresponds to a current of D17.5 lA cm~2. (c) Bifurcation diagram of an isolated (I \ 0) LN which consists of only a single focal steady state and no self-oscillatory state. The LN membrane syn than at high currents. potential increases more rapidly at low
Phys. Chem. Chem. Phys., 2001, 3, 4060È4071
4063
Table 1 PN
LN
Na conductance, g K conductance, g Na K Leak conductance, g Rate parameter, / L h Rate parameter, / n
90.0 mS cm~2 24.0 mS cm~2 0.2 mS cm~2 1.0 Gaussian distributed (mean \ 0.12 ; standard deviation \ 0.02)
34.0 mS cm~2 9.0 mS cm~2 0.75 mS cm~2 4.0 4.0
Membrane capacitance, C \ 1.0 lF cm~2 m E \ [90 mV Potassium reversal potential, K
Sodium reversal potential, E \ 60 mV Leakage reversal potential, ENa \ [70 mV L
The projection neuron Similarly to eqn. (2a) a PN is regarded as a HH neuron with C
dV PN \ [IPN [ IPN [ IPN ] IPN [ ILN?PN [ IPN?PN (3) m dt Na K L AN syn syn
where the membrane capacitance C is identical with that in m eqn. (2a). The values of the individual currents IPN, IPN and IPN Na K L
have the same form as those of the above LN ; the respective conductances and reversal potentials for a PN are listed in Table 1. The three di†erential equations for m, n and h as well as the respective as and bs are identical with those of a LN as given in eqn. (2b), (2c) and (2d), respectively. However, the rate parameters / and / (as well as the conductances) are di†erh n ent for a LN and a PN (Table 1). The calculated bifurcation diagram for a PN consists of an oscillatory region Ñanked by two focal steady states (see Results, Fig. 5(a) and (b)).
Fig. 6 Properties of an excitatory synapse23 between a pair of PNs, for g \ 0.02 mS cm~2. (a) Antennal current pulse I as injected (10 ms) into a single PN, (b) presynaptic input V generated by I , (c) fraction of syn the postsynaptic transmitterÈreceptor complexes AN F(V PNj) (eqn. 6(a)), (d) pre AN pre gating variable s as the fraction of open synaptic ion channels, (e) negative post synaptic current I (eqn. (4)) for an excitatory synapse, (f ) EPSP syn (excitatory postsynaptic potential V ). post
4064
Phys. Chem. Chem. Phys., 2001, 3, 4060È4071
Fig. 7 Incremental increase in g (eqn. (7)) to achieve an increase of coherence in 10 successive odor pulses. The initial values of g and the syn syn1 increments *g were : For LN ] PN coupling g \ 0.1 mS cm~2 and *g \ 0.12 mS cm~2, for PN ] PN coupling g \ 0.02 mS cm~2 syn syn1 syn syn1 and *g \ 0.01 mS cm~2 and for PN ] LN g \ 0.03 mS cm~2 and *g \ 0.015 mS cm~2. After about 10 trials the g values have syn syn1 syn syn reached saturation. In the absence of any odor all *g will decay to zero within about 12È16 min. syn
0.5, since the amplitude of a LN is much smaller than that of a PN :
Synaptic coupling The task of an excitatory or inhibitory synapse is to transform a presynaptic potential arriving from an axon of a previous neuron into a postsynaptic current which is injected into the next neuron (Fig. 6). The synaptic strength is proportional to the amount of transmitter released across the synaptic cleft. The following couplings are operative in our neural net : (a) PN to PN coupling is excitatory, where subscripts i and j i j (Di) label the 80 PNs. For each of the 80 PNs the current of a single synapse is given as22,23 IPNj?PNi \ g s(V PNi [ E ). syn post syn syn
(4)
Here g is the maximal synaptic conductance whose numerisyn cal values are given in Fig. 7 (see also eqn. (7)) for three di†erent types of synapses. E is the synaptic reversal potential syn which, for excitatory synapses, is set to 0 mV.23 The fraction of open synaptic ion channels is described by the gating variable s which obeys a Ðrst-order type kinetic expression : ds \ aF(V PNj)(1 [ s) [ bs. pre dt
(5)
For example, for PN ] LN coupling, V is V PN and V is pre post V LN. Conversely, for LN ] PN coupling, V is V LN and V pre post refers to V PN. In addition, if synaptic PN ] PN coupling is i j considered, V becomes V PN of the ith PN and V is equal pre post to V PN of the jth PN in the network of 80 PNs. Furthermore, i cannot be equal to j since direct feedback is excluded here. Thus a and b are the channel opening and closing rate constants, respectively, where, for an excitatory synapse, we set a \ 1.2 ms~1 and b \ 0.05 ms~1, corresponding to a synaptic relaxation time of 20 ms ; F(V PNj) is proportional to the fraction of the post-synaptic transmitterÈreceptor complexes ; it is a sigmoid function of the presynaptic membrane potential V pre F(V PNj) \ 1/(1 ] exp([(V PNj [ h )/2)), pre syn pre
(6a)
where h is the value of the potential at the midpoint of the syn transition between closed and open channels due to the release of the transmitter. For an excitatory synaptic connection h \ 0.23 syn (b) PN to LN coupling is excitatory. For PN ] LN coupling we apply similar equations and parameters as for PN ] PN coupling (part a), except for different (larger) values of g (see Fig. 7). syn (c) LN to PN coupling is inhibitory. The expressions (eqn. (4)È(6)) can also be used for inhibitory coupling in a slightly modiÐed way where F(V LN) rises more pre steeply than in the excitatory case, as expressed by the factor
F(V LN) \ 1/(1 ] exp([(V LN [ h )/0.5)) (6b) pre syn For the inhibitory GABAa synapses23 we set E \ [75 mV. syn Furthermore, h \ [52 mV, a \ 1.0 ms~1 and b \ 0.01 syn ms~1. Thus the inhibitory synapses between the LN and PNs are assumed to display a longer decay time than that of the excitatory case, namely 100 ms (b~1). The ““ learning ÏÏ procedure Hebbian learning refers to the strengthening or weakening of synaptic connections I between two neurons depending on syn the timing between presynaptic and postsynaptic action potentials. Generally, the synaptic weight g is increased syn (decreased) if presynaptic Ðring precedes (follows) a post synaptic action potential. The learning rule applies only within a temporal ““ learning window ÏÏ.24,25 The ““ learning window ÏÏ may be applied to PNÈPN coupling where the action potentials are ““ sharp ÏÏ and their arrival times are well deÐned. On the other hand, the LN potentials are ““ broad ÏÏ each lasting for D50 ms ; therefore, any arrival time is ill-deÐned here. Furthermore, in our model, the inclusion of mutual synaptic coupling between all 80 PNs would present a staggering numerical task. For these reasons, instead of using the learning window we apply our simpler learning method (eqn. (7)) for PN ] LN as well as LN ] PN and PN ] PN coupling. In this simpliÐed learning procedure we augment the synaptic strength g for each following odor pulse (k ] 1) by syn(k`1) (decreasing) increments *g according to syn g \g ] *g (k \ 1È9) (7) syn(k`1) syn k syn The increment *g is assumed to be roughly independent of syn the duration of the odor presentation and dependent only on the number of pulses where the time interval between pulses is 10 s in this case (Fig. 7).
2. Results and discussion We Ðrst present the simulations of odor binding to the receptors and subsequently its interaction with the neural network. Rate constants for the binding of odor molecules to the receptors Simulations have been carried out for physiologically reasonable values of A and R , namely A \ 1 ] 10~5 mol l~1 0 total 0 Phys. Chem. Chem. Phys., 2001, 3, 4060È4071
4065
time series of A, R , R and R for the open binding process. 0 1 2 R shows a relatively broad maximum (from D0.2 to D0.6 s). 1 At the end of the Ðrst odor pu† R has declined to D50% 0 while R and R have been populated. For example, R rises 1 2 2 from zero to about 40% of R (at 600 ms) (where R \ R total total 0 ] R ] R ). When the odor stimulation is turned o† (at 600 1 2 ms), R declines due to the slow conformational transform2 ation back to R . Then R dissociates into R and free A. The 1 1 0 rapid outÑow of A (with air as the carrier) out of the contact volume around the receptors removes A from the binding process. Before R would have passed through its minimum 0 during a following odor free period, the subsequent A stimu0 lus has already started the next (second) presentation (trial). Tenth trial
Fig. 8 (a) A LN inhibits a PN : An injection pulse of a direct current (600 pA between arrows) injected into a LN inhibits Ðring of PN (held depolarized by 300 pA constant current to generate PN Ðring in the absence of any odor) ; the LN does not oscillate intrinsically when depolarized, PN spikes are clipped. K. MacLeod and G. Laurent, Science, 1996, 274, 976. (b) Simulation of part (a) : HH-model LNÈPN pair with g (LN ] PN) \ 0.35 mS cm~2 and g (PN ] LN) \ 0.02 syn oscillations in the mS cm~2 : syn a constant current (20 lA cm~2) causes PN (Fig. 4(a) and (b)) ; injection of 40 lA cm~2 into the nonoscillatory LN inhibits the PN (from 700 to 1400 ms).
and R \ 1 ] 10~6 mol l~1. All rate constants for binding total are, of necessity, approximations ; exact values must be determined independently. For the on-rate binding step k (eqn. (1)) 1 we use an almost di†usion controlled value (3 ] 107 l mol~1 s~1). The o†-rate constant k (1.5 ] 103 s~1) is chosen such 2 that the binding constant K ( \ k /k ) is of the order of at 1 1 2 least 104 l mol~1. The slow conformational change R ¢ R 1 2 (eqn. (1)) may be described by the rate constants k (7.5 s~1) 3 and k (3.0 ] 10~2 s~1) where K ( \ k /k ) is 2.5 ] 102. Thus 4 2 3 4 the overall binding constant is moderately large (5 ] 106) in the case of the binding of food odors. The choice of k is sensi4 tive : if the k values are too large ([10~1 s~1), successive R 4 1 maxima (in repeated 0.6 s trials with 10 s intervals) will be constant instead of showing decreasing values ; whereas for k 4 values which are chosen too low, the system will reside in the R state for long times with hardly any populated R and R 2 0 1 states. In order to guarantee the openness of the binding process we use a moderate Ñow rate (k \ 5.0 s~1) correspondf ing to an average residence time of 200 ms for the odor molecules. We assume that the distribution of the odor molecules is close to homogeneous across the narrow odor plume in the experimental set-up. Successive trials in odor binding Using the above rate constants, numerical simulations of 10 repeated odor stimuli were calculated (Fig. 4(a)) where each of the 10 pulses lasted 600 ms with odor-free intervals of 10 s duration. During the Ðrst odor stimulation, R reaches the 1 highest peak (Fig. 4(a)) while in the following pulses the R 1 peaks are successively lower until they reach a constant peak amplitude from about the Ðfth to the last (tenth) trial. First trial Numerical calculations of the Ðrst trial are shown in detail (Fig. 4(b)) for the above set of rate constants leading to the 4066
Phys. Chem. Chem. Phys., 2001, 3, 4060È4071
The main di†erence between trial 10 and the Ðrst trial concerns the maximum in R which is much lower than that of 1 the Ðrst trial. This situation will lead to the simpliÐcation of the PN and LN responses, because it generates lower values of the antennal nerve current which will sweep less ““ deeply ÏÏ into the bifurcation diagram and will therefore lead to lower oscillation frequencies (Fig. 5(b)). Second, the starting value of R is lower (Done half ) than in the Ðrst trial. Third, the 0 system Ðnds itself mostly in the R state in all trials after the 2 Ðrst. Therefore, the ““ memory ÏÏ (diminishing R peaks in suc1 cessive trials) is due to an adaptation in which increasing populations of inactive R states are formed in the later trials 2 leading to an e†ective lowering of the starting R population. 0 Thus the rate of formation of R ( \ k (R )(A)) declines from a 1 1 0 high value in the Ðrst trial to lower values in the following trials. The concentration proÐle of free A is practically identical in each successive trial (Fig. 4(b) and (c)), since A is 0 present in (tenfold) excess. Due to the low rate constant k 4 from R to R , the system returns only slowly to its initial 2 1 condition (R \ R , R \ R \ 0 at t \ 0) after the last total 0 1 2 trial. When R has declined to zero (in more than D160 s), the 2 system has, in e†ect, been reset and is ready to undergo a new series of successive pu†s with similar results as in the naive animal. Bifurcation diagram for a PN In order to characterize the dynamic states of a HH neuron, we Ðnd it most instructive to calculate its bifurcation diagram as the plot of the membrane potential V vs. an injecting current, in analogy to common practice in nonlinear dynamics in chemistry.1 The bifurcation diagram26,27 of an isolated (I \ 0) PN syn (Fig. 5(a)) (eqn. (3), Table 1) shows three dynamic states : a steady state SS , an oscillatory (Ðring) state, and another focal 1 steady state SS depending on the value of the injecting 2 current. There is a subcritical Hopf bifurcation (HB ) (at D9.0 1 lA cm~2), whose width is very narrow and unresolvable. HB 1 represents a threshold, where a ““ hard generation ÏÏ of oscillations occurs. A region of sustained oscillations follows whose amplitudes decrease and frequencies increase (Fig. 5(b)) as the injecting current increases. There is a strong frequency dependence (ranging from D14.7 to D113.6 Hz at the low (HB ) to the high (HB ) Hopf points, respectively (Fig. 5(b))). 1 2 The observed in vivo frequency (D24 Hz)8 is encountered at 17.5 lA cm~2 in the model. A supercritical Hopf bifurcation (HB ) is reached at which the oscillations give way to another 2 steady state (at D222 lA cm~2). However, the prevailing injection currents I for odor binding are probably not high AN enough to reach the ““ upper ÏÏ steady state, in this particular PN neuron. Formally speaking, the HH-neuron is polarized (excitable) when it resides in a steady state SS . When an action potential 1
Fig. 9 An example of our numerical network simulations, where trials 1 and 2 and late trials 9 and 10 are shown out of a sequence of 10 successive odor stimuli (pulse duration 600 ms, pulse interval 10 s). The starting time of each I pulse is delayed by an average time of 25 ms AN with a variance of 15 ms : Trial 1 : An arbitrarily chosen PN (out of 80 PNs) shows oscillatory response (11 spikes). Due to the absence of coherence in the inter-PN response the LFP is irregular and consequently the LN is irregular (noisy) as well. The ensemble of 80 PNs shows the absence of coherence. Trial 2 : The PN signature has simpliÐed (9 spikes), the LFP and the LN show sine-like oscillations as a consequence of an increased inhibitory synaptic strength from LN to each of the 80 PNs ; some coherence is seen in the 80 PN-ensembles. Trial 9 : The PN signature has further simpliÐed (6 spikes), the LFP and LN show clearer (larger amplitude) oscillations and the 80 PN-ensemble shows an increased coherence. Trial 10 : The PN signature shows more peaks (8) here than trial 9 due to statistical reasons caused by the Gaussian distribution of PN starting times and frequencies. This deviation is within the statistical error of the simulations as in the experiments.8 The LFP and LN show oscillations of substantial magnitude and the 80 PN-ensemble displays a strong coherence.
starts, the neuron becomes depolarized ; and it is hyperpolarized, when the membrane potential becomes more negative than the resting potential in SS . 1
above [73 mV for a PN. Note that the sign of I in eqn. (2) syn and (3) is negative. Thus, for an excitatory synapse, the postsynaptic neuron receives a higher (positive) current (Fig. 5(a)). On the other hand, the postsynaptic neuron receives a lower (negative) current when the synapse is inhibitory.
““ Bifurcation ÏÏ diagram for a non-oscillating LN We assume that the conductivities for the Na` and K` channels are lower in the LN (which lacks an axon) than those in the PN whereas the leak current is larger (Table 1). Mainly on account of a higher value of the rate parameters / \ / ( \ n h 4.0) the bifurcation diagram of an isolated LN shows only a single focal steady state and no oscillatory state. Thus the LN is non-spiking here as required by experiment (Fig. 8(a)). Fig. 5(c) shows that the membrane potential of the steady state increases more rapidly at low currents than at high currents. Excitatory and inhibitory synapses Eqn. (4) to (6) describe the dynamic properties of an excitatory synapse23 between a pair of PNs as shown in Fig. 6. First, a current pulse (10 ms) (Fig. 6(a)) which is injected into a presynaptic PN generates the presynaptic input V (Fig. 6(b)). pre F(V ) acts like a switch between zero and one (Fig. 6(c)) as pre V crosses the threshold h . Since V is a steep function of pre syn pre time, the temporal rise of F(V ) is also steep. As F(V ) pre pre reaches unity, the gating variable s rises steeply (eqn. (5)) with a sharp maximum (Fig. 6(d)). As V returns to the initial pre (polarized) state, F(V ) drops to zero (Fig. 6(c), eqn. (6)). Then pre s declines with the synaptic channel closing-rate b to reach zero (after D150 ms) for the excitatory synapse (Fig. 6(d)). I syn is generated according to eqn. (4) (Fig. 6(e)). V is established post when I is injected into a postsynaptic PN. For an excitatory syn synapse the absolute value of I is negative, since (V syn post [ E ) is always negative for E \ 0, i.e. when the postsyn syn synaptic neuron is at rest. However, I is positive (not shown) for an inhibitory syn synapse, since E \ [75 mV.23 The reason is that the di†ersyn ence (V [ E ) is always positive, because V is typically post syn post
How are signatures of action potentials generated ? Action potentials are always generated in a PN when the injecting current Ðnds itself in the oscillatory range (Fig. 5(a)) in the bifurcation diagram. In our present neural net (Fig. 2) the injecting current into a PN is the sum of several contributions (I [ ILNhPN [ IPNhPN) (eqn. (3)). Starting at t \ 0 the AN syn syn PN resides in its steady state (D [73 mV) at zero injecting current where it is quiescent. As gaseous odor molecules A 0 Ñow over the antenna (in a pulse with air as a carrier), the open binding process produces active R states which are 1 assumed to generate the synaptic antennal nerve current. I AN is directly proportional to R . As I continues to increase, 1 AN the PN starts to Ðre with decreasing amplitudes and increasing frequencies after the total injecting current has entered into the oscillatory region. After I has reached its temporal AN maximum inside the oscillating region (Fig. 5(a)), it returns slowly towards HB and below. During this sweep back to 1 lower currents the PN amplitude increases and the frequencies decrease again (Fig. 5(b)). Once I is below HB the PN will AN 1 have arrived at its initial excitable steady state SS . Thus PN 1 signatures are generated when the antennal current sweeps across the bifurcation diagram at HB to the right and back 1 again. This course of events repeats during each successive pu† with the important di†erence that I ““ penetrates ÏÏ into AN the oscillatory region to a lesser extent in each successive trial due to the adaptation (memory) e†ect. Thus, in successive pulses, the PN signature changes, in fact, it simpliÐes, since successive PN frequencies will be lower at lower maximal injecting currents I . Since the injecting current changes AN (rapidly) with time, one observes transient amplitudes and frequencies. The reproducibilty of transient signatures is not always optimal particularly when there is noise and variations Phys. Chem. Chem. Phys., 2001, 3, 4060È4071
4067
in the odor stimuli as in an in vivo system. In a simple law of mass action mechanism the maximum of I would always be AN the same in each successive pu† and the PN signatures would be identical ; consequently, any short-term memory would be totally absent. The generation of signatures would also be possible if the upper steady state SS is chosen as the initial state. Starting a 2 (decreasing) current sweep from SS (above 222 lA cm~2), 2 spikes of low amplitudes and high frequencies would be produced when the current crosses HB . Experimental data 2 require that it is the lower steady state (and not the upper) that is chosen as the polarized state. The choice of the upper steady state (at high current) as the initial polarized initial state would produce a depression in the baseline of the LN potentials which is not observed experimentally. The LN is non-oscillatory MacLeod and Laurent5 have shown experimentally in the locust that the LN does not oscillate intrinsically upon depolarization (Fig. 8(a)). In addition, direct current injection into the LN inhibits the oscillations of the PN which has been held depolarized by a constant injection current. Our model calculations for a single LNÈPN pair reproduced these experiments rather well : a constant current (20 lA cm~2) causes the Ðring of the PN (D27 Hz) (Fig. 5(a)) ; the injection of 40 lA cm~2 in the LN (from 700 to 1400 ms) inhibits the PN (for gLNhPN \ syn 0.35 mS cm~2). Note that one excitatory coupling event alone (gPNhLN \ 0.02 mS cm~2)Èas in the present calculationÈ syn leads to only a small ripple in the LN potential and not to any inhibition of the PN between 0 and 700 ms and 1400 to 2100 ms (Fig. 8(b)). On the other hand, in the neural unit (Fig. 2), many PNs will cause a large forced oscillation in the LN (Fig. 9) which, in turn, generates a strong synaptic inhibition signal in the PNs.
coherently, as seen in the diagram for all 80 PNs. In addition, the LFP and the LN are non-oscillatory and irregular (noisy) in agreement with experiment. After the Ðrst trial, however, coherence in the PN ensembles, the LFP and the LN is generated in trial 2 and it increases toward high values in trials 7È10 as in the experiment (intermediate trials 3È8 are not shown). Here some inhibitory postsynaptic potentials are also observed in the PNs in all trials except trial 1. Furthermore, the number of PN spikes decreases and their frequency decreases from trial 1 to 9. Trial 10 shows a somewhat elevated number of spikes due to statistical variation introduced by the Gaussian distributions of starting times and frequencies. There is a Ðnite average deviation also observed in the experiments.8 Importantly, the LN and LFP start to oscillate with improving oscillatory (closely sinusoidal) waves in trials 2 to 10 in agreement with experiment. Our model also explains the strong coherence measured after 30 s in the trial 11@, which had been observed in a ““ naive ÏÏ part of the antenna8 (Fig. 10(a)). The latter had been blocked during the previous 10 odor trials and was unblocked after the 10th trial. Therefore, R is about as high in trial 11@ 1 as in trial 1 with PN frequencies that are about equal. Experiments show that the system will be reset during a 12È16 min resting period in the absence of any odor8 which indicates that a decay of all augmented synaptic strengths to their initial values (t \ 0) in trial 1 (Fig. 7) has taken place. However, the synaptic strength in trial 11@ is still sufficiently high, since only 30 s have elapsed after the last (10th) trial. Therefore, trial 11@ shows a strong coherence. In general, intermittent and short pulses are more e†ective than infrequent and long stimuli when applying our simple learning method. Coherence of PNs Inhibitory coupling (ILNhPN) causes the 80 PNs to Ðre cohersyn ently creating a small phase shift (D2È6 ms) between the LFP and the forced LN oscillations. We do not Ðnd as large a
Successive trials and short-term memory Following the experiments,8 10 successive pulses of antennal nerve currents I ( \ cR ) (Fig. 4(a)) were injected as input AN 1 into the neural network of Fig. 2 (eqn. (2) to (6)), in order to simulate the time series of our neural ensemble consisting of one LN and 80 PNs. To achieve an increase in the coherence of the PNs in successive trials, the synaptic strengths g had syn to be increased in increments of *g in each successive trial syn (eqn. (7)), where di†erent initial g values for LN ] PN, syn PN ] LN and PN ] PN coupling have been used (Fig. 7). The values of the added increments *g were arbitrarily syn halved for each successive trial (Fig. 7). The calculated LFP, LN, PN and the maxima of all 80 PN potentials of trials 1, 2, 9 and 10 are shown in Fig. 9. As an example of a PN time series we have included an arbitrarily chosen PN (out of 80 PNs) (Fig. 9). The starting times of the I for all 80 PNs were Gaussian distributed with AN a mean delay value of 25 ms and a variance of 15 ms. We also imposed a Gaussian distribution on the rate parameter / n (Table 1) which has a mean value 0.12 with a variance of 0.02. The distributions introduce the necessary heterogeneity in order to obtain a ““ broad ÏÏ LFP. Thus in the calculations (as presumably in vivo), the individual PNs will Ðre at slightly different initial times with di†erent frequencies where a given PN, taken alone, will show a slightly di†erent phase shift from another PN. Due to the excitatory synaptic coupling of each of the 80 PNs to the non-oscillating LN, the LN will show a driven oscillation similar in appearance and frequency to the LFP which is the average sum of the distributed action potentials of all 80 PNs. In trial 1 the chosen PN shows an oscillatory response with a high Ðring rate whereas the ensemble of PNs Ðres non4068
Phys. Chem. Chem. Phys., 2001, 3, 4060È4071
Fig. 10 (a) Odor stimulation of non-adapted antennal receptors (in trial 11@) which were blocked during the previous 10 successive odor stimuli. The PN (in this trial 11@) shows the same number of peaks as in the non-adapted trial 1. In contrast, oscillatory synchronization is present as shown in the regular and strong LFP and LN. This indicates that the increased inhibitory synaptic strength originating from the previous 10 trials still exists here after 30 s. (b) Simulations with c \ 1.8 ] 109 for the PN which produces a larger I (factor 10). This AN leads to a high PN frequency (Fig. 4(b)) and abolishes the synchronization of the LFP and consequently the LN, since the latter cannot follow the high frequency driving oscillations of the PNs. Thus LFP and LN synchronization is practically absent in the range 20È50 Hz.
phase shift as shown by McLeod ans Laurent5 (their Fig. 1). From the appearance of all time series coherence is seen to increase in each trial (Fig. 9), as in the experiments (Fig. 3), since the synaptic strength has been augmented in each trial. The base line of the LN time series is more elevated in the calculations than in the experiment as a result of the particular dependence of the LN steady state on the injecting current (Fig. 5(c)) in the model. The injecting current into the LN consists mainly of IPNhLN. The experimental LFPs, as measured in syn the mushroom body, were band-pass Ðltered (5È55 Hz)8 whereas the present calculations refer to the LFP as actually encountered in the antennal lobe. In the calculations the noisy appearance of the (unÐltered) LFPs is due to the Ðnite (80) number of participating PNs in the ensemble. Inhibitory post synaptic potentials (IPSPs) are always produced in the PNs (Fig. 9) when inhibitory synapses are active. Here, the Ðring of a PN is supressed when the IPSP occurs shortly before the PN would normally Ðre. The question arises how the LN, PN and LFP signatures might look if the inhibitory coupling between LN ] PN were removed (as in the experiments with the toxin picrotoxin5,6). In the latter case we also observe a lack of coherence between the PNs and the LFP is Ñat, although the individual shapes of the free-running PNs are still almost the same as before (not shown) in agreement with experiment. An absence of Gaussian distributions in the initial times and frequencies of the PNs would generate a sharp LFP in the calculations which is not observed in the experiments. Our simulations show that coherence in the PNs will disappear at high PN frequencies ([50 Hz) which are generated when the antennal nerve current is large (Fig. 5(a) and (b)). A large I may be obtained by increasing the proportionality AN factor c or by increasing R . We show calculations in which c 1 for the PNs has been arbitrarily increased by a factor of ten (from 1.8 ] 108 to 1.8 ] 109) (Fig. 10(b). All other parameters in this simulation were identical with those of Fig. 10(a) except for the threshold H of the excitatory synapses. H had to syn syn be set to lower values than zero ; i.e. [30 mV, in order to keep the synapses active during the Ðring of the PNs. As a result, a high frequency transient membrane potential of an arbitrarily chosen PN is generated (Fig. 10(b)). In this case, coherence of the 80 PNs cannot be achieved since the dynamically ““ sluggish ÏÏ LN cannot follow the fast PN dynamics at high frequencies. Towards the end of the signature, however, the PNs have regained their lower frequencies due to the lower value of the decaying I , and a weak coherence develops as AN observed in the LN, LFP and the PN ensemble (Fig. 10(b)).
receptor binding. On the other hand, our model may not be quantitatively transferable to the moth, since the LN (in the moth) is known to be oscillatory29 whereas in the locust the LN does not oscillate intrinsically. However, the high frequency dynamics may be similar in the moth and the locust for strong and speciÐc pheromone binding leading to a partial lack of PN coherence at 20È50 Hz. Incidentally, our chosen k f value happens to be identical to that of the Ñow measurements done by Vickers et al.28 in a wind tunnel. Dependence on the odor Ñow For the above set of rate constants and numerical parameters, the value of k inÑuences the shape of the R curve. A low f 1 value of k (1 ] 10~3 s~1) leads to a low rate of inÑux of A f 0 and, concomitantly, to a slow rate of out-Ñow of A. As a consequence, during the (10 s) pauses, A is not depleted as rapidly as it is at higher Ñow rates. Instead, A accumulates in small steps in each successive trial to only D2% of A at the end of 0 the 10th trial in a saw-tooth fashion (for k \ 1 ] 10~3 s~1). f This situation would lead to an unrealistically low concentration of bound R and R states in each odor pulse. Further1 2 more, a low value of k will not be in agreement with the f experiments since the successive R maxima would be identi1 cal. The short-term memory is retained even at very high Ñow rates k . Here R immediately reaches a maximum at the start f 1 of a pulse. R declines slowly until the pulse ends at 600 ms 1 where R abruptly drops to zero due to the high outÑow rate 1 of A. This will lead to a faster initiation of the PN action potentials and their faster disappearance. The best Ðt for k has been achieved for moderate k values f f (5.0 s~1, 1/k B 200 ms) where the time course of the R state f 1 shows a maximum (Fig. 4(b) and (c)). A predictive calculation of I for di†erent odor concentrations AN A 0 We have calculated the PN signatures for the 10 successive trials as a function of odor strength A (from 1.0 ] 10~6 to 0 1.0 ] 10~4 mol~1 l~1 for R \ 1 ] 10~6 mol~1 l~1). The total maxima of R for trials 1, 2 and 10 are plotted (Fig. 11). As a 1 result, there will be a strong simpliÐcation of the signatures from trial 1 to 2 as A increases, whereas the di†erences 0
New high frequency data in the moth Interestingly, the high frequency conditions may have been encountered in a study (which has just appeared) by Vickers et al.28 on pheromone olfaction in the male moth (Heliothis virescens) antennal lobe. In the latter a single PN signature closely resembles the situation of Fig. 10(b)) and a histogram of all PN frequencies shows only scant power in the lower frequency range of the LFP oscillations (20È50 Hz). These Ðndings are in agreement with our model if one assumes that pheromoneÈreceptor binding is very strong generating more R states and therefore a much higher transient antennal 1 nerve current than in the case of moderately binding food odorants. Thus the maximum values of I may have been AN closer to the upper Hopf bifurcation HB of the PN. In fact, 2 some of their PN action potentials (their Fig. 3(a)) resemble closely those in Fig. 10(b)) and therefore they are typical of a HodgkinÈHuxley neuron : the PN amplitude become smaller as the spiking frequency increases (as seen in Fig. 5(a) and (b)). Furthermore, PN action potentials go hand in hand with antennal nerve activation which is a natural consequence of our binding model : there is no activity (I ) without odorÈ AN
Fig. 11 Predictive simulations of R (\c I ) in 10 successive trials AN mol l~1. The maxima at high odor concentrations A up to1 1 ] 10~4 0 of R decrease strongly from trial 1 to trial 2 whereas there are only small1 di†erences between trial 2 and 10 at high A . Thus the major 0 second pulse at simpliÐcation of the LFP occurs between the Ðrst and high A with a concomitant increase in PN frequency (see Fig. 10(b)). 0
Phys. Chem. Chem. Phys., 2001, 3, 4060È4071
4069
between the second and the tenth pu†s become very small at high odor strengths. Thus the Ðrst pulse may produce a complex signature typical of a large odor-stimulus which may even include a time of quiescence when a large I sweeps into AN the steady state SS beyond HB . It is important to note that 2 2 the response signatures depend critically on the absolute value and on the rate of change of the antennal nerve current.
Conclusions A simple neural recurrent net consisting of a LN and 80 PNs seems to be consistent with the in vivo measurements of the olfactory system in the locust. The PNs act as the pacemakers which cause the non-oscillatory LN to respond with driven oscillations of low amplitudes as a consequence of excitatory synaptic coupling from each PN to the LN. In the calculation the magnitudes of the LN amplitudes depend on the value of the excitatory synaptic strength (PN ] LN). The PN starting times and frequencies were distributed by applying Gaussian distributions to both. This causes the local Ðeld potential to become ““ smooth ÏÏ and near-sinusoidal. Inhibitory synaptic coupling from the LN to all 80 PNs introduces coherence in the Ðring of the PNs between 20 and 50 Hz which leads to the generation of a local Ðeld potential. The introduction of PN to PN coupling improves the PN coherence in combination with inhibition and avoids vacancies in the PN signatures, with the result that more PNs Ðre providing a more regular excitatory input into the LNs. The LFP oscillations are slightly advanced in phase over the LN oscillations as expected ; both LFP and LN are very similar in appearance and frequency. The in vivo LFP has been measured in the mushroom body and, in addition, it has been band-pass Ðltered.8 Therefore, we expect the in vivo LFP to agree with the simulated LFP only in frequency and not in amplitude. In order to simulate the short-term memory data it is necessary to postulate at least two types of odor bound receptors : an active receptor R bound with one odor mol1 ecule and an inactive receptor R which is formed by a slow 2 conformational transition from the R state. The binding 1 process is not in equilibrium but ““ open ÏÏ, i.e. the openness is guaranteed by an average residence time (1/k ) which the odor f molecules spend in a volume in the vicinity of the insect antenna. This mechanism leads to olfactory receptor adaptation occurring in the insect antenna through diminishing maxima in the R peaks which cause the intensity of the 1 antennal output to decrease in successive trials. We postulate that the antennal nerve current is proportional to the population of the active R states. If the peak height of each suc1 cessive R would be constant, as in simple law of mass action 1 binding, there would be no simpliÐcation in successive trials and the short-term memory e†ect would be absent, since the receptor output would be identical in each successive trial, leading to identical responses in the respective LNs and PNs. In order to simulate the increase in coherence and Ðring precision in the short-term memory experiments (10 successive odor presentations) we postulate a simple learning rule which increases the strength of all synapses (LN ] PN, PN ] LN and PN ] PN) by di†erent increments in each odor presentation. After the last odor pulse the incremental increase will disappear slowly within 12È16 min. Unfortunately, the use of a Hebbian ““ learning window ÏÏ is not feasible here, because the LNs are subthreshold with ill-deÐned Ðring times. Our model is also in agreement with experiments of odor stimulation of non-adapted antennal receptors which had been blocked during the previous 10 successive stimuli.8 Oscillatory synchronization is immediately obtained as a result of the increased synaptic strength from the previous 10 trials. One weak point in our calculations is that the synaptic strength is kept constant during a given trial. This is the reason why, in the model, the PN activity does not change 4070
Phys. Chem. Chem. Phys., 2001, 3, 4060È4071
appreciably over the stimulus duration while in vivo it probably does. This point can be corrected by using a more sophisticated learning procedure. The LN receives a similar but proportionately lower I signal (c \ 1 ] 106) than a PN. AN Simulations with an increased parameter c (factor 10) produced high PN frequencies which caused the disappearance of LFP and LN synchronization in the frequency range of 20È50 Hz. Our binding model represents the simplest two-state model which can be readily modiÐed, for example, by cooperative binding of two or more bound odor molecules or by inclusion of G-protein e†ects.30 Odors of di†erent molecular structures are likely to have di†erent receptors and therefore di†erent PNs some of which, however, may be shared. Only odorÈ receptor complexes with sufficiently high binding constants will be registered in the antennal lobe. From our physical chemical standpoint, the mixtures of odors will have to be described by the dynamics of competitive binding processes of odor molecules to their individual receptors and by overlapping PN ensembles, which is a complex task still to be solved quantitatively. The agreement between experimental and calculated trials is not quantitative but satisfactory considering the simpliÐcations made in the model. For example, Ca2` dependent currents may be incorporated producing bursts22 in the PNs. The present model calculations for the locust support the idea of synchronized ensemble oscillations in the low frequency range (20È50 Hz).31,32 Traditionally, olfactory short-term memory is considered to be localized in the mushroom bodies33 or upstream as proven by the use of mutants in Drosophila.34,35 Our present interpretation of the experiments on locusts is in agreement with the notion that other Hebbian processes upstream of the mushroom body also contribute to memory. Thus short-term memory may also reside in the antennal lobe through temporary changes in the synaptic strengths and in the olfactory receptor neurons through temporary population and depopulation of inactive receptor molecules.
Acknowledgements We are indebted to the referees for their critical remarks.
References 1 2 3 4 5 6 7 8 9 10 11 12 13 14 15 16 17 18 19
N. Schinor and F. W. Schneider, Biophys. Chem., 2000, 85, 199. G. Laurent and H. Davidowitz, Science, 1994, 265, 1872. M. Wehr and G. Laurent, Nature, 1996, 384, 162. G. Laurent, T rends Neurosci., 1996, 19, 489. K. MacLeod and G. Laurent, Science, 1996, 274, 976. K. MacLeod, A. Backer and G. Laurent, Nature, 1998, 395, 693. M. Wehr and G. Laurent, J. Neurosci., 1999, 19, 381. M. Stopfer and G. Laurent, Nature, 1999, 402, 664. P. G. Distler and J. Boeckh, J. Comput. Neurol., 1997, 378, 307 ; P. G. Distler and J. Boeckh, J. Comput. Neurol., 1997, 383, 529. See Insect Olfaction, ed. B. S. Hansson, Springer-Verlag, Berlin, 1999, for an excellent review. M. Stopfer, M. Wehr, K. MacLeod and G. Laurent, in Insect Olfaction, ed. B. S. Hansson, Springer-Verlag, Berlin, 1999, p. 163. A. Kukol and E. Neumann, Eur. Biophys. J., 1998, 27, 618. E. Neumann, E. Boldt, B. Rauer, H. Wolf and W. C. Hai, Bioelectrochem. Bioenerg., 1988, 20, 45. E. Neumann, J. Weber and T. Schurholz, Arch. Physiol. Biochem., 1996, 104, 731. R. Ritz and T. J. Sejnowski, Curr. Opin. Neurobiol., 1997, 7, 536. A. L. Hodgkin and A. F. Huxley, J. Physiol., 1952, 117, 500. T he Handbook of Brain T heory and Neural Networks, ed. M. A. Arbib, MIT Press, Cambridge, MA, 1995. C. Koch, Biophysics of Computation : Information Processing in Single Neurons, Oxford University Press, New York, 1999. F. Buchholtz, J. Golowasch, I. R. Epstein and E. Marder, J. Neurophysiol., 1992, 67, 332.
20 21 22 23 24 25 26 27
B. Alberts, D. Bray, J. Lewis, M. Ra†, K. Roberts and J. D. Watson, Molecular Biology of the Cell, Garland Publishing, New York, 3rd edn., 1994. C. C. Chow and J. A. White, Biophys. J., 1996, 71, 3013. A. Destexhe, D. Contreras, T. J. Sejnowski and M. Steriade, J. Neurophysiol., 1994, 72, 803. X.-J. Wang and G. Buzsaki, J. Neurosci., 1996, 16, 6402. R. Kempter, W. Gerstner and J. L. van Hemmen, Phys. Rev. E, 1999, 59, 4498 ; G. Bi and M. Poo, J. Neurosci., 1998, 18, 10464. S. Song and L. F. Abbott, in Computational Neuroscience, T rends in Research 2000, ed. J. Bower, Elsevier, Amsterdam, 2000 ; S. Song and L. F. Abbott, Neurocomputing, 2000, 32–33, 523. I. R. Epstein and J. A. Pojman, An Introduction to Nonlinear Chemical Dynamics : Oscillations, W aves, Patterns and Chaos, Oxford University Press, New York, 1998. F. W. Schneider and A. F. Munster, Nichtlineare Dynamik in der Chemie, Spektrum Akademischer Verlag GmbH, Berlin, 1996.
28 29 30 31 32 33 34 35
N. J. Vickers, T. A. Christensen, T. C. Baker and J. G. Hildebrand, Nature, 2001, 410, 466. T. A. Christensen, B. R. Waldrop, I. D. Harrow and J. G. Hildebrand, J. Comput. Physiol. A, 1993, 173, 385. W. M. Getz, Chem. Senses, 1999, 24, 497. P. Koenig, A. K. Engel and W. Singer, T rends Neurosci., 1996, 19, 130. C. von der Malsburg, T he Correlation of Brain Science, Internal Report, Max-Planck-Institut f. Biophys. Chem., Gottingen, 1981. T. Faber, J. Joerges and R. Menzel, Nature Neurosci., 1999, 2, 74 ; M. Hammer and R. Menzel, J. Neurosci., 1995, 15, 1617 ; M. Hammer and R. Menzel, L earning Mem., 1998, 5, 146. T. Zars, M. Fischer, R. Schulz and M. Heisenberg, Science, 2000, 288, 672. J. Dubnau, L. Grady, T. Kitamoto and T. Tully, Nature, 2001, 411, 476.
Phys. Chem. Chem. Phys., 2001, 3, 4060È4071
4071