Design Engineering at the University of Waterloo, Canada, in 1992. From 1976 to ... R.A. Sahner is with Motorola Microcomputer Division, Urbana, IL 61801.
IEEE TRANSACTIONS ON EDUCATION. VOL. 36. NO. 1, FEBRUARY 1993
56
191 K. Ponnambalam, and W.F. Curi, Comment on “On the meaning of randomness in stochastic environment models” by Zielinski, Water Res. Res., vol. 28, no. 4, pp. 1187-1189, 1992. [ l o ] J . Wojcicchowski and J. Vlach, Ellipsoidal method for design centering and yield estimation, submitted to IEEE Trans. CAD, 1991. (1 11 P. E. Kloeden, and E. Platen, “A survey of numerical methods for stochastic differential equations,” Stochastic Hydraulics, Hydrology, vol. 3, pp. 115-178, 1989. [ 121 A. H . Jazwinski, Stochusric Processes, Filtering Theory. San Diego, CA: Academic, 1970. [ 131 D. Zwillinger, Handbook of Differential Equations. Toronto: Academic, 1989. [ 141 W. F. Curi, and T. E. Unny, “An automatic formulation of the first and second order moment equations for a set of linear Ito equations,” in Proc. IASTED, Int’l Conf Modeling Simulation, Calgary, Canada, 1991. (151 J. R. Benjamin, and C. A. Corncll, Probability, Statistics, and Decisions for Civil Engineers. New York: McGraw-Hill, 1970. [16] W. F. Curi, “Theoretical analysis of large scale stochastic systems with environmental applications,” Ph.D. dissertation, Univ. of Waterloo, Dept. Syst. Design Eng., Ontario, Canada, 1992. [17] A.H.S. Ang, and W.H. Tang, Probability Concepts in Engineering Planning and Design,vol. 11. New York: Wiley, 1984. [ 181 B. W. Char, et al. “MAPLE - Reference Manual,” WATCOM Pub. Ltd, Waterloo, Ontario, Canada, 1988. [I91 A. Grace, Optimization Toolbox for use with MATLAB - User’s Guide. South Natick, MA: The Mathworks, 1990.
W. F. Curi received the B.E. and MSc. degrees in electrical engineering from the Universidade Federal de Goias, Brazil, in 1978, and Universidade Federal da Paraiba, in 1984, Brazil, respectively, and the Ph.D. degree from Systems Design Engineering at the University of Waterloo, Canada, in 1992. From 1976 to 1980 he worked as a teacher of physics and mathematics for several elementary and secondary schools. He joined the Physics Department at the Universidade Federal da Pardiba, Brazil, in 1980, where he was the Chairman of the department during 1985-1986 and is currently a ‘professor adjunto.’ He was a member of the coordinating committee of Electrical and Civil Engineering Departments of the same university, responsible for the undergraduate curriculum development and student affairs. He is currently a Visiting Assistant Research Professor at the Systems Design Engineering Department of the University of Waterloo. His main research interests include the areas of probabilistic and stochastic modelling, optimization, and development of CAD for circuit analysis and design.
.
K. Ponnambalam received the B.E. degree from Madras University, in 1979,
1
and M.Sc. degree from the National University of Ireland, in 1981, and Ph.D. degree from the University of Toronto, Canada, in 1987. He is currently an Assistant professor in the Department of Systems Design Engineering, University of Waterloo, Canada. In addition to his interest in engineering educational issues, his main research interests include stochastic modeling, and large scale optimization.
i
A Software Tool for Learning About Stochastic Models Robin A. Sahner and Kishor SPTrivedi, Fellow, IEEE
Abstrucl- The study of stochastic modeling can be greatly enriched by the use of computer software. Such software stould enable students to experiment with modeling techniques, check their understanding of algorithms for model analysis, develop the skills and “intuition” to know how to evaluate results, and experiment with using models to evaluate design tradeoffs. In this paper, we use a series of examples to show how a powerful and general modeling program can be used in an educational setting.
I. INTRODUCTION
C
OMPUTER software can be a very useful aid in the teaching of mathematics, computer science, and engineering. This includes involving students in both writing and using software that illustrates the subject matter. As examples, we cite the extensive use of Mathematical, in all kinds of diverse courses and an increasing use of software in the teaching of calculus [1]-[3]. In this paper, we use SHARPE (Symbolic Hierarchical Automated Reliability/Performance Evaluator), a software system that analyzes stochastic models. SHARPE was developed to be used for modeling real systems, and it has been in use Manuscript received July 1992. R.A. Sahner is with Motorola Microcomputer Division, Urbana, IL 61801. K. S. Trivedi is with the Department of Electrical Engineering and Computer Science, Duke University, Durham, NC 27706. IEEE Log Number 9205764. Mathemarica is a trademark of Wolfram Research Inc.
for that purpose for several years [4], [5]. It has also been used by researchers [6]. However, it can also be a very useful tool for students taking courses in stochastic modeling. Such courses are offered in computer science, computer engineering, operations research, industrial engineering, and mathematics curricula. SHARPE allows students to set up and solve a variety of model types, to compare results for different models of the same system, to see how altering system parameters affects measures of effectiveness of the system, and to experiment with modeling techniques, including the use of exact and approximate system or model decomposition. It can also be used to illustrate problems of large state spaces and stiff systems and to provide examples of methods for avoiding these problems. Using SHARPE, one can specify and analyze the following model types separately or in combination: fault trees, reliability block diagrams, reliability graphs, product-form queueing networks, series-parallel acyclic directed graphs, Markov and semi-Markov chains and generalized stochastic Petri nets. In this paper, we will look at a simple multiprocessor computer system example and present SHARPE models that illustrate various modeling concepts and techniques. The simplicity of the example will allow us to concentrate on the concepts and techniques; SHARPE is capable of analyzing much more complex models.
0018-9359/93$03.00 0 1993 IEEE
c
I
IEEE TRANSACTIONS ON EDUCATION. VOL. 36, NO I . FEBRUARY l Y Y 3
57
.
@--& mem
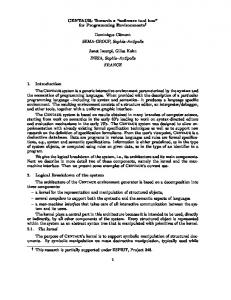
k=2 000000 I sysprob(archl;k.3,0135. 00692). 9.0967e-01 ~
I
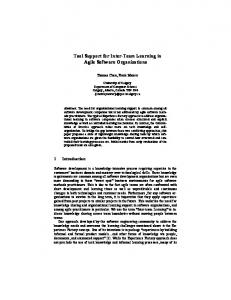
Fig. 1. Reliability block diagram. 1 block archl(k,n,pfail,mfail) 2 comp proc prob(pfai1)
k=3.000000
Fig. 3.
SHARPE output for block diagram.
3 comp mem prob(mfai1) 4 parallel procs proc proc 5 kofn mems k,n,mem 6 series top procs mems 7 end
On line 1, the keyword block tells SHARPE what kind of model this is. We give the model a name, urchl, by which we can refer to it later, and a set of parameters. k is the number 8 of memory modules required for the system to operate, n is 9 loop-k,1,3,1 the total number of memory modules, pfuil is the processor 10 expr 1 - sysprob(archl;k,3,.013S,.00692) 11 end failure probability and mfuil is the memory failure probability. 12 end On lines 2 and 3, we define the component names and assign to each a probability value. The built-in function prob takes Fig. 2. SHARPE input for block diagram one argument, the probability that the component has failed by some implicit, unspecified time. On lines 4 through 6, we In Section 11, we show how SHARPE can demonstrate the specify the structure of the block diagram, bottom up. use of fault trees, reliability block diagrams, and reliability The SHARPE built-in function sysprob is provided for use graphs to model system reliability (the complementary dis- with models like this one, whose components are assigned tribution of the time until system failure). In Section 111, we probability values. sysprob gives the system failure probability show how availability of systems in which components can value. On lines 9 through 11, we ask for the system reliability be repaired can be modeled with fault trees and with Markov (the failure probability value subtracted from one) for a system models. In Section IV, we show how to use SHARPE to with 3 memories, particular values of pfuil and mfuil, and obtain system performance measures from queueing networks. values of k: ranging from one to three. The keyword expr In Section V, we briefly describe how SHARPE can be used on line 10 tells SHARPE that the rest of the line contains an for hierarchical modeling. arithmetic expression to be evaluated. The results are shown in Fig. 3. If the system needs only one memory module to operate, 11. SYSTEMRELIABILITY MODELS chances are 99.98% that the system will still be up after 10 In this section, we show how SHARPE can be used to days. If two memory modules are needed, the reliability is demonstrate the following stochastic modeling concepts: the 99.97%, almost as good. But if all three memory modules are use of block diagrams, fault trees, and reliability graphs to needed, the reliability is down to 97.9%. It looks like it might model reliability and investigate design tradeoffs, the differ- be worth the effort to design the operating system so it can ence between modeling with probability values and modeling work with only two memory modules, but further effort to with distribution functions, the use of models to investigate make it work with only one memory module probably is not the effect of changes in system parameters, and the process of worth it. SHARPE allows a more general parameterization of this model validation through independent equivalent models. We begin by considering a fault-tolerant, multiprocessor model; it allows a failure-time distribution function, rather computer with multiple, shared memory modules. The system than a probability value, to be attached to each component. For is able to detect a processor or memory module failure and example, one can assign the exponential distribution Fp( t )= to reconfigure itself to continue operation without the failed 1 - t:-0.00139t to processors and F,,,(t) = 1 component. The system's hardware can operate with just one memories. We note that F,,(lO) = 0.0138 and F,,(10) = processor and one memory module. But, software considera- 0.00692, the same as the probability values assigned above. We can request the system failure-time distribution as tions might require that more memory modules be operational. For example, the computer's operating system will require a function of the time variable 1'. For a system that can some minimum amount of memory; the smaller we want to operate with one memory module, F,?,(t)= 1 - 6e-0.0021t make that minimum, the more work is required in operating (jc,-0."028' + (