Journal of Computational Information Systems 8: 4 (2012) 1433–1440 Available at http://www.Jofcis.com
A Source Cell-phone Identification Scheme Based on Canonical Correlation Analysis of Photo Response Non-uniformity Min LONG 1,∗, 1 College 2 College
Ting PENG 1 , Fei PENG 2
of Computer and Communication Engineering, Changsha University of Science and Technology, Changsha 410114, China
of Information Science and Engineering, Hunan University, Changsha 410082, China
Abstract According to characteristic of the photo response non-uniformity (PRNU) for the camera, a new method using canonical correlation analysis method to identify the source cell-phone of a photo is proposed. Compared with the typical method detecting a photo using a monochromatic channel, this method detecting a photo using three color channels can reflect the noise characteristics of imaging sensor more comprehensively. The experimental results demonstrate that the proposed method achieves improved performance. Keywords: Source Cell-phone Identification Forensic; Canonical Correlation Analysis; Imaging Sensor; PRNU Noise
1
Introduction
With the rapid development of information technology, digital photos presented as evidence in a court is becoming possible, however, the authentication of them is still need to be resolved. Digital image forensics techniques are proposed to identify the source of images, distinguish synthetic images and real images, and determine whether the image has been tampered or not [1]. At present, source cell-phone identification are focused on researches by using pattern classifier to identify the source of photos with features extracted from the color, quality, wavelet coefficient statistics and binary similarity statistical characteristic of photos. In Reference [2], binary similarity features and image quality features are firstly extracted by using Sequential Forward Feature Selection (SFFS) algorithm, and then a Support Vector Machine (SVM) is trained to classify a group of 9 cell-phones. The identification accuracy is 83%, however, the existing methods can only identify the model of cell-phones, but can not identify the individual of them. 2 cell-phones with the same mode are tested with the method [3] and the identification accuracy is only 50%. Therefore, it’s necessary to find an effective method to identify an individual cell-phone. ∗
Corresponding author. Email address:
[email protected] (Min LONG).
1553–9105 / Copyright © 2012 Binary Information Press February 2012
1434
M. Long et al. /Journal of Computational Information Systems 8: 4 (2012) 1433–1440
It is known that cell-phone and camera have similar noise characteristics in imaging processing. Similarly, the individual cell-phone can be identified by its inherent fingerprint, namely PRNU noise produced by imaging sensor. Lukas firstly applied it for source camera identification [4], and it achieved a higher accuracy. Hu proposed a method for source camera identification based on large component of sensor pattern noise [5], however, only one color channel is employed. Since color images have three color channels, if they are analyzed simultaneously, it can reflect the noise characteristics of imaging sensor comprehensively. Based on the conception in Reference [5], a method is proposed in this paper to indentify the individual cell-phones by using canonical correlation analysis. First of all, three rough pattern noise are acquired by filter de-noising and de-CFA interpolation in three color channels of all photos, respectively, then the three reference pattern noises are obtained, finally the source cellphone of the photos are identified by using canonical correlation analysis method.
2
Noise in Cell-phone
At present, CMOS(Complementary Metal Oxide Semiconductor) sensors are widely used in cellphones, which generate PRNU noise. [6]. PRNU noise is a multiplicative noise which changes along with the signal strength and it is caused by the inhomogenity of silicon wafers and imperfections during the sensor manufacturing process. i.e., different cell-phones of the same mode will have different PRNU noise. Therefore, the sources of photos captured from different cell-phones can be identified by analyzing their PRNU noise. Photo I stemmed from a cell-phone imaging pipeline can be defined as follows: I =F ·O+N
(1)
Where O denotes the ideal noise-free image, F and N denote the PRNU and the temporal noise, respectively. In general, P in Equation (2) is considered as the estimate of PRNU noise[7]. P = I − f (I)
(2)
where f is a low-pass filter. The purpose of Equation (2) is to separate PRNU from image. Wiener filter [8] is a kind of linear filter based on the Minimum Mean Square Error (MMSE), which is widely used in image de-noising. Here, wiener filter is applied to extract PRNU. For multiple photos Ii (i = 1, 2, · · · , n) taken by a same cell-phone, an approximation can be obtained to form cell-phone pattern noise Pcell by averaging their PRNU, which is formulated in Equation (3). 1∑ = Pi n i=1 n
Pcell
(3)
M. Long et al. /Journal of Computational Information Systems 8: 4 (2012) 1433–1440
3
1435
Discription of the Identification Scheme
3.1
Canonical correlation analysis
Canonical Correlation Analysis (CCA)was first proposed by Hotelling in [9]. The basic principle is described as follows: two representative variables are extracted by linear combination variables in two groups, respectively, and these two representative variables are used to reflect the correlation of two groups of variables. Given two zero mean random variables x ∈ Rp and y ∈ Rq , the target of CCA is to find a pair of direction a1 and b1 , which obtain the maximum correlation between projection u1 = aT1 x and v1 = bT1 y, where u1 and v1 are named as the first pair canonical variables. The second pair u2 and v2 are formed which have the maximum correlation but are uncorrelated with u1 and v1 , respectively. In a same way, L = min(p, q) pairs of canonical variables can be acquired. Assume X = [x1 , x2 ...xN ] ∈ Rp×N and Y = [y1 , y2 ...yN ] ∈ Rq×N are N samples of random variables x and y. The correlation coefficient ρu,v is E(uv) aT Cxy b E(aT xy T b) √ √ ρu,v = √ =√ =√ aT Cxx abT Cyy b E(aT xxT a) E(bT yy T b) Eu2 Ev 2
(4)
where Cxx ∈ Rp×p , Cyy ∈ Rq×q , and they are the cross-covariance matrices of x and y, respectively. Cxy ∈ Rp×q denotes their covariance matrix. Due to the extremum of ρu,v has no relation with the magnitude of a and b, except the direction of them, a constraint condition is defined as shown in Equation (5). aT Cxx a = bT Cyy b = 1
(5)
Therefore, the objective of CAA is to compute the maximum of ρu,v with the constrain of Equation (5), i.e., ρmax = aT Cxy b (6) Applying Lagrange multiplier technique to Equation (6), then get L(a, b) = aT Cxy b −
λ1 T λ2 (a Cxx a − 1) − (bT Cyy b − 1) 2 2
(7)
where λ1 and λ2 are Lagrange multipliers. Partial derivatives are done to a and b, respectively, ∂L = Cxy b − λ1 Cxx a = 0 ∂a
(8)
∂L = Cyx a − λ2 Cyy b = 0 ∂b
(9)
aT and bT are multiplied to Equation (8) and Equation (9), respectively, aT Cxy b = aT λ1 Cxx a
(10)
bT Cyx a = bT λ2 Cyy b
(11)
1436
M. Long et al. /Journal of Computational Information Systems 8: 4 (2012) 1433–1440
Obviously, λ1 = λT2 = λ2 . Given λ = λ1 = λ2 , according to Equation (6), λ = ρmax is obtained. Inserting λ into Equation (8) and Equation (9), ( )( ) ( )( ) 0 Cxy a Cxx 0 a =λ (12) Cyx 0 b 0 Cxy b Eigenvectors a, b and eigenvalue λ can be computed according to Equation (12).
3.2
Identification scheme of source cell-phone
The proposed scheme is described as follows: Step1 Extraction of cell-phone pattern noise a) As for all photos Ii (i = 1, 2...n), noise extraction and de-CFA interpolation operation are done to in each color channel (including R, G, B), then these noises are averaged as three rough reference pattern noises Wr , Wg ,and Wb , respectively. b) Wr , Wg , and Wb are sorted in descending order, and the first n elements are converted to three row vectors Pr , Pg , and Pb , respectively. Here n is 5% of the number of pixels. Step2 Identification process To identify whether a special photo J was taken by cell-phone M , three noises Nr , Ng and Nb from R, G, B channels of the photo are extracted through the processing similar to step1, and the corresponding row vector nr , ng , nb are acquired according to step1-b), then get x = (pr , pg , pb )T and y = (nr , ng , nb )T . Since noise usually follows the hypothesis of zero mean Gaussian distribution and the correlation ρ between X = [x1 , x2 ...xN ] ∈ Rp×N and Y = [y1 , y2 ...yN ] ∈ Rq×N can be calculated according to Equation (4). Generally, the correlations between noises of photos taken by a same cell-phone should be strong, otherwise the correlations should be weak. Therefore, the source cell-phone of a photo can be identified by comparing ρ by setting a proper threshold T as shown in Equation (13). {
ρ > T,
photo J was taken by cell - phone M
ρ < T, photo J wasn’t taken by cell - phone M
(13)
Here, the threshold T is determined in experiments.
4
Experiment
Four cell-phones are selected for experiments, and 300 photos are taken from each cell-phone, where 150 photos are used for extracting cell-phone pattern noise and the left 150 photos are used for identification tests. The model of the cell-phones are shown in Table 1. The resolutions of all photos are adjusted to 640 × 480. According to Reference [5], the smaller n is, the stronger the correlations are, but the standard deviation will increase when the correlation mean increase, which will result in the increases of
M. Long et al. /Journal of Computational Information Systems 8: 4 (2012) 1433–1440
1437
Table 1: The cell-phones used in the experiments Cell-phone model
Sensor type
The largest resolution
Dopod D9000
CMOS
1600 × 1200
Nokia N86
CMOS
3624 × 2448
Nokia 5220
CMOS
1200 × 1600
Samsung M628
CMOS
640 × 480
detection error. In order to compromise the influence of mean and standard deviation, the value of n is selected as 5% of the whole number of pixels in experiments. The comparison results of correlation mean and standard deviation of two methods are shown in Table 2. Table 2: Correlation mean and standard deviation of two methods Method in [5] Our method Cell-phone model mean standard deviation mean standard deviation Dopod D9000
0.1668
0.0633
0.1944
0.0625
Nokia N86
0.2032
0.0678
0.2308
0.0664
Nokia 5220
0.1402
0.0468
0.1812
0.0529
Samsung M628
0.1449
0.0431
0.1952
0.0480
As seen in Table 2, the proposed method has little improvement to the correlation standard deviation, but has significant impact on the correlation mean. That is, the distance between photos with matching cell-phone and mismatching cell phones is enlarged. Here, canonical variables are set as p = q = 3, L = 3. According to the principle of CCA, ρ have three values: ρ1 , ρ2 and ρ3 , where ρ1 > ρ2 > ρ3 . when calculating canonical correlation, it is processed as follows: { ρ=
ρ1 ,
when a photo matches the cell-phone
ρ3 , when a photo dismatches the cell-phone
(14)
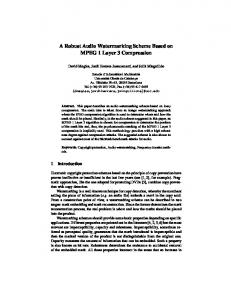
Experiments are done to the proposed method and the method in Reference [5] to analysis their performance, and the results are shown in Fig. 1 – Fig. 4. It can be seen that the dispersion degree of the proposed method is smaller than that of the method in Reference [5], which will improve the accuracy of identification. According to Neyman-Pearson criterion, a threshold is calculated to minimize the false rejection rate (FRR) with a given false acceptance rate (FAR). The threshold T and FRR of all 4 cell-phones for the method in Reference [5] and the proposed method is shown in Table 3, where FAR=0.001. It is can be seen that the proposed method can achieve a higher accuracy of identification than that of the method in Reference [5].
1438
M. Long et al. /Journal of Computational Information Systems 8: 4 (2012) 1433–1440
Table 3: Correlation mean and standard deviation of two methods Method in [5] Our method Cell-phone model T FRR T FRR Dopod D9000
0.0309
0.0199
0.0158
0.0089
Nokia N86
0.0299
0.0083
0.0142
0.0034
Nokia 5220
0.0315
0.0141
0.0163
0.0058
Samsung M628
0.0389
0.0109
0.0198
0.0020
0.5
0.5
Dopod D9000 Nokia N86 Nokia 5220 Samsung M628
0.4
0.3
Correlation
0.3
Correlation
Dopod D9000 Nokia N86 Nokia 5220 Samsung M628
0.4
0.2
0.1
0.2
0.1
0
0
-0.05
-0.05 0
30
60
90
120
150
0
30
60
Photos
90
120
150
Photos
(a) Experiment results of the proposed (b) Experiment results of the method in method Reference [5] Fig. 1: Distribution of correlations between photos taken by 4 cell-phones and pattern noise from Dopod D9000(Each type has 150 photos).
0.5
0.5
Dopod D9000 Nokia N86 Nokia 5220 Samsung M628
0.4
0.3
0.3
Correlation
Correlation
Dopod D9000 Nokia N86 Nokia 5220 Samsung M628
0.4
0.2
0.1
0.2
0.1
0
0
-0.05
-0.05
0
30
60
90
Photos
120
150
0
30
60
90
120
150
Photos
(a) Experiment results of the proposed (b) Experiment results of the method in method Reference [5] Fig. 2: Distribution of correlations between photos taken by 4 cell-phones and pattern noise from Nokia N86(Each type has 150 photos).
1439
M. Long et al. /Journal of Computational Information Systems 8: 4 (2012) 1433–1440 0.5
0.5
Dopod D9000 Nokia N86 Nokia 5220 Samsung M628
0.4
0.3
Correlation
0.3
Correlation
Dopod D9000 Nokia N86 Nokia 5220 Samsung M628
0.4
0.2
0.1
0.2
0.1
0
0
-0.05
-0.05 0
30
60
90
120
150
0
30
60
Photos
90
120
150
Photos
(a) Experiment results of the proposed (b) Experiment results of the method in method Reference [5] Fig. 3: Distribution of correlations between photos taken by 4 cell-phones and pattern noise from Nokia 5220(Each type has 150 photos).
0.5
0.5
Dopod D9000 Nokia N86 Nokia 5220 Samsung M628
0.4
0.3
Correlation
0.3
Correlation
Dopod D9000 Nokia N86 Nokia 5220 Samsung M628
0.4
0.2
0.2
0.1
0.1
0
0
-0.05
-0.05 0
30
60
90
Photos
120
150
0
30
60
90
120
150
Photos
(a) Experiment results of the proposed (b) Experiment results of the method in method Reference [5] Fig. 4: Distribution of correlations between photos taken by 4 cell-phones and pattern noise from Samsung M628(Each type has 150 photos).
5
Conclusion
In this paper, a method using CCA to detect the source cell-phones of photos is proposed. Compared with the method in Reference [5], its advantage lies in breaking the limitations of detecting in one color channel, and three color channels are all used in the proposed method simultaneously, which makes the result more reliable. Moreover, correlation maximization of CCA can distinguish photos from different cell phones more effectively. The experimental results also illustrate its feasibility. It has great potential in the application of distinguish the source of photos from different cell-phones.
1440
M. Long et al. /Journal of Computational Information Systems 8: 4 (2012) 1433–1440
Acknowledgement This work is supported by the Network and Information Security Key Laboratory Foundation of Hunan Province, China (Grant No. NISL201002), and the National Natural Science Foundation of China (Grant No. 61001004, No. 61070195) and the Education Department Foundation of Hunan Province (Grant No. 11B002).
References [1]
H. T. Sencar and N. Memon.Overview of State-of-the-Art in digital image forensics. In Indian Statistical Institute Platinum Jubilee Monograph series titled Statistical Science and Interdisciplinary Research. World Scientific, 2008.
[2]
O. Celiktutan, B. Sankur, I. Avcıbas, and N. Memon. Source cell-phone identification. Proc. ADCOM, pages 1 – 3, 2006.
[3]
V. T. Lanh, S. Emmanuel, and M. S. Kankanhalli. Identifying source cell phone using chromatic aberration. In Proc. IEEE Conference on Multimedia and Expo, pages 2 – 5, 2007.
[4]
J. Lukas, J. Fridrich, and M. Goljan. Digital camera identification from sensor pattern noise. IEEE Trans.Inf. Forensics Security, pages 205 – 214, 2006.
[5]
Yongjian Hu, Binghua Yu, and Chao Jian. Source camera identification using large components of sensor pattern noise. computer applications, pages 31 – 35, 2010.
[6]
A. El Gamal and H. Eltoukhy. CMOS image sensors. IEEE Circuits and Devices Magazine, pages 6 – 20, 2005.
[7]
Erwin J. Alles, Zeno J. M. H. Geradts , and Cor J. Veenman. Source camera identification for low resolution heavily compressed images. In Proc. of IEEE International Conference on Computational Sciences and its Applications, pages 557 – 567, 2008.
[8]
A. Castiglione, G. Cattaneo, M. Cembalo, and U. F. Petrillo. Source camera identification in real practice: a preliminary experimentation. In Proc.of IEEE Conference on BWCCA, pages 417 – 422, 2010.
[9]
H. hotelling. Relations between two sets of variates. Biometrika, pages 321 – 377, 1936.