Send Orders of Reprints at
[email protected] The Open Environmental Engineering Journal, 2013, 6, 7-13
7
Open Access
A Spreadsheet-Based Site Specific Risk Assessment Tool for Land-Applied Biosolids Jingjie Teng1,*, Arun Kumar2, Patrick L. Gurian1 and Mira S. Olson1 1
Department of Civil, Architectural, and Environmental Engineering, Drexel University, 3141 Chestnut Street, Philadelphia, PA 19104, U.S.A 2
Department of Civil Engineering, Indian Institute of Technology Delhi, HauzKhas 110016, New Delhi, India Abstract: Due to the complexity of risk assessments, models tend to be dense and difficult for users to follow and modify in order to meet their needs. A spreadsheet-based tool, named the Spreadsheet Microbial Assessment of Risk: Tool for Biosolids (SMART Biosolids), has been developed for quantitative microbial risk assessment of land-applied biosolids, which is intended to address these challenges. The model combines spreadsheets with add-in visual basic macros in a rational and supportable manner. Spreadsheets serve as a familiar interface for an archive of relevant inputs for parameter values and references.The exposure model is also encoded in the spreadsheet, which allows users to trace back computations through the model and modify parameters if necessary. Add-in macros are used to implement a nested sampling routinethat calls the exposure model encoded in the spreadsheet many times to calculate values for different pathogens and to perform a Monte Carlo uncertainty analysis. An example application finds that adenovirus is the pathogen presenting the highest risk by the groundwater pathway. However, uncertainties are large indicating that additional information on the fate and transport of adenovirus in groundwater would be helpful. The SMART Biosolids model may be useful for informing a number of decisions. Regulators and land application program managers may be able to use the model to review different sites and determine which sites are most appropriate for land application. Researchers may use the model to integrate information and identify key gaps in knowledge warranting future research.
Keywords: Risk assessment, Biosolids land application, Spreadsheet. 1. INTRODUCTION Biosolids, which is defined as the treated sewage sludge from wastewater treatmentplants, has been often used as fertilizer to improve and maintain productive soils and to stimulate plant growth for over 40 years [1]. With the benefits from biosolids, it may contain minerals to contaminate the environment, and also contain pathogens harmful to human health. Quantitative Microbial Risk Assessment (QMRA) for biosolids is a scientifically based approach that using epidemiologic information, dose response models, and exposure data to characterize the probability of human infection due to exposure to land-applied biosolids. To this day, there have been several QMRA studies on the land-applied biosolids, considering exposure scenarios of accidental direct ingestion, aerosol inhalation, groundwater direct ingestion, and contaminated food ingestion [2-8]. It is found that the accidental direct ingestion produced the highest annual risk, inhalation produced the next highest risk, and that risks from groundwater and direct ingestion of contaminated food were *Address correspondence to this author at the Department of Civil, Architectural, and Environmental Engineering, Drexel University, 3141 Chestnut Street, Philadelphia, PA 19104, U.S.A; Tel: 515-528-0049; Fax: 215-895-1363; E-mail:
[email protected] 1874-8295/13
low. Due to the fact that risk assessments usually consist of multiple linked modules (e.g. exposure assessment, doseresponse, risk characterization), each with their own set of assumptions, inputs, and computations, risk assessment models tend to be dense and poorly documented making it difficult for others to reproduce a risk assessment [9-13]. Spreadsheets have been widely applied to different areas, such as environmental modeling [14-16], epidemiology [17, 18], and others [19-21]. There are a number of applications of spreadsheets in microbial risk assessment, most of which are in the area of food safety [22-24]. Several studies use spreadsheets to develop individual parts of the quantitative microbial risk assessment, such as modeling initial concentrations [25], dose-response relationships [26], pathogen transmission dynamics [27], and risk ranking [28]. While there are several well-developed spreadsheet-based environmental fate and transport models [16, 29-31], to date, there are no available comprehensive spreadsheet models that link quantitative microbial risk assessment with microbial fate and transport modeling. Use of spreadsheets in QMRA provides a visual layout of the model, which hides detailed computations initially but also allows the inputs for each computation to be traced back to their source, and it may improve the user’s ability to follow and modify the model. 2013 Bentham Open
8 The Open Environmental Engineering Journal, 2013, Volume 6
5. Consumption of water contaminated by runoff from a land application site
Teng et al.
1. Inhalation of aerosols from land application sites
2. Consumption of groundwater contaminated by biosolids
Biosolids Land Application
4. Ingestion of plants grown on biosolidsamended fields
3. Direct ingestion of biosolidsamended soils
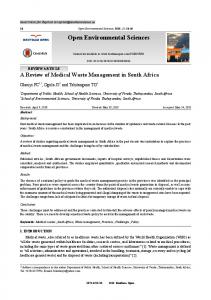
Fig. (1). Exposure Pathways Considered.
2. METHODOLOGY This paper describes a computational model, named The Spreadsheet Microbial Assessment of Risk: Tool for Biosolids (SMART Biosolids), including its spreadsheet interface and add-in macros. SMART Bio solids model estimates risk associated with exposure to pathogens from land-applied biosolids through five pathways (Fig. 1). These five pathways were identified through previous research efforts that developed a framework for microbial risk assessment from land-applied biosolids [6, 32, 33]. SMART Biosolids model assesses risk to highly exposed individuals, such as residents whose homes border land application sites. This is in keeping with the National Research Council recommendation that biosolids risk assessments should focus on highly exposed individuals [34]. The environmental fate and transport models associated with each of the exposure pathways are computed in Microsoft Excel [35]. Each of the exposure pathway models is described briefly below. Inhalation of aerosols from land application sites is modeled by superposition of Gaussian plume dispersion models from different locations on a grid representing the field where the land application is taking place [36-38]. Consumption of groundwater affected by land-applied biosolids is modeled by first using a Green-Ampt model to determine the depth of the wetting front associated with any wet weather events [39-41], and then a series of one-dimensional advection-dispersion models [42, 43] are use to describe transport through the soil. A microbial transport model for saturated media is used to describe vertical transport of microbes to the end of the wetting front, and then a transport model for
unsaturated media is used to describe vertical transport to the water table (this step is skipped if the wetting front extends to the water table). Finally the saturated media transport model is used to describe horizontally from the field to a down gradient well. Contributions from different locations in the field are superimposed to obtain the net concentrations at the well. Direct ingestion of biosolids-amended soils is modeled by allowing for first order decay of applied microorganisms followed by the use of standard exposure factors for incidental ingestion of soil [44]. Consumption of water contaminated by runoff from a land application site is modeled first estimating runoff from wet weather events using the Green-Ampt infiltration model [39-41]. Then the Revised Universal Soil Loss Equation [45] is revised and used in a finite difference approach to track net eroded vs. deposited soil (with associated biosolids) over a one-dimensional flow path. Transport of free microbes (those not associated with soil particles) is tracked separately. Both free and soilassociated microbes are assumed to runoff to a pond with human exposure occurring by full-contact recreation in the pond. Ingestion of plants impacted by land-applied biosolids is modeled by assuming that the runoff goes into an adjoining field with a portion retained by the leaves of a lettuce plant. First order decay is modeled between the time of contamination and consumption. For all models standard exposure factors [44] and literature dose-response models are used to calculate risks based on the environmental concentrations estimated from the different pathways models. The general assumptions considered in this tool are listed below. Assumption specific to the five pathways are described in Galada et al., 2012 [35].
A Spreadsheet-Based Site Specific Risk Assessment Tool for Land-Applied
The Open Environmental Engineering Journal, 2013 Volume 6 9
2.1. User-Friendliness of Spreadsheet
Begin
Macro: Sample general inputs
Macro: Choose organism and Sample organismspecific inputs
Spreadsheet: Transport models
Macro: Risk calculation and output results
All organisms characterized?
no
no
yes Uncertainty characterized?
yes End Fig. (2). Flowchart of the SMART Biosolids model.
1) Land-applied biosolids are assumed to be the only source of pathogens in this work; 2) The model assesses the risk to humans only; 3) For a given biosolids-associated pathogen, exposures from different media are independent of each other (this enables risks to be aggregated across pathogens in a straightforward manner); 4) Exposures to different biosolids-associated pathogens are independent of each other; 5) Exposure factors for different routes and subpopulations are based on values from the EPA Exposure Factor Handbook [44]; 6) When a dose-response model is not available for the inhalation route, an ingestion-based dose-response model is used with ingested dose equal to 50% of the inhaled dose [4]. This is a rough estimation of the fraction of microbes that deposit in the upper respiratory system during inhalation and are transferred to the digestive system through the mucociliary escalator. The two different components, spreadsheet and Visual Basic macros, are used in a rational and supportable manner.
The exposure pathways, which are the most complicated part of the model, are coded in the spreadsheet. The use of a spreadsheet allows the advanced user to trace the computations and modify parameters, and even change mathematical algorithms as desired. Spreadsheets provide a readily accessible platform for the storage of the many parameters required by the model. User-friendliness was tested by professionals in the biosolids field who had no background in statistics or risk assessment. 2.2. Loop Calculation by Visual Basic Macros The exposure models are complex and require that a substantial amount of information be kept in working memory in order to have these computations available for the user in the spreadsheet environment. For example, superposition is used to estimate the cumulative effect of spatially dispersed sources for the air and groundwater pathways and a finite difference approach is used to track sediment erosion and deposition over a flow path for the surface water model. The same exposure model is used multiple times with different parameters and different possible input values (that is, Monte Carlo uncertainty analysis is performed for each organism). Unfortunately commercially available Monte Carlo add-ins (e.g. @risk, Crystal Ball) do not readily support nested sampling. Thus, it would be necessary to conduct separate analyses for each microorganism (i.e. keep separate copies of the exposure model for each microorganism in the spreadsheet). The approach taken here is to use Visual Basic macros to execute a loop that cycles through all 28 pathogens of concern. This loop is nested inside a Monte Carlo uncertainty analysis (Fig. 2). This cuts down on the amount of material in working memory by limiting the spreadsheet coding to a single copy of the exposure model. The Visual Basic code is readily viewable and can be edited by the advanced user. 2.3. Default Values in the Tool The tools serve as a knowledge source and repository, not just a model. Citations with author names and dates are marked next to the parameters in the spreadsheet, and full references are listed at bottom of each sheet. This provides users with the ability to evaluate the technical basis of each of the model parameters and update the model as new information becomes available. Numerous published researches on microbial fate and transport from biosolids were evaluated to identify both averages and ranges of factors [3, 4, 46], such as occurrence of pathogens in treated Class B biosolids, persistence of pathogens in the environment, and the probability of infection from exposure to a specified pathogen. The default inputs for the site-specific conditions do not correspond to a particular site but were developed after consideration of typical applications observed in Michigan [35]. The user has the flexibility to overwrite or revise these values. The default rainfall intensity and duration is determined by the rainfalls producing maximum infiltration and runoff depths [47]. Details on model inputs are provided in Table 1. A detailed explanation of the input parameters stored in the spreadsheet can be found in Galada et al., 2012 [35].
10 The Open Environmental Engineering Journal, 2013, Volume 6
Teng et al.
Table 1. Site-specific Input Parameters Parameter
Value
Unit
Time of start of rain after biosolids application
0
days
Temperature
83
Fahrenheit
Soil texture class
sandy_loam
-
Area of application site
625
Acre
Slope of the plot
4.00
%
Application method
Slinger
None
Biosolids application rate
2.57
dry tons biosoilds/acre
Water table depth
3
ft
Distance to well
100
Ft
Hydraulic gradient
0.04
-
Computational reporting threshold
1.00E-20
Lowest level of risk reported
Annual precipitation
18
inches
Maximum 30-minute intensity
NA
in./h
Does rainfall occur after land-incorporation of biosolids?
Yes
-
Rainfall rate
7.3
cm/h
Rainfall duration time
1
h
Total length of the field
5248.23
ft
Width of the field
5248.23
ft
3. RESULTS AND DISCUSSIONS Example results of the SMART Biosolids model are presented to demonstrate how the model enables comparisons of risk across pathogens, comparisons across the five exposure pathways, and the identification of key uncertainties. The model required 80 minutes on a personal computer to finish a 1000-iteration Monte Carlo uncertainty analysis. Fig. (3) and Table 2 shows the estimated risks (with uncertainties) for different organisms for exposure via five pathways. The risks produced across pathways are ranked, in descending order, as soil, surface water, vegetable ingestion, air, and groundwater. The soil pathway produced the highest risks. All the other four pathways produce nominal risks lower than 1×10⁻⁵. Looking at the upper bound of the risk estimates, the risk of minor illness produced by adenoviruses is 2.43×10⁻³. Although this is the estimation of cumulative risk over time for one single application event, it exceeds the 1 in 10,000 benchmark associated with reported annual microbial risk from U.S. drinking water supplies [35]. The risks of minor or major illness by the other five pathogens do not exceed the 1 in 10,000 benchmark. In this case the model uncertainties are large and noteworthy, which is due to the complexities of the exposure model and many uncertain input parameters, such as occurrence data and microbial decay rates [48]. Further research could be directed towards studying the occurrence and transport of adenoviruses, which have both a high nominal risk estimate and very substantial uncertainty. Similar plots can be prepared to contrast risks from
different pathogens across the remaining four exposure pathways [35]. The results were comparing to Eisenberg et al. (2006)’s study, which is the only study developed the framework for risks from groundwater consumption of all the published QMRA studies [33]. The estimated single-event risks by Eisenberg et al. (2006) (2×10⁻⁴ as nominal value and 4.2×10 3 as the 95th percentile of upper bound) are higher than estimates of risks in this paper (0 as nominal value and 7.98×10 10 as the 95th percentile of upper bound). One of the reasons is higher occurrence numbers (log-normal distribution with mean=1.13 and standard deviation=2.17, unit in PFU/g) were used in Eisenberg et al.’s research. The occurrence information in SMART Biosolids model (log-normal distribution with mean=0.105 and standard deviation=0.2, unit in PFU/g) is more recent [49]. Another important reason for the higher risk estimation from Eisenberg et al.’s study is they used the rotaviruses dose-response models for risk estimates of enteroviruses. It was reported that the exponential parameters ingestion dose-response parameters are 0.62 for rotavirus and 0.002 for enteroviruses [3, 50-52]. The discrepancy of the risk estimates is also due to the differences in the scenarios assumed in the two studies. The SMART Biosolids model does a more through estimation by considering the effects of rainfall event. The predicted effect of porous media for groundwater transport is much protective (longer transport distance in unsaturated soil and with consideration
A Spreadsheet-Based Site Specific Risk Assessment Tool for Land-Applied
The Open Environmental Engineering Journal, 2013 Volume 6 11
Fig. (3). Plotsshow cumulative risks over time for exposure through five pathways. Error bars represent the 5th and 95th percentiles. Risks for adenovirus, Cryptosporidium, enteroviruses, and Giardia lamblia are risks of minor illness cumulative over time; risks for Salmonella and Shigella are risks of major illness cumulative over time. Table 2. Risk Estimate for Residential Adult Associated with Five Exposure Pathways Air
Surface Water
Soil
Veg
Groundwater
Adenovirus
4.13×10⁻⁶ (7.26×10⁻⁷, 8.68×10⁻⁶)
4.84×10⁻⁶ (NA, 5.24×10⁻⁴)
2.36×10⁻² (3.26×10⁻¹⁴, 1)
1.38×10⁻⁶ (NA, 1.97×10⁻⁴)
NA (NA, 2.43×10⁻³)
Cryptosporidium
NA
9.31×10⁻⁸ (NA, 8.09×10⁻⁶)
4.52×10⁻⁴ (7.50×10⁻¹⁵, 4.10×10⁻²)
2.49×10⁻⁸ (NA, 3.55×10⁻⁶)
NA (NA, 7.87×10⁻⁶)
Enteroviruses
1.25×10⁻⁹ (2.50×10⁻¹⁰, 1.00×10⁻⁹)
1.52×10⁻¹⁰ (NA, 5.32×10⁻⁸)
4.64×10⁻⁸ (NA, 1.23×10⁻⁴)
2.32×10⁻¹¹ (NA, 2.06×10⁻⁸)
NA (NA, 8.19×10⁻¹⁰)
Giardia lamblia
NA
1.20×10⁻⁷ (NA, 1.29×10⁻⁵)
6.99×10⁻⁵ (NA, 3.25×10⁻²)
1.69×10⁻⁸ (NA, 3.49×10⁻⁶)
NA (NA, 1.16×10⁻⁷)
Salmonella spp.
5.67×10⁻¹³ (8.77×10⁻¹⁶, 2.31×10⁻¹⁰)
1.49×10⁻¹³ (NA, 5.07×10⁻¹⁰)
2.88×10⁻¹² (NA, 2.48×10⁻⁷)
6.56×10⁻¹⁵ (NA, 1.34×10⁻¹⁰)
NA (NA, 9.45×10⁻¹⁶)
Shigella spp.
2.37×10⁻⁸ (2.39×10⁻⁹, 8.69×10⁻⁸)
2.90×10⁻⁸ (NA, 2.19×10⁻⁶)
1.96×10⁻⁵ (NA, 8.67×10⁻³)
3.22×10⁻⁹ (NA, 1.06×10⁻⁶)
NA (NA, 1.14×10⁻⁷)
Note: Risks for adenovirus, Cryptosporidium, enteroviruses, and Giardia lamblia are risks of minor illness cumulative over time; risks for Salmonella and Shigella are risks of major illness cumulative over time. Values displayed are averaged values with 5-95th percentiles given in parentheses NA – not available as value was below reporting threshold of 10-20
of horizontal transport to well) than the scenario assumed by Eisenberg et al. (2006). Like many risk models, the SMART Biosolids model requires numerous assumptions. Several key assumptions for the groundwater pathway include the use of homogeneous media transport models and the use of a fixed desorption fraction to describe the release of pathogens from the solid phase to the aqueous phase. More details of model assumptions are provided in the manual [35]. In general the approach has been to be conservative, that is, to err on the side of overestimating risk. Nevertheless, the impact of different
model structural assumptions is not always clear, and model risk estimates may not be health protective in all cases. The default data in the spreadsheet model came from various sources and may not be universally applicable. The model is able to quantify risks for six pathogens: Giadia, Cryptosporidium, Salmonella, Shigella, enterovirus, and adenovirus. The occurrence of other pathogens in biosolids was either too low to be reliably quantified or lacking altogether. At the same time, the user should always be mindful that there are several inherent limitations of spreadsheets [53]: Spreadsheet tools are easy to modify, but leave no trail to
12 The Open Environmental Engineering Journal, 2013, Volume 6
identify changes; formulas are expressed in column and row labels and need to be located to understand; simple spreadsheet errors can compromise parts of the spreadsheet model. In order to avoid these problems, there is a “restore” option that can reset the data to default inputs.
Teng et al. [13]
[14]
4. CONCLUSIONS This paper describes a tool, the SMART Biosolids model, which links quantitative microbial risk assessment with microbial fate and transport modeling. The model combines spreadsheets with add-in visual basic macros in a rational and supportable manner. The spreadsheet format provides a flexible and familiar interface and serves as an archive for parameters with associated references. Add-in macros are used to perform the many repeated computations required to perform Monte Carlo uncertainty analysis for multiple pathogens. The tool successfully integrates available knowledge and in the process identifies gaps in existing knowledge for which future research is warranted. Thus, quantified occurrence levels of additional pathogens can extend the model and allow for risk estimates to be obtained for a broader set of pathogens.
[15]
[16]
[17] [18]
[19] [20]
REFERENCES [1]
[2] [3]
[4]
[5] [6]
[7]
[8]
[9] [10]
[11] [12]
U.S. EPA, “Land Application of Sewage Sludge: A Guide for Land Appliers on the Requirements of the Federal Standard for the Use or Disposal of Sewage Sludge”, Washington, D.C. 40 CFR Part 503; EPA/831-B-93-002b, 1994. P. Gale, “Land application of treated sewage sludge: quantifying pathogen risks from consumption of crops”, J. Appl. Microbiol., vol. 98, pp. 380-396, 2005. J. P. Brooks, B. D. Tanner, C. P. Gerba, C. N. Haas, and I. L. Pepper, “Estimation of Bioaerosol risk of Infection to Residents Adjacent to a Land Applied Biosolids Site Using an Empirically Derived Transport Model”, J. Appl. Microbiol., vol 98, pp. 397-405, 2005. J. P. Brooks, B. D. Tanner, K. L. Josephson, C. P. Gerba, C. N. Haas, and I. L. Pepper, “A National Study on the Residential Impact of Biological Aerosols from the Land Application of Biosolids”, J. Appl. Microbiol., vol. 99, pp. 310-322, 2005. J. P. S. Sidhu, and S. G. Toze, “Human Pathogen and Their Indicators in Biosolids: A Literature Review”, Environ. Int., vol. 35, no.1, pp. 187-201, 2009. J. N. Eisenberg, K. Moore, J. A. Soller, D. Eisenberg, and J. M. Colford Jr., “Microbial Risk Assessment Framework for Exposure to Amended Sludge Projects”, Environ. Health. Perspect., vol. 116, no. 6, pp. 1-7, 2008. J. P. Brooks, M. R. McLaughlin, C. P. Gerba, and I. L. Pepper, “Land Application of Manure and Class B Biosolids: An Occupational and Public Quantitative Microbial Risk Assessment”, J. Environ. Qual., vol. 41, no. 6, pp. 2009-2023, 2012. E. Viau, K. Bibby, T. Paez-Rubio, and J. Peccia, “Toward a Consensus View on the Infectious Risks Associated with Land Application of Sewage Sludge”, Environ. Sci. Technol., vol. 45, no. 13, pp. 5459–5469, 2011. D. J. Vose, “The application of quantitative risk assessment to microbial food safety”, J. Food. Prot., vol. 61, no. 5, pp. 640-648, 1998. L. Kopylev, C. Chen, and P. White, “Towards quantitative uncertainty assessment for cancer risks: Central estimates and probability distributions of risk in dose-response modeling”, Regul. Toxicol. Pharmacol., vol. 49, no. 3, pp 203-207, December 2007. N. S. Arunraj, and J. Maiti, “A methodology for overall consequence modeling in chemical industry”, J. Hazard. Mater., vol. 169, no. 1-3, pp. 556-574, 2009. Y. S. Choun, and A. S. Elnashai, “A simplified framework for probabilistic earthquake loss estimation”, Probab. Eng. Mech., vol. 25, no. 4, pp. 355-364, 2010.
[21]
[22] [23]
[24] [25]
[26]
[27] [28] [29]
[30]
[31]
[32]
M. Donald, K. Mengersen, S. Toze, J. P. Sidhu, and A. Cook, “Incorporating parameter uncertainty into Quantitative Microbial Risk Assessment (QMRA)”, J. Water. Health., vol. 9, no. 1, pp. 10-26, March 2011. W. A. Harman, C. J. Allan, and R. D. Forsythe, “Assessment of potential groundwater contamination sources in a wellhead protection area”, J. Environ. Manag., vol. 62, no. 3, pp. 271-282, July 2001. S. Brown, L. Saito, C. Knightes, and M. Gustin, “Calibration and evaluation of a mercury model for a western stream and constructed wetland”, Water. Air. Soil. Pollut., vol. 182, no. 1-4, pp. 275-290, June 2007. K. L. Dixon, P. L. Lee, and G. P. Flach, “A graded approach to flow and transport modeling to support decommissioning activities at the Savannah River Site”, Health. Phys., vol. 94, no. 5, pp. S56S61, May 2008. O. Castren, “Implications of a two-stage clonal expansion model to indoor radon risk assessment”, Health. Phys., vol. 76, no. 4, pp. 393-397, April 1999. E. van Wijngaarden, and I. Hertz-Picciotto, “A simple approach to performing quantitative cancer risk assessment using published results from occupational epidemiology studies”, Sci. Total. Environ., vol. 332, no. 1-3, pp. 81-87, Octoboer 2004. R. J. Pine, “Transactions of the Institution of Mining and Metallurgy, Section A: Mining Industry”, Risk. Anal. Des. Appl. Mining Geomech., vol. 101, pp. A149-A158, 1992. H. J. R. Lenders, R. Leuven, P. H. Nienhuis, R. J. W. de nooij, and S. A. M. Van Rooij, “BIO-SAFE: a method for evaluation of biodiversity values on the basis of political and legal criteria”, Landsc. Urban Plan, vol. 55, no. 2, pp. 121-137, July 2001. A. M. Shariff, R. Rusli, C. T. Leong, V. R. Radhakrishnan, and A. Buang, “Inherent safety tool for explosion consequences study”, J. Loss Prev. Process. Ind., vol. 19, no. 5, pp. 409-418, September 2006. T. Ross, and J. Sumner, “A simple, spreadsheet-based, food safety risk assessment tool”, Int. J. Food. Microbiol., vol. 77, no. 1-2, pp. 39-53, 2002. M. Vandeven, T. Whitaker, and A. Slate, “Statistical approach for risk assessment of aflatoxin sampling plan used by manufacturers for raw shelled peanuts”, J. AOAC. Int., vol. 85, no. 4, pp. 925-932, July-August 2002. S. E. Hutter, and U. Kihm, “Assessment of exposure to bovine spongiform encephalopathy in a hypothetical country”, Rev. Off. Int. Epizoot., vol. 29, no. 3, pp. 459-471, 2010. J. Carrasco, and S. Y. Chang, “Random Monte Carlo simulation analysis and risk assessment for ammonia concentrations in wastewater effluent disposal”, Stoch. Environ. Res. Risk. Assess., vol. 19, no. 2, pp. 134-145, 2005. P. F. Teunis, F. Kasuga, A. Fazil, I. D. Ogden, O. Rotariu, and N. J. Strachan, “Dose-response modeling of Salmonella using outbreak data”, Int. J. Food. Microbiol., vol. 144, no. 2, pp. 243-249, December 2010. M. J. Nauta, “Microbiological risk assessment models for partitioning and mixing during food handling”, Int. J. Food. Microbiol., vol. 100, no. 1-3, pp. 311-322, 2005. J. Sumner, and T. Ross, “A semi-quantitative seafood safety risk assessment”, Int. J. Food. Microbiol., vol. 77, no. 1-2, pp. 55-59, 2002. H. S. Park, and C. San Juan, “A method for assessing leaching potential for petroleum hydrocarbons release sites: Multiphase and multisubstance equilibrium partitioning”, Soil. Sediment. Contam., vol. 9, no. 6, pp. 611-632, 2000. G. G. Rucker, Vadose Zone Contaminant Migration Model - MutiLayered Software© (VZCOMML) Calculation Note and Documentation. Washington Savannah River Company, Aiken, SC 29808, 2007. C. D. Knightes, “Development and test application of a screeninglevel mercury fate model and tool for evaluating wildlife exposure risk for surface waters with mercury-contaminated sediments (SERAFM)”, Environ. Model. Softw., vol. 23, no. 4, pp. 495-510, 2008. J. M. Colford, D.M. Eisenberg, and J.N.S. Eisenberg. A dynamic model to assess microbial health risks associated with beneficial uses of biosolids―Phase 1. Water Environment Research Foundation Report 98-REM-1 IWA Publishing, London, U.K, 2003.
A Spreadsheet-Based Site Specific Risk Assessment Tool for Land-Applied [33]
[34] [35]
[36] [37] [38]
[39] [40] [41]
[42]
J. N. Eisenberg, “Application of a Dynamic Model to Assess Microbial Health Risks Associated with Beneficial Uses of Biosolids”, Water Environ. Res. Found., vol. 98-REM-1a, pp. 1-124, 2006. NRC (National Research Council). Biosolids Applied to Land: Advancing Standards and Practices. The National Academies Press: Washington, D.C 2002. H. Galada, P. L. Gurian, A. Joe, A. Kumar, B. Olson, M. S. Olson, E. Richter, J. Teng, H. Zhang, I. Xagoraraki, E. Casman, C. P. Gerba and I. Pepper, Site Specific Risk Assessment Tools for Land Applied Biosolids, IWA Publishing, Water Environment Research Foundation, SRSK3R08, 2012. G. A. Sehmel, “Particle Resuspension: A Review”, Environ. Int., vol. 4, pp. 107-127, 1980. J. P. Brooks, and C. P. Gerba, “Biological Aerosol Emission Fate and Transport from Municipal and Animal Wastes”, J. Residuals Sci. Technol., vol. 1, pp. 16-28, 2004. S. Y. Low, T. Paez-Rubio, C. Baertsch, M. Kucharski, and J. Peccia, “Off-Site Exposure to Respirable Aerosols Produced during the Disk-Incorporation of Class B Biosolids”, J. Environ. Eng., vol. 133, no. 10, pp. 987-994, 2007. D. Swartzendruber, “Infiltration of constant-flux rainfall into soil as analyzed by the approach of Green and Ampt”, Soil. Sci., vol. 117, pp. 272-281, 1974. G. D. Salvucci, and D. Entekhabi, “Explicit expressions for GreenAmpt (Delta function diffusivity) infiltration rate and cumulative storage”, Water. Resour. Res., vol. 30, pp. 2661-2663, 1994. H. Zhang, B. Olson, M. S. Olson, P. L. Gurian, C. Harte, J. Teng. “Extending the Risk Assessment Framework for Pathogens in Biosolids”, In: WEF Residuals and Biosolids Conference, Portland: OR, 2009. P. B. Bedient, H. S. Rifai, C. J. Newell, Ground water contamination-Transport and remedition. Prentice Hall, Inc: Upeer Saddle River, NJ, 1997.
Received: January 26, 2013
The Open Environmental Engineering Journal, 2013 Volume 6 13 [43]
[44] [45] [46]
[47]
[48] [49]
[50] [51]
[52] [53]
Revised: May 08, 2013
B. R. Faulkner, W. G. Lyon, F. A. Khan, S. Chattopadhyay, Predicting attenuation of viruses during percolation in soils. Cincinnati, OH 45268, National Risk Management Research Laboratory, Office of Research and Development, U.S. Environmental Protection Agency, 2002. U.S. EPA, “Exposure Factors Handbook: Volume I-General Factors”, EPA/600/P-95/002Fa, 1997. RUSLE, “Revised Universal Soil Loss Equation (RUSLE)”, USDA-Agricultural Research Service, 2008. A. S. Chetochine, M. L. Brusseau, C. P. Gerba, and I. L. Pepper, “ Leaching of Phage from Class B Biosolids and Potential Transport through Soil”, Appl. Environ. Microbiol., vol. 72, no. 1, pp. 665– 671, 2006. J. Teng, A. Kumar, H. Zhang, M. S. Olson, and P. L. Gurian, “Determination of Critical Rainfall Events for Quantitative Microbial Risk Assessment of Land-Applied Soil Amendments”, J. Hydrol. Eng., vol. 17, no. 3, pp. 437, 2012. J. Teng, “Microbial Risk Assessment Modeling for Exposure to Land-Applied Class B Biosolids”, Doctoral Dissertation, Drexel University, Philadelphia, PA, U. S., 2012. L. Pepper, J. P. Brooks, R. G. Sinclair, P. L. Gurian, and C. P. Gerba, “Pathogens and Indicators in United States Class B Biosolids: National and Historic Distributions”, J. Environ. Qual., vol. 39, no. 6, pp. 2185-2190, 2010. S. Regli, J. B. Rose, C. N. Haas, and C. P. Gerba, “Modeling the risk from Giardia and viruses in drinking water”, J. Am. Water. Works. Assoc., vol. 83, pp. 76-84, 1991. B. D. Tanner, J. P. Brooks, C. P. Gerba, C. N. Haas, K. L. Josephson, and I. L. Pepper, “Estimated occupational risk from bioaerosols generated during land application of class B biosolids”. J. Environ. Qual., vol. 37, pp. 2311-2321, 2008. C. N. Haas, J. B. Rose, and C. P. Gerba, Quantitative Microbial Risk Assessment, John Wiley & Sons. Inc: New York, NY 1999. R. Pitblado, "Quality and Offshore Quantitative Risk Assessment”, J. Loss Prev. Process Ind., vol. 7, no. 4, pp. 360-369, 1994. Accepted: May 18, 2013
© Teng et al.; Licensee Bentham Open. This is an open access article licensed under the terms of the Creative Commons Attribution Non-Commercial License (http://creativecommons.org/licenses/by-nc/3.0/g) which permits unrestricted, non-commercial use, distribution and reproduction in any medium, provided the work is properly cited.