Jun 15, 2000 - Treating the ligand as an ideal gas [7] allows us to find an estimate of the ligand binding energy. gL. kBT ln @q p 2ÏmTNFkBT h2 r. 3. 2 H KTNF.
A statistical mechanics model for receptor clustering Chinlin Guo & Herbert Levinecorresponding
author
Dept. of Physics, University of California San Diego, La Jolla, CA 92093-0319 June 15, 2000 Abstract. We introduce and study a simple lattice statistical mechanics model for the clustering of tumor necrosis factor receptor I (TNFR1). Our model explains clustering under over-expression of the cytoplasmic signal transducer as well as the clustering induced via extracellular ligand binding; also we explain why the loss of transducer leads to a rapid breakup of the clusters. The basic mechanism at work is a first-order (cooperative) phase transition caused by the multimeric binding capability of the receptor-transducer complex. Using cooperativity of this type, the cells are found to have an enhanced sensitivity and robustness. In general, our method can be applied to other receptor-clustering related signaling system. Keywords: signal transduction, receptor clustering, statistical mechanics Abbreviations: TNFR1 – Tumor Necrosis Factor Receptor I; TNFα – Tumor Necrosis Factor; SODD – Silencer of Death Domain; TRADD – TNF Receptor Associated Death Domain; UV – Ultra-Violate; TRAF2 – TNFR Associated Factor 2; FADD – Fas Associated Death Domain; RIP – Receptor Interacting Protein; JNK – c-Jun N terminal Kinase; NFκB – Nuclear Factor-κB
1. Introduction Cell growth, differentiation, migration, and apoptosis are regulated in part by extracellular polypeptide cytokines [1]. Since most peptides are unable to pass through the hydrophobic cell membrane, executing the biological functions requires specific surface receptors to recognize the peptides and thereby transmit the signals. In many cases, it has been observed that clustering of receptors is the essential part of the mechanism whereby proper intracellular signals can be generated. This leads to two fundamental questions: (1) why is the receptor clustering required for signal transduction, and (2) how is the clustering regulated under physiological conditions (i.e., the dose response curve)? Here, via simple modeling, we investigate the second question for one particular example, that of tumor necrosis factor receptor I (TNFR1) signaling. TNFR1 regulates cell death and survival through its association with a cytoplasmic transducer, “TNF receptor associated death domain” (TRADD) and via the clustering of TRADD-TNFR1 complexes [2]. Specifically, the clustering is accomplished by the multiple self-binding motifs on TRADD (different from its receptor binding site), figure.1(a), [3]; thus over-expression of TRADD can lead to spontaneous clustering and constitutive signaling [4, 5]. To prevent this, TNFR1-TRADD association is normally blocked by a © 2000 Kluwer Academic Publishers. Printed in the Netherlands.
paper.tex; 15/06/2000; 18:37; p.1
2
C. Guo & H. Levine
cytoplasmic inhibitor, “silencer of death domain” (SODD) which was found to bind to the TNFR1-TRADD binding site [5]. Clustering is restored in the presence of a trimeric extracellular ligand, tumor necrosis factor α (TNF α ) which is capable of oligomerizing three receptors regardless of their cytoplasmic condition [2, 5]. From the biochemical prospective, it is not totally understood how trimerizing TNFR1 can restore the clustering. This behavior clearly requires enhanced TRADD recruitment to liganded receptors. One molecular hypothesis is that trimerizing receptors brings them into close proximity and thus “squeezes” out the bulky inhibitors (molecular weight of SODD 62KD, TRADD 32KD)[5]. This, however, is inconsistent with the observed time course of SODD-TNFR1 association during ligand treatment and the low TNF-TNFR1 dissociation rate. Normally, TRADD is recruited to (and SODD is released from) receptors after 5 min of ligand treatment. The recruited TRADD is then phosphorylated by activated downstream enzymes and released from TNFR1, followed by an SODD-TNFR1 re-association; this occurs about 10 min after the treatment [5]. Now, the experimental data suggested that TNFR1-TNFα has a binding lifetime longer than hours [6]. Thus, if trimerizing receptors could block the inhibitor binding, there would be no inhibitor-receptor re-association in 10 min since most receptors would still be di/trimeric. There is, however, a biophysical property of this receptor system that has not been addressed. The system has an intrinsic cooperativity arising from TRADD self-multimerization capacity. Then, if applying ligand can properly modulate the effective binding between nearest-neighbor TNFR1-TRADD complexes, a first-order phase transition can occur with the surface molecules spontaneously segregated into dilute and dense phases [7]. To see if this idea works, we study the statistical mechanics of TNFR1 clustering, based on a simple lattice model that incorporates the most relevant parameters. Our results show that (a) simple modeling does predict TNFR1 clustering in a relevant parameter range, and (b) using cooperativity of this type, the cells can enhance both their sensitivity and robustness. Finally, to examine the validity of this statistical mechanics approach, we estimate the time scale of system nucleation rate; our finding agrees well with the experimental data.
2. The Model 2.1. Basic assumptions To simplify the model, we have made several assumptions. Our goal is to construct a system Hamiltonian that can be easily simulated and analyzed. Here, we are interested in the short-term behavior (the onset of clustering),
paper.tex; 15/06/2000; 18:37; p.2
3
A statistical mechanics model for receptor clustering
�
�
(a)
�
� �
�
TNFR1
�
(b)
TNFα
�
�
�
�
�
�
�
�
�
�
�
�
�
�
�
�
�
��
��
�
�
�
�
�
�
�
�
�
�
�
�
�
�
�
�
�
�
��
��
�
�
�
�
�
�
�
�
�
�
�
�
�
�
�
�
�
�
�
�
�
�
SODD death domain
TRADD
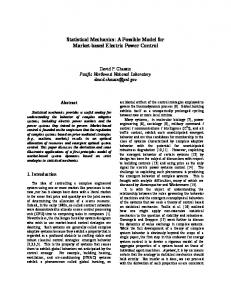
Figure 1. (a) The cytoplasmic domain of receptor (TNFR1) can associate with either the inhibitor (SODD) or transducer (TRADD). TRADD has multiple motifs for self association; this allows the clustering of TNFR1-TRADD complex, whereas the binding of SODD prevents clustering. (b) If we assume that on average each recruited TRADD can associate with 4 nearest neighbors, TNF treatment can enhance the cooperativity from 4 to 6.
and the long-term consequences of clustering (such as downstream signaling, receptor internalization, adaptation/desensitization) will not be included. Thus our first assumption is that the system can reach a “quasi-equilibrium” state via rapid receptor diffusion. This requires the predicted nucleation rate (for the onset of clustering) to be within a reasonable time scale. Second, we assume that the binding strength between TRADD-TNFR1 complex is much weaker than that between TNFR1 and TNF α ; given the long TNFR1-TNFα binding lifetime, this should be a reasonable approach. Then, in the time scale of interest, the “effective molecules” that allow for clustering will be either solitary TNFR1 monomers or liganded di/trimers. Third, given the TRADD multiple self-binding capacity, the number of effective nearest neighbors that a solitary TNFR1 can bind to will be different from that of a liganded TNFR1. For instance, if we assume that every TRADD can self-associate with four nearest-neighbor TRADD, when the receptors are liganded to di/trimer, each TNFR1-TRADD complex unit will be able to bind to 6 similar ones, figure 1(b). Then, the leading effect of ligand binding is to change the number of effective nearest neighbors and hence the system cooperativity. This could of course happen without TNF α ; however, the entropy cost of co-localizing two complexes would be too high without the offsetting ligand binding energy. Fourth and finally, we treat the cell surface as a lattice with a spacing a0 � 1nm; this is the closest that neighboring surface molecule complex (solitary or liganded TNFR1) can get to each other. Then, each lattice site i can be occupied by either zero or one effective molecule, denoted as n i 0 or 1. Also, we define a state label ti for the occupying molecule (i.e., t i � Rk Ll Sm Tn with k, l, m, n as the content number of TNFR1 (R), TNF α (L), SODD (S) & TRADD (T )). Here, we ignore the obvious fact that dimers and trimers are bigger than monomers; this approximation overvalues the entropy of the multimeric state, but certainly can be subsumed as a change in the effective
paper.tex; 15/06/2000; 18:37; p.3
4
C. Guo & H. Levine
binding energy. Also, we treat separately the cases of clustering caused by “over-expression" of TRADD, or caused by ligand binding. 2.2. The Hamiltonian Next, we construct the system Hamiltonian. Our first step is to define a linear term H0 ��� n � t � � ∑ µ � ti ni � � ∑ µ � � Rk Ll Sm Tn i ni (1) i
i
with µ � ti as the chemical potential for the state of the occupied site. Explicitly, in the TNFα-free case, we have µ � R1 L0 S0 T0 µ � R1 L0 S1 T0 µ � R1 L0 S0 T1
� µR � µR � µS � gs � � µR � µT � gT ���
a single free TNFR1 a single TNFR1-SODD complex a single TNFR1-TRADD complex
with µR � µS � µT as the molecule chemical potential and � g s � � gT as the binding energies. In the TNFα -present case, on the other hand, the possible states includes k � � 1 � 2 � 3 � , corresponding to a solitary, dimeric, or trimeric TNFR1. Obviously, we need � m � n �� k, l � � 0 � 1 � , and k � 1 if l 1 (the liganded case). Overall, we have µ � Rk Ll Sm Tn
kµR � l � µL � kgL �
m � µ S � gS �
n � µT �
gT �
f � n gE (2)
with µL as the ligand chemical potential, and � g L , � gE as the TNFR1-TNFα, TRADD-TRADD binding energies. Here f � 1 � n � 2 n � 1, f � 3 3 (see figure 1) corresponds to the number of TRADD self-bindings allowed inside a TNFR1 oligomer. Next, we add an interaction term into the Hamiltonian. This takes the general form 1 (3) Hint ��� n � t � � Ji j a � ti � t j ni n j 2∑ ij with Ji j 1 if i � j are nearest-neighbors and 0 otherwise. Here a � t i � t j is a “state”-dependent function indicating the nearest-neighbor interaction. Since the cooperativity arises from the capacity of TRADD self-multimerization, the simplest form of a � ti � t j is the product a � ti � t j gE θ � ti θ � t j . In the 1 if the site has a TNFR1-TRADD comTNF free case, we have θ � ti plex. In the TNF present case, however, we are interested in the molecular concentration (i.e., [TRADD], [SODD]) range where spontaneous clustering does not occur. This implies that the molecules responsible for clustering are liganded TNFR1 oligomers with at least two TRADD associated. Thus θ � ti Rk Ll Sm Tn 1 if n � 2 and 0 otherwise.
paper.tex; 15/06/2000; 18:37; p.4
5
A statistical mechanics model for receptor clustering
3. Simulations To see if our model can generate clustering, we perform a Metropolis Monte Carlo simulation. First, in the absence of TNF, we assume that each TNFR1TRADD complex can bind to four similar ones (i.e., the system cooperativity D 4 as illustrated in figure 1(a)), and perform simulations on an 100 � 100 square lattice with periodic boundary condition. The jumping probability for a surface molecule to move to another lattice site and the probability for surface molecules to react and change their type/states are determined by the Hamiltonian and obey detailed balance [7]. In our simulation, clusters are not allowed to move collectively, which might not be the case in reality. In the ligand-absence case, the ensemble for a TNFR1 occupying a single lattice i will be eβµR e �
� �
β µR �
1 � e β � µS � 1 β
gS �
ln � 1 � eβ ! µS "
� �
gS #
e β � µT �
�%$'& �
1�
gT � gE ∑ j Ji j n j θ � t j �����
�)(
e β � µT � gT � eβgE ∑ j Ji j n j θ � t j ��, 1 � eβ � µS � gS �+*
where we have separated the subensemble not effective for clustering into �.-/-/- � . Obviously, aside from the “shifted” µ R (which can be fixed by the given receptor density anyway), the relevant parameters that switch TNFR1 between non/effective states are g E and the ratio B eβ � µT � gT �10 � 1 � eβ � µS � gS � � . Since � gE is the binding energy between each TRADD self-binding motif, as a simple estimate, we might take g E � 4kB T , roughly the energy of a single hydrogen bond at room temperature. The crucial B factor is related to the molecular concentrations and dissociation constants via 2
TNFR1 � m �43 2
TNFR1 � m �43
2
eq eq
KdTRADD TNFR1 � m � 5 TRADD3
� TRADD� eq
2
� SODD� eq
KdSODD TNFR1 � m �65 SODD3
eq
eq
Here the notation “TNFR1 � m � ” means TNFR1 molecules distributed on the membrane, and the brackets [ -/-/- ]eq indicates the equilibrium concentration of the respective molecule. In detail, we have e β � µS � B
gS �
1 � SODD�)7 KdSODD 8:9 �
� TRADD� 0
1�
KdTRADD � SODD� 0 K SODD d
e β � µT �
gT �
� TRADD�)7
KdTRADD 8;9
1
(4)
Obviously a larger B factor implies a higher transducer to inhibitor concentration ratio. From figure 2, we immediately see that for a given receptor density, tuning the B factor moves the system from a non-clustering to a
paper.tex; 15/06/2000; 18:37; p.5
6
C. Guo & H. Levine
A
initial, =0.05, B=0.1
final, =0.05, B=0.1
B
initial, =0.05, B=1.0
final, =0.05, B=1.0
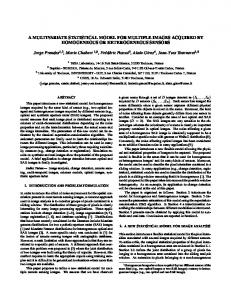
Figure 2. The presence of TNFR1-TRADD clustering at (A) high inhibitor or (B) transducer concentrations in the absence of TNFα . Here < n = is the given receptor density, and TRADDA B KdTRADD are SODDA B KdSODD ? D 108 steps). The open
B >@1? C
fixed quantities during the Metropolis Monte Carlo simulation
(4 diamond represent free TNFR1 or TNFR1 associated with SODD, and a filled square indicates a TNFR1-TRADD complex.
clustering phase. Thus our model can predict spontaneous clustering as seen in experiment [4, 5]. Next, we consider the ligand-presence case. To perform the simulations, from eqn.(2), we need two additional parameters, i.e., the ligand chemical potential µL and binding energy � gL . Using the procedure introduced in our previous work [7], we can connect these parameters with real experimental variables through the formula
�
2
TNFR1 � m �E3 e β � µL � gL �
2
eq
� TNFα �
KdTNF TNFα 5 TNFR1 � m �E3
1 � TNF� 7 KdTNF 8 9
eq
(5)
paper.tex; 15/06/2000; 18:37; p.6
7
A statistical mechanics model for receptor clustering
C
−2
TNF
=10 }
TNF
=10 }
initial, =0.05, B=0.1
final, {[TNFα]/Kd
D initial, =0.05, B=10−6
final, {[TNFα]/Kd
−2
Figure 3. The presence of TNFR1-TRADD clustering at (C) moderate and (C) low B conditions with the presence of TNFα . Here the receptor density < n = , ligand concentration [TNFα ] and the B factor are fixed quantities. The open diamond represent unliganded free TNFR1 or TNFR1-SODD complex, a filled square indicates a TNFR1-TRADD complex, the filled/open circles indicate liganded TNFR1 with/out TRADD associated, and the filled/open triangles indicate TNFR1 trimer with/out TRADD associated. Note that (C) has the same cytoplasmic parameters as (A), but clustering can occur with the presence of ligand.
Treating the ligand as an ideal gas [7] allows us to find an estimate of the ligand binding energy gL
kB T ln
(GF
2πmTNF kB T H h2
3 2
0
KdTNF *
�
60kB T �
(6)
with mTNF as the mass of TNFα [7]. This estimate is far larger than the order of gE and thus supports our assumption that binding between TNFR1TRADD complex is much weaker than that between TNFR1 & TNF α . In general, we can take 15 I gL 0 kB T I 60, i.e. 3 to 10 times the value of gE ; this entire range yields similar numerical results.
paper.tex; 15/06/2000; 18:37; p.7
8
C. Guo & H. Levine
Then, we perform the simulation on a 100 � 100 triangular lattice, assuming the cooperativity D 6 caused by ligand binding (figure 1(b)). In the simulation, the TNFα concentration is a fixed quantity (consistent with the experimental procedure [5]) and the monomeric TNFR1s are allowed to update their un/liganded states according to the TNF α binding energy and concentration, whereas the liganded TNFR1 oligomers are not allowed to dissociate; given the long binding lifetime, this is a reasonable constraint. Thus most TNFR1 will be driven into oligomeric structures after long term simulation. In the presence of ligand, we found that the same parameters that previously caused no clustering (figure 2(A)) now can induce clustering (figure 3C). At the very low [TRADD] (small B factor), however, TNF α treatment is not sufficient as the SODD binding dominates (figure 3D). Thus, if the downstream components of the signaling cascade are activated by clustering, one can imagine a “dynamical” process progressing from figure 3C to figure 3D, i.e., the TNFR1-associated TRADD are phosphorylated and dissociated, followed by a SODD re-association and break-up of the existent of clusters, while most TNFR1s remain trimeric. This is consistent with the experimental result [5] and confirms that our model can capture the basic physics of TNFR1 clustering. To have a more quantitative view, we next utilize a mean-field approach to analyze the conditions under which clustering can take place. 4. Analytical Approach 4.1. Mean-field approach The partition function for this model equals Z
J ∑
n i K ti L
e9
J J β M H0 � n K t LN�%� Hint � n K t L���O
(7)
where ∑ J ni ;ti L means ensemble summation over the different configurations as detailed earlier. To proceed, we introduce an auxiliary Gaussian field [7, 8] to decouple the quadratic term in Hint into a linear term such that we can sum over the single site ensembles independently. This yields C P D φe 9
Z
β 2 gE
J ∑i j Ji j φi φ j � ∑i Ψi � φ L��
(8)
Here, D φ ∏i dφi with φ ranged from � ∞ to � ∞, and C is a normalization constant which does not affect the thermodynamic properties of the partition function. For the case of no ligand present, we have Ψi ��� φ �
2
ln 1 � eβµR � 1 � eβ � µS �
gS � �
e β � µT �
gT �
eβgE Ji j φ j 3
(9)
paper.tex; 15/06/2000; 18:37; p.8
9
A statistical mechanics model for receptor clustering
Defining the effective chemical potential for the order parameter φ via eβµφ
1�
e β � µR � µT � gT � eβµR Q 1 � eβ � µS �
(10)
gS �1R
we can simplify Ψi ��� φ � S� ln � 1 � eβ � µφ � gE ∑ j Ji j φ j � � . We now approximate the partition function by assuming that the dominant contribution arises near a spatially-uniform saddle-point. This leads to the self-consistent mean-field equation eβ � µφ � gE DφU � φT (11) 1 � eβ � µφ � gE DφU � Here, D ∑ j Ji j is the number of nearest neighbors which we take as 4 in this TNFα-free case. Similarly, one can find an expression for the mean receptor density in terms of the derivative of the effective free energy with respect to the chemical potential µR ,V nW
x � 1 � BeβgE DφU 1 � x � 1 � BeβgE Dφ U
(12)
where x eβµR � 1 � eβ � µS � gS � � and B is defined in eqn.(4). Then, for a fixed receptor density, the two unknowns φ T and x can be determined by solving eqn.(11), (12) Next, we proceed to the model with TNF present. Again, we introduce a field φ to decouple the quadratic term. Working this out explicitly, the partition function becomes Ψi ��� φ �
3
ln ( 1 �
∑ αk xk �
kX 1
3
∑ γk xk eβg
kX 2
E
∑i j Ji j φ j *
(13)
where the coefficients are given by α k � kB � 1 � δk0 � eβ M µL � � k 1 � gL O , γ2 9 B2 eβ � µL � 2gL � gE � , γ3 B2 eβ � µL � 3gL � gE � � 3 � Be2βgE � , and x and B are defined previously. Just as the TNFα free case, we introduce a φ chemical potential, here via eβµφ ∑3k X 2 γk xk 0 � 1 � ∑3k X 1 αk xk � . Up to a constant, we find that H ��� φ � is reduced to the same expression as that given above for the ligand-free case. So, the mean-field equations remain the same, and only the parameter µφ gets redefined. And, because of the nature of the liganded receptor, the coordination neighbor D is now set to 6. 4.2. Phase diagrams Using this mean-field approach, we can find the phase diagram by solving a pair of coupled equations for two unknowns; the order parameter φ T and x, the variables simply related to the receptor density and chemical potential.
paper.tex; 15/06/2000; 18:37; p.9
10
C. Guo & H. Levine
φs−
φ
−2
10
(u)
=0.999979
−3
exp[µφ/kBT]
10
φb+
φb−
−4
10
=0.1 −5
10
TRADD
[TRADD]/Kd
SODD
1+[SODD]/Kd
= 0.05
φs+
−6
10
0.0
0.2
0.4
φ
0.6
∗
0.8
1.0
Figure 4. The mean-field solution for eqn.(11) (the solid curve) and eqn.(12) (the dashed curve). Here the density is given by < n =Y> 0 Z 1. The uniform solution given by the intersection of the two curves lies above the binodal point φb [ . Thus the system is metastable and can segregate into a dilute phase and a dense phase (the long-dashed curve) corresponding to < n =\> 0 Z 999979. Note that the solid curve ends at the point φ ] u^ which satisfies u `1a BeβgE Dφ _ 1 b φ ] u^:c 1de> 1 (and hence x > ∞, as one can see from eqn.(11)).
V
Figure 4 shows how we use graphical intersection to determine φ T and µφ . For the case at hand, we have chosen n W 0 - 1, βg E 4, and D 4. Notice that we have a van der Waals loop in the solution diagram of eqn.(11). In detail, this means that there exist two spinodal points φ s f at which the solution branch determining the chemical potential µ φ become unstable. There also exist two binodal points, labeled φ b f which correspond to places at which the different solutions for the chemical potential (the two possible phases of the system) have equal free energy. From the saddle-point equa� 0 0 0 0 tions, we find φs f � 1 2 hgji � 1 4 � 1 βgE D and φb f � 1 2 Gg ξ with 0 ξ 2 tanh � gE Dξ 2� . This implies that the van der Waals loop exists only if gE � gmin 4kB T 0 D, i.e., there is a minimal TRADD self-binding strength E that allows for clustering.
paper.tex; 15/06/2000; 18:37; p.10
11
A statistical mechanics model for receptor clustering
0
(a)
10
ligand−independent TNFR1 clustering
−1
min , x [a0nm]
−2
10
−2
10
TNF
[TNFα]/Kd
−3
10
TNFα−induced TNFR1 clustering
=1
no clustering
−4
10
−5
10
−4
−3
10
−2
−1
0
10 10 10 TRADD SODD )/(1+[SODD]/Kd ) ([TRADD]/Kd
10
1
10
(b) 0
, x[a0nm]
−2
10
TNFα−induced
−1
10
TNFR1 clustering −2
no clustering
10
−3
10
TRADD
[TRADD]/Kd
no clustering
SODD
1+[SODD]/Kd
=10
−2
−4
10
10
−80
−60
10
−40
10
−20
10
0
10 10 TNF [TNFα]/Kd
20
10
40
10
60
10
80
Figure 5. (a): The dependence of the (dimensionless) minimal receptor density < n = min on transducer, inhibitor concentrations (determined by the B factor). The solid curve is for the ligand-independent and the dashed curve is for the ligand-induced case. In general, the dashed curve will depend on [TNFα ], here fixed at [TNFα ] > KdTNF . (b): The receptor density corresponding to the two binodal points at given strength of the B factor (related to [TRADD], [SODD]), as a function of the TNFα concentration. The upper curve corresponds to φbC and the lower one is related to φb [ . Here a0 k 1nm.
paper.tex; 15/06/2000; 18:37; p.11
12
C. Guo & H. Levine
In figure 4, we notice that the solution curve of the second equation intersects the first curve past the lower binodal curve. This means that the V system will attempt (via nucleation) to spontaneously segregate into a dilute and a dense phase so as to generate the lowest overall free energy. The last curve shown verifies that the solution curve for n W 0 - 999979 intersects the upper branch of the van der Waals loop at exactly the same value of µ φ , showing that these two phases can coexist. Consequently, the system becomes metastable if the receptor density is V large enough such that the saddle point solution φ T is located between the binodal φb and spinodal φs points. This requires a minimal receptor density 9 n W min at a 9given set of transducer, inhibitor concentrations. For the ligand-free V case, from eqn.(11), (12) we have 2
nW
min
nc �
e
βgE D 2
�
eβgE D �
1 2
9
ξ 3
B9
1 �
with nc
e l βgE Dξ 1 � e l βgE Dξ
(14)
where ξ and the B factor are defined as before. Likewise, the minimal receptor density in the presence of ligand can be computed. The consequences of these results are shown in figure.5. What can we learn from these phase diagrams? First, the existence of a first-order phase transition has an immediate implication that the cells use an “all-or-none” reaction to execute the programmed death or proliferation. Second, compared to figure.5(a) (the constitutive signaling), the deep-“well”like phase boundaries in figure.5(b) indicates that the variation of ligand at small (moderate) concentration ranges can cause a strong (weak) response in ligand-induced clustering. Obviously, this gives the cells a sensitivity and a robustness; both are required for functional biology [9]. Also, these diagrams reveal qualitatively how the signaling responds to a change in any of the molecular concentrations. For instance, it is known that the receptor density can be down-regulated by antibody treatment and the active, unphosphorylated TRADD can be increased by applying osmotic pressure [10]. Then, assuming a simple scaling between the osmotic pressure overload ∆P and the increment of active TRADD, ∆ � TRADD�\m � ∆P� γ with γ � 0, we find from eqn.(14) a power law divergence ∆P T m � n � nc � γ 9 for the pressure necessary to induce clustering, when the receptor density n is down-regulated to nc . Likewise, there are many other ways to modulate the molecular concentrations including over-expressing (suppressing) SODD, TRADD by mRNA (antisense RNA), & UV irradiation [4, 5, 10], and our results can be directly tested by experiment.
paper.tex; 15/06/2000; 18:37; p.12
13
A statistical mechanics model for receptor clustering
5. The Nucleation Rate Next, we test the validity of statistical mechanics approach of this type by estimating the time scale of nucleation. Experimentally, measuring a precise clustering rate on living cells for a cooperative signaling system of this type ( TNF and other growth factor receptor families) is rather a big challenge. The available methods to date are direct observation by immuno-staining [10], electron microscopy [11], fluorescence imaging [12], or indirect measurement from the receptor chemical modification (phosphorylation & adaptor association, e.g.) provided that these reactions are fast after clustering [5, 13]. Unfortunately, none of them can provide explicit data; all is known is that the order of magnitude of the clustering rate is estimated to lie in the range of 0 - 2 m 1 min 1 [5, 10, 11, 12, 13]. 9 Here, as the receptor system is pushed into the metastable part of the phase diagram (i.e. between the binodal and spinodal points), a nucleation process [14] will take place, driving the system from a relatively dilute uniform phase to coexisting dilute & dense phases. The rate of this process J nuc is determined by the fact that the system must pass through a spatially inhomogeneous transition state, the droplet of nucleation. Typically, J nuc � νe ∆F 9 with ∆F as the free energy cost (as compared to the metastable initial phase) and ν as the growth rate of this droplet. To find out ∆F, we need to determine the transition structure (droplet); this can be done via finding an inhomogeneous solution of the equation which results from varying the free energy functional. This equation takes the form 2
a20 ∇2 φ
φ 3 1 φ 9 βgE D
ln
�
φ�
µφ gE D
(15) 2
1 d d where ∇2 is the Laplacian which in polar coordinates becomes dr 2 � r dr . Here µφ is the2 chemical potential fixed by the “homogeneous” metastable
3 � βg Dφ state βµφ ln 1 φmeta E meta . φmeta Eqn.(15) can9 be solved numerically. As r � ∞ we have φ r n ∞ � φmeta � δφe λr ; from eqn.(15), we find λ2 � βgE Dφmeta � 1 � φmeta � 1 � 1. Since λ2 9 9 must be greater than zero, this implies that the metastable φ meta I φs , as expected. On the other hand, near the origin φ � r � φ 0 � 14 κr2 , with9 κ 2
ln 1 φ0φ0 3 � φ0 � gEφD . Requiring this to be less than zero leads to φ meta I 9 . Thus, we have two unknowns, φ and δφ, which can be fixed by φ0 I φ � dense 0 � integrating eqn.(15) from both the r 0, r ∞ ends and matching φ, dφ 0 dr in between. The droplet profile is plotted in figure 6(a)A. In general, the droplet becomes more and more flattened as φmeta approaches the spinodal point φs . 9 If we denote the location of the peak in the free energy density as r m , we find 1 βgE D
µ
paper.tex; 15/06/2000; 18:37; p.13
14
C. Guo & H. Levine
2.9
(a) 0.4
φmeta=0.0131 φmeta=0.0218
φ(r)
A
Rc ,(x a0nm)
φmeta=0.0045
0.0 0.4
rm 1.9
Rc
C 0.9
∆F/[kBT]
∆f(φ)/[kBT]
16
B
8
D φb−
0.0 0.0
5.0
10.0
r ,(x a0nm)
(b)
φs−
0 0.00175
0.0217
φmeta
0.0417
4
L = 10
3
L = 10
4
10 −1
nucleation rate, ( xmin )
2
L = 10 TNF
[TNFα]/Kd
=1
2
10
B = 10
−3
−2
B = 5•10
B = 10
−1
0
10
−2
10
−3.0
10
−2.0
10
,
−1.0
10 ( x[a0nm] ) −2
10
0.0
Figure 6. (a): (A) The calculated droplet density and (B) corresponding free energy density profiles in different metastable states. The droplet size Rc corresponding to an effective cluster and the free energy barrier are also estimated in (C) and (D), respectively. (b): The calculated nucleation rate at molecular unit, with different system sizes ( oqp La0 r 2 D nm2 , indicated by the solid, dashed, and long-dashed curves) and B factors. Here the B factor (i.e., the transducer, inhibitor concentration ratio) is defined in eqn.(4). Clearly, the system size does not greatly affect the nucleation rate. Here [TNFα ] > KdTNF = 10 ng/ml is set as the usual application dosage [10].
paper.tex; 15/06/2000; 18:37; p.14
A statistical mechanics model for receptor clustering
15
that rm � ∞ as φmeta � φs , figure 6(a)C, manifesting the onset of a long 9 wavelength instability for this type of calculation. Also, the free energy barrier ∆F �ts d 2 r � f � φ � f MF � φmeta � is shown in figure 6(a)D. Clearly, when φmeta � φs , ∆F � 0, and when φmeta � φb , ∆F � ∞. 9 9 To obtain the growth rate ν, we use the Becker-Doering theory, in which 0 the growth rate ν � φmeta t¯c where φmeta is the density of metastable state molecule surrounding the droplet and t¯c is the mean “capture” time for wandering molecules to adhere to the droplet [15]. For a large system size L, we obtain φmeta Jnuc ln � L 0 Rc � e 9 ∆F (16) 2Dm where Dm � 10 8 cm2 /sec is the membrane diffusion constant and R c is the 9 effective cluster size defined via πR 2c � φ � dense � � φmeta � � s d 2 r � φ � r � φmeta � . Finally, to have a qualitative range of the nucleation rate, we assume V that in physiological condition, the receptor density is just below the binodal point for the ligand-absent case, so as to give the system a maximal sensitivity. Then, from figure 5B, we get that the corresponding TNFR1 densities n W are roughly 5 � 10 1 , 5 � 10 2 , 5 � 10 3 for the B factor 5 � 10 3 , 10 2 , 10 1 , 9 9 9 9 9 9 respectively. Interestingly, from figure 6(b), we found that the nucleation rate for these three values are almost in the same range (Jnuc � 10 2 m 1min 1 ). 9 9 This quantity is very close to the experimentally estimate (0 - 2 m 1 min 1 ) 9 in TNFR1 [11, 5] and other receptor system [12, 13], and thus confirms the validity of our model. Also, at the maximal sensitivity level, the lack of dependence of the nucleation rate on the details of parameters (the system size and cytoplasmic conditions such as the B factor, e.g.) endows the system with a desired robustness.
6. Discussion We have presented a lattice statistical mechanics model for TNFR1 clustering. Our basic idea is simple. The interaction between receptors can lead to a first-order phase transition with a discontinuous jump in the receptor density as a function of the receptor, transducer, inhibitor densities, and/or the ligand concentration. Turning this around, this implies that the receptor system will spontaneously phase separate for some range of parameters. Thus our model successfully explains how ligand-induced TNFR1 clustering can take place. Given that a cooperative clustering mechanism of this type has been widely adopted by other families of growth factor signaling [1], we expect that our modeling can be easily extended to other systems. Then, two very questions that should be addressed are (a) what is the physiological role of ligand treatment in functional biology? and (b) what design principles might have been used, during evolution, for the cells to acquire the advantage of clustering?
paper.tex; 15/06/2000; 18:37; p.15
16
C. Guo & H. Levine
In the current system, it is known that clustering TRADD-TNFR1 complex can recruit adaptors such as TRAF 2 , FADD, and RIP, which in turn can activate downstream elements including JNK, NFκB, and caspase [2], leading to gene expressions for the cell death or proliferation. Recently, one of the adaptors, TRAF2, was found to self-associate into a trimer [16]. This might shed a light on the possible purpose for clustering, i.e., that clustering TNFR1-TRADD complex provides a molecular scaffold to facilitate signaling. From the phase diagrams, our results indicate that compared to the constitutive one, the ligand-regulated signaling has a rather larger sensitivity (robustness) in small (moderate) ligand concentration. Also, at the level of maximal sensitivity, our calculations on the nucleation rate show an independence on the details of cellular parameters. This again provides the cells a robustness. Such a “digital” (all-or-none) response is different from the “continuous” one seen in some type of sensory such as amoeba chemotaxis [17] in which an ability to continuously monitor the relative change of stimuli is necessary. But, 2-state-like behavior is also popular in small-scale biochemistry such as functional protein folding and the corresponding chemical reactions. Perhaps after long-term evolution, the cells have developed receptor clustering as a “large-scale” digital machinery to execute an “all-or-none” response, such as programmed cell death or cell proliferation, in an analog world. HL and CG acknowledge the support of the US NSF under grant DMR985735.
References 1.
2. 3.
4.
5. 6.
Heldin, C.H. 1995. Dimerization of cell surface receptors in signal transduction. Cell. 80. pp213-223. Stuart, D.I. & Jones, E.Y. 1995. Recognition at the cell surface: recent structural insights. Curr. Opin. Struct. Biol. 5. pp735-743. Ashkenazi, A. &, Dixit, V.M. 1998. Death receptors: signaling and modulation. Science. 281. pp1305-1308. Park, A. & Baichwal, V.R. 1996. Systematic mutational analysis of the death domain of the tumor necrosis factor receptor 1-associated protein TRADD. J. Biol. Chem. 271. pp9858-9862. Boldin, M.P., Mett, I.L., Varfolomeev, E.E., Chumakov, I., Shemer-Avni, Y., Camonis, J.H. & Wallach, D. 1995. Self-association of the "death domains" of the p55 tumor necrosis factor (TNF) receptor and Fas/APO1 prompts signaling for TNF and Fas/APO1 effects. J. Biol. Chem. 270. pp387-391. Vandevoorde, V., Haegeman, G. & Fiers, W. 1997. Induced expression of trimerized intracellular domains of the human tumor necrosis factor (TNF) p55 receptor elicits TNF effects. J. Cell Biol. 137. pp16227-16238. Jiang, Y., Woronicz, J.D., Liu, W. & Goeddel, D.V. 1999. Prevention of constitutive TNF receptor 1 signaling by silencer of death domains. Science. 283. pp543-546. Grell, M., Wajant, H., Zimmermann, G. & Scheurich, P. 1998. The type 1 receptor (CD120a) is the high-affinity receptor for soluble tumor necrosis factor. Proc. Natl. Acad. Sci. USA. 95. pp570-575.
paper.tex; 15/06/2000; 18:37; p.16
A statistical mechanics model for receptor clustering
7. 8. 9. 10.
11.
12.
13.
14.
15.
16. 17.
17
Guo, C. & Levine, H. 1999. A thermodynamic model for receptor clustering. Biophys. J. 77. pp2358-2365. Amit, D. J. 1993. World Scientific, River edge, New Jersey. Barkai, N; Leibler, S. 1997. Robustness in simple biochemical networks Nature. 387. pp913-917. Rosette, C. & Karin, M. 1996. Ultraviolet light and osmotic stress: activation of the JNK cascade through multiple growth factor and cytokine receptors. Science. 274. pp11941197. Mosselmans, R., Hepburn, A., Dumont, J.E., Fiers, W. & Galand, P. (1988) Endocytic pathway of recombinant murine tumor necrosis factor in L-929 cells J. Immunol. 141. pp3096-3100. Garraway III, K.L., Koland, J.G. & Cerione, R.A. (1989) Visualization of epidermal growth factor (EGF) receptor aggregation in plasma membrane by fluorescence resonance energy transfer. J. Biol. Chem. 264. pp8699-8707. Gadella, T.W.J. & Jovin, T.M. (1995) Oligomerization of epidermal growth factor receptors on A431 cells studied by time-resolved fluorescence imaging microscopy. J. Cell Biol. 129. pp1543-1558. Guo, C., Dower, S.K., Holowka, D. & Baird, B. (1995) Fluorescence resonance energy transfer reveals Interleukin (IL)-1 dependent aggregation of IL-1 type I receptors that correlates with receptor activation. J. Biol. Chem. 270, pp27562-27568. Simm, A., Hoppe, V., Karbach, D., Leicht, M., Fenn, A. & Hoppe, J. (1998) Late signals from PDGF receptors leading to the activation of p70S6 kinase are necessary for the transition from G1 to S phase in AKR-2B cells. Exp. Cell Res. 244. pp379-393. Wofsy, C., Kent, U.M., Mao, S., Metzger, H. & Goldstein, B. (1995) Kinetics of tyrosine phosphorylation when IgE dimers bind to FCε receptors on rat basophilic leukemia cells. J. Biol. Chem. 270. pp20264-20272. Hirth, J.P. & Pound, G.M. 1963. Pro. Matr. Sci. II, Condensation and Evaporation. Nucleation and Growth Kinetics. MacMillan. New York. New York. Zettlemoyer, A.C. 1969. Nucleation. Marcel Dekker. New York. New York. Abraham, F.F. 1974. Ad. Theo. Chem. Sup. I, Homogeneous Nucleation Theory. Academic Press. New York. New York. Langer, J.S. 1967. Ann. Phys. 41. pp108-157. 1968. Phys. Rev. Lett. 21. pp973-976. 1969. Ann. Phys. 54. pp258-275. Berg, H.C. & Purcell, E.M. 1977. Physics of chemoreception. Biophys. J. 20. pp193-219. Haugh, J.M. & Lauffenburger, D.A. 1997. Physical modulation of intracellular signaling processes by locational regulation. Biophys. J. 72. pp2014-2031. Park, Y.C., Burkitt, V., Villa, A.R., Tong, L. & Wu, H. 1999. Structural basis for selfassociation and receptor recognition of human TRAF2. Nature. 398. pp533-538. Xiao, Z., Zhang, N., Murphy, D.B. & Devreotes, P.N. 1997. Dynamic distribution of chemoattractant receptors in living cells during chemotaxis and persistent stimulation. J. Cell Biol. 139. pp365-374.
Address for Offprints: Herbert Levine. Dept. of Physics, University of California San Diego, La Jolla, CA 920930319. Tel: (858)-534-4844. Fax: (858)-534-7697.
paper.tex; 15/06/2000; 18:37; p.17
paper.tex; 15/06/2000; 18:37; p.18