Kansas State University Libraries
New Prairie Press Conference on Applied Statistics in Agriculture
2001 - 13th Annual Conference Proceedings
A STATISTICAL MODEL USING REFERENCE EVAPOTRANSPIRATION AND WEATHER DATA TO PREDICT THE ECONOMIC OPTIMAL IRRIGATION LEVEL FOR CORN PRODUCTION IN THE TEXAS PANHANDLE W. Arden Colette Clay Robinson Lal Khan Almas
Follow this and additional works at: http://newprairiepress.org/agstatconference Part of the Agriculture Commons, and the Applied Statistics Commons
This work is licensed under a Creative Commons Attribution-Noncommercial-No Derivative Works 4.0 License.
Recommended Citation Colette, W. Arden; Robinson, Clay; and Almas, Lal Khan (2001). "A STATISTICAL MODEL USING REFERENCE EVAPOTRANSPIRATION AND WEATHER DATA TO PREDICT THE ECONOMIC OPTIMAL IRRIGATION LEVEL FOR CORN PRODUCTION IN THE TEXAS PANHANDLE," Conference on Applied Statistics in Agriculture. https://doi.org/10.4148/ 2475-7772.1214
This is brought to you for free and open access by the Conferences at New Prairie Press. It has been accepted for inclusion in Conference on Applied Statistics in Agriculture by an authorized administrator of New Prairie Press. For more information, please contact
[email protected].
Conference on Applied Statistics in Agriculture Kansas State University Kansas State University
30
A STATISTICAL MODEL USING REFERENCE EV APOTRANSPIRA TION AND WEATHER DA TA TO PREDICT THE ECONOMIC OPTIMAL IRRIGATION LEVEL FOR CORN PRODUCTION IN THE TEXAS PANHANDLE W. Arden Colette, Clay Robinson, and Lal Khan Almas Division of Agriculture, West Texas A&M University Canyon, Texas 79016 Abstract Corn yield and evapotranspiration (ET) data obtained from weighing lysimeters is accumulated from nine experiments over six years and used to estimate a response function. The quadratic response function of corn yield as a function of water use by the plants indicates that yield increases at a decreasing rate as ET increases. Extending the analysis to water application data by commercial producers in a thirteen county area in the Texas Panhandle provides a response function of yield as a function of water application to meet ET needs. The best estimate of the relationship is a quadratic function. The response function is transformed into a value function measuring the value of corn produced corresponding to different levels of water availability. The cost function is estimated in terms of the energy cost for irrigation. These value and cost functions are then used to determine the profit maximizing level of water application for various price levels for corn and natural gas.
Key Words: response function, water, natural gas, input use, optimization. 1. Introduction Texas agriculture generated over $13 billion in receipts in 1999. Although the High Plains represents less than 15% of the area it accounts for over 40% of the value of agricultural production for the state. Agricultural is the largest industry in the High Plains region. In addition to leading the state in the production of corn, wheat, and cotton: more than 6 million cattle are fed annually within 75 miles of Amarillo (Texas Agricultural Statistics Service 2000).
irrigation is important to maintaining the agricultural productivity in the area. District I-N, the Northern I-ligh Plains, produces 60% of the corn and 88.6% of the irrigated corn in the state. Over half~ 53.7%. of the wheat including 88.4% of the irrigated wheat and 56.9% ofthe irrigated sorghum in the state is produced in District I-N. The development of irrigation in the region is a recent phenomenon. Virtually all of the development has occurred since the end of World War II. Between 1950 and 1980 irrigated acres increased from 19,315 to 1.754.560. Since 1980 irrigated acres have declined to 1,363,438 Crable I). The water availability in the Ogalalla aquifer has declined and pumping costs have increased. The significance of the impact of irrigation in agricultural production is shown by the differential between the yield of irrigated and non-irrigated corn. in 1999, the yield on the 757,500 acres of irrigated corn averaged 180.4 bushels per acre, compared to an average of 40.0 bushels per acre on the 6,500 acres of nonirrigated corn (Texas Agricultural Statistics Service 20(0). Irrigation increases yield by 2 to 7 times over non-irrigation. When risk is defined as a function of the variability in yield, irrigation reduces risk by 75% to 90%.
New Prairie Press http://newprairiepress.org/agstatconference/2001/proceedings/4
Applied Statistics in Agriculture
Conference on Applied Statistics in Agriculture Kansas State University
31
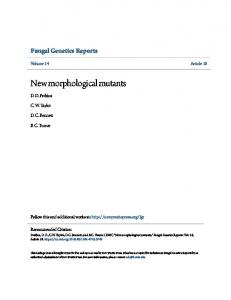
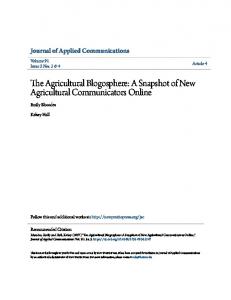
Due to the variability in precipitation irrigation is essential to maintaining consistent, high yields of corn in the Northern High Plains. In Amarillo the annual average precipitation over the 120year period from 1880 through 2000 is 20.53 inches. However, the range in annual precipitation is from less than 9 inches to over 40 inches (Figure 1). There are pronounced year-to-year variations with as much as 15 to 20 inch differences in consecutive years. Major wet and dry cycles are observed. Short periods of significantly above average precipitation are usually followed by long periods of below average to average precipitation. A seasonal pattern adds to the variability (Figure 2). Over 50% of the annual precipitation is received during the summer growing season from May through October. May, June and August are the months with the highest average rainfall. The decline in the water level in the Ogalalla aquifer is an on-going concern. Wells that produced 1000 to 1200 gallons per minute in the 1960' s often produced less than 200 gallons per minute in the 1990's. Since there is almost no recharge of the Ogalalla aquifer in this area, irrigation water is a fixed supply. Any water applied in excess ofthe amount used by the crop is wasted and cannot be replaced. Excessive pumping results in shortening the economic life of the farming operation and reduces the returns to the resources held by the farmer (Amosson et al. 2001). This last year natural gas prices increased from less than $3 per mcf (thousand cubic feet) to more than $11 in less than six months. The rapid increase in natural gas prices during the energy crisis led to increased fears over the cost of irrigation and fertilizer. Natural gas is the primary energy source used for pumping irrigation water in the Texas Panhandle. Tripling of energy cost is prompting producers to ask whether they should abandon irrigation, switch to more water efficient crops, or reduce water application rates. This paper attempts to provide one answer to the question of how much water should be applied to corn in the Texas Panhandle. Producers tend to apply inputs in an effort to maximize output. Unfortunately, this will seldom result in the producer making the most profit. The Law of Diminishing Marginal Returns states that each additional unit of input provides a smaller increment in output than the preceding unit of input (Beattie and Taylor, 1985). Therefore, the producer will always reach a point where adding more input will increase cost by more than the increase in revenue. This will result in a decrease in the net retained by the producer. Profits will decline. Since the input level that maximizes profit will always be less than the level of input that maximizes output, the question is what level of input is the optimal economic level that will maximize profit for the producer. This study is an attempt to determine the optimal economic level of irrigation water application on corn with a Low Elevation Spray Application (LESA) system under different prices for corn and natural gas in the Texas Panhandle. 2. Estimation of the Association of the Yield of Corn to Evapotranspiration It is necessary to determine the water response function for corn before the optimal water application rate can be determined. The response function shows the relationship between the yield and the amount of water used by the plant. It indicates the expected output level for each level of water application. It also provides the information on what the expected increase in yield will be if another unit of the input is used.
New Prairie Press http://newprairiepress.org/agstatconference/2001/proceedings/4
Conference on Applied Statistics in Agriculture Kansas State University
Kansas State University
32
The response function shows the relationship between the yield and the amount of water used by the plant rather than the amount of water applied. The output or yield is determined by the amount of water actually used in the biological growth process rather than the amount added to the field. The water use includes the water used by the plant in transpiration and the water lost from the soil through evaporation. Together these two processes are referred to as evapotranspiration (ET). Transpiration includes the water used by the plant for metabolism. Evaporation includes the water loss from plant and soil surfaces. Data for estimating the water response function for corn includes 161 observations compiled from nine experiments conducted over a six-year period at the Bushland Agricultural Research Station west of Amarillo, TX (Howell et al. 1996; Howell et al. 1998; Tolk, Howell and Evett 1998). The water use and corresponding yields were measured using a weighing lysimeter. The data were combined into a single data set and linear, quadratic, square root, natural log, and Cobb-Douglas type functional forms were estimated using the SAS procedure, PROC GLM (SAS Institute Inc. 1999). Dummy variables were included to account for the exogenous variables associated with the different experiments. A quadratic model, such as in Equation 1, provides the best explanation for the relationship between the yield of corn and the water used for ET. This functional form allows for yield to increase at a decreasing rate as the level of ET increases. As the level of input increases, yield reaches a maximum and then declines. This fits very well with the biological processes. (1)
The quadratic model estimated from the data provides a statistically significant explanation for the relationship as Pr>F(2,15o)F(2AR)