In this paper, we use the concept of stochastic collocation to account for ... a crucial role in evaluating the PDF as well as confidence intervals on the outputs.
A Stochastic Collocation Method for Uncertainty Quantification and Propagation in Cardiovascular Simulations Sethuraman Sankaran Alison L. Marsden University of California, San Diego, La Jolla, CA 92093–0411
1
Simulations of blood flow in both healthy and diseased vascular models can be used to compute a range of hemodynamic parameters including velocities, time varying wall shear stress, pressure drops, and energy losses. The confidence in the data output from cardiovascular simulations depends directly on our level of certainty in simulation input parameters. In this work, we develop a general set of tools to evaluate the sensitivity of output parameters to input uncertainties in cardiovascular simulations. Uncertainties can arise from boundary conditions, geometrical parameters, or clinical data. These uncertainties result in a range of possible outputs which are quantified using probability density functions (PDFs). The objective is to systemically model the input uncertainties and quantify the confidence in the output of hemodynamic simulations. Input uncertainties are quantified and mapped to the stochastic space using the stochastic collocation technique. We develop an adaptive collocation algorithm for Gauss–Lobatto–Chebyshev grid points that significantly reduces computational cost. This analysis is performed on two idealized problems – an abdominal aortic aneurysm and a carotid artery bifurcation, and one patient specific problem – a Fontan procedure for congenital heart defects. In each case, relevant hemodynamic features are extracted and their uncertainty is quantified. Uncertainty quantification of the hemodynamic simulations is done using (a) stochastic space representations, (b) PDFs, and (c) the confidence intervals for a specified level of confidence in each problem. 关DOI: 10.1115/1.4003259兴
Introduction
Over the past decade, computational simulations have become an increasingly powerful tool to study the cardiovascular system. There has been a significant increase in the sophistication and clinical applicability of computational tools for patient-specific modeling of blood flow. This includes the capacity to build realistic and complex three-dimensional models directly from image data, to obtain velocities, pressure data, and mechanical properties of blood vessels from clinical and experimental data, and to perform simulations with greater physiologic reality. Simulations have played a key role in understanding hemodynamics of bypass grafting 关1–3兴, cardiovascular treatment planning 关4,5兴, atherosclerosis in the carotid artery 关6兴, and abdominal aorta 关7,8兴, the effects of exercise on aortic flow conditions 关7兴, congenital cardiovascular disease 关9–12兴, and coronary stents 关13–15兴. Yet, for simulations to be reliable and be put into widespread clinical use, it is essential to systematically quantify the level of confidence we can place on simulation outputs. Usually, a single computational simulation is performed and results such as shear stresses and velocities are deterministically quantified. However, our hypothesis is that in a variety of situations, the outputs can be quantified only probabilistically due to the presence of noise in the input data. Simulations are only as accurate as the data that goes into them and a thorough study is needed to determine how variations in these input data affects the outputs. In addition, when evaluating new surgical designs, we need to ensure that the changes due to design parameters are more significant than noise caused by input uncertainties. In this paper, Contributed by the Bioengineering Division of ASME for publication in the JOURBIOMECHANICAL ENGINEERING. Manuscript received July 29, 2009; final manuscript received May 24, 2010; accepted manuscript posted December 15, 2010; published online February 4, 2011. Assoc Editor: Dalin Tang.
NAL OF
Journal of Biomechanical Engineering
we will focus on hemodynamic simulations in the cardiovascular system, while emphasizing that the techniques presented are generic in nature. Some common sources of uncertainties in cardiovascular simulations include the following: 1. Boundary conditions: Computational simulation of blood flow requires boundary condition data that typically consist of 共a兲 inlet velocities, 共b兲 resistances, 共c兲 impedances, or 共d兲 lumped parameter models at the outlets. Each of these is subject to variability in measured flow distribution to distal branches, changing flow rates, and physiologic conditions. 2. Geometry: Anatomical models 共blood vessels, aneurysms, stenosis regions, etc.兲 are constructed directly from image data. Construction of the geometrical model is polluted with image noise, geometrical approximations 共approximation to nearest circles, ellipses, etc.兲, variations in segmentation methods 共for example, using thresholding or level set兲, and user variability. 3. Flow-split: In general, there is a lack of clinical data to determine flow distribution to multiple distal branches. In our third example, the Fontan surgery, we study the uncertainty in the flow-split between the left pulmonary artery 共LPA兲 and right pulmonary artery 共RPA兲. 4. Material properties: Uncertainty in the properties of bloodvessel walls are important when performing simulations with nonrigid walls. Due to the above-mentioned reasons, computational simulations need to be performed over a set of fuzzy parameters to determine how robust simulation outputs are to variation in the input parameters. Noise in reconstruction of geometric models from MRI images is a well known problem. Moore et al. 关16,17兴 carefully identified sources of such error and provided computational techniques to reduce them. However, uncertainties originat-
Copyright © 2011 by ASME
MARCH 2011, Vol. 133 / 031001-1
ing from limited spatial resolution, image segmentation, and model construction cannot be completely eliminated 关16兴. Currently, there is no systematic way of determining the effect of uncertain inputs on simulation results. One option is to manually perturb different parameters using a design of experiment strategy. Recently, Steinman and co-workers 关18,19兴 performed computational simulations to evaluate sensitivities in quantities such as wall shear stress and oscillatory shear index to variations in blood rheology, secondary flows, etc., in human subjects. These were some of the first studies showing the relationship between fluctuations in input parameters and output quantities for patientspecific cardiovascular simulations. However, if we need to compute sensitivities over a wide range of parameters, and if there are a large number of parameters, this method can become unwieldy due to the huge computational cost involved. In identifying an appropriate stochastic method for uncertainty quantification, there are several options. Traditionally, and the most widely known, Monte Carlo techniques have been employed for performing probabilistic analysis. However, they are plagued with poor convergence rates, and it is impractical to employ them for computationally expensive three-dimensional problems involving complex geometries. In this work, we use the concept of stochastic spaces for representing random parameters 关20兴. This concept has been used successfully in many engineering approaches over the past 2 decades. In the same way that space and time are seen as dimensions, randomness is seen as an additional dimension. The generalized polynomial chaos expansion 共GPCE兲 has been successfully used to tackle engineering problems involving uncertainties 关21兴, including computational fluid dynamics 关22兴. However, one disadvantage of this technique is the coupled nature of resultant matrix equations that need to be solved in the random domain. This is a disadvantage for legacy codes because it requires the solver to be entirely rewritten. Recently, a stochastic collocation scheme has been introduced in which simulations are performed at specific collocation points in the stochastic space 关23,24兴. This technique combines the exponential convergence rates of the GPCE scheme with the decoupled nature of Monte Carlo techniques. Using this technique, we can quantify the complete probabilistic variability of fields of interest as opposed to extracting only limited statistics. In this paper, we use the concept of stochastic collocation to account for uncertainties. A stochastic space is defined for each problem depending on the uncertainty in the parameters. Further, collocation points are identified in this stochastic space and computational simulations of the Navier–Stokes equations are performed. From the results, interpolants are constructed in the stochastic space and are quantified using probability density functions 共PDFs兲 and confidence intervals. The number of collocation points is chosen based on a factor called depth of interpolation that is explained in Sec. 2.1.1. Convergence of these methods is guaranteed as the depth of interpolation is increased. This can be tailored according to the expense of the function. It is to be noted that the choice of input uncertainties play a crucial role in evaluating the PDF as well as confidence intervals on the outputs. While Gaussian distributions are suitable to represent random noise in images, PDFs describing the variability in the blood flow velocities, or the flow-splits, are not readily available in the clinical literature. In these cases, accurate modeling of input PDFs can be made using data-driven techniques such as MaxEnt 关25兴. However, in this work, we restrict ourselves to studying analytical distributions with the goal of elucidating the capabilities of our technique. Whenever available, these analytical distributions are motivated from data in literature. For instance, the variability in the inlet velocities for the carotid artery bifurcation problem or the variability in the flow-splits is modeled using available information. In an attempt to minimize the number of stochastic collocation points, we develop and test a new scheme that adaptively chooses 031001-2 / Vol. 133, MARCH 2011
points based on the known function values. We demonstrate that this scheme can reduce computational cost by as much as 50%. This paper is organized as follows: we give a brief description of the mathematical formalism and uncertainty quantification in Sec. 2. We provide details of numerical implementation, including the adaptive algorithm, in Sec. 3. Numerical examples are detailed in Sec. 4 and we follow it up with discussions in Sec. 5.
2
Mathematical Background
In this section, we provide some basic characteristics of the stochastic collocation technique. We describe how the method is nonintrusive, can be used for large-dimensional parametric spaces by using the sparse grid collocation algorithm, and converges as the depth of interpolation is increased. A probability space is a triple 共⍀ , F , P兲, where ⍀ is a set of outcomes, F is a -algebra of subsets of ⍀, and P is a probability measure on F. A random variable X is a map from ⍀ to the real line R and is written X : ⍀ 哫 R 关26兴. A discrete random variable is a random variable that takes values in a discrete set of the real line. A continuous random variable is a random variable that admits a density function. 2.1 Stochastic Collocation Scheme. In the stochastic collocation technique, instead of dealing with PDFs directly, we use the concept of stochastic spaces in our numerical solutions. Stochastic space is the space of = 关1 , 2 , . . . , N兴, where i represents either uniform or normally distributed random variables. Any construct on the stochastic space has a unique PDF associated with it. A finite dimensional random support space is described by its truncated descriptor 共random vector兲 so that
= 关1, 2, . . . , N兴:⍀ → RN
共1兲
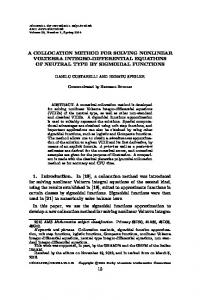
where the dimensionality N of the stochastic support space is problem dependent. We denote the approximations to a function g by g共x , t , i兲. In the collocation scheme, the stochastic space is approximated using mutually orthogonal interpolating functions. To represent a function at any point in the stochastic space, the function g共x , t , 兲 is written as g共x , t , 兲 = 兺ig共x , t , i兲Li共兲 where Li共 . 兲 are the orthogonal interpolating polynomials. The stochastic space can then be queried at any point and PDFs can be constructed. 2.1.1 Construction of Interpolating Polynomials. We represent a stochastic field using its values at specific collocation points in the stochastic space with an interpolating polynomial. In general, for one-dimensional functions, Gauss points and Chebechev points have the least interpolation error 关27兴. A trivial means to extend the above-mentioned scheme for multidimensions is by constructing a simple tensor product space. However, this is subject to the curse of dimensionality as the number of points grows exponentially. As a result, we employ computationally efficient schemes of searching the stochastic space. The Smolyak algorithm is a method for choosing the collocation points. The Smolyak algorithm reduces the number of collocation points necessary for interpolation in multidimensional random space while simultaneously minimizing the resulting error. This has been explained in Ref. 关28兴. Further details of the algorithm are given in Refs. 关27,29兴. Algorithms for integration based on sparse grids are provided in Ref. 关30兴. Collocation points constructed using Smolyak’s algorithm in two-dimensional stochastic space are shown in Fig. 1. We use Lagrange interpolating polynomials with Chebyshev based Smolyak sparse grids in this paper. The number of collocation points is increased in discrete steps. This is to ensure that all points with an equal predicted error are evaluated simultaneously. The depth of interpolation 关27兴 defines the number of simulations to be run and error indicators have been previously computed for each depth of interpolation. In practice, the depth of interpolation Transactions of the ASME
1
0.9
0.9
0.8
0.8
0.7
0.7
0.6
0.6
0.5
0.5
�2
�2
1
0.4
0.4
0.3
0.3
0.2
0.2
0.1
0.1
0
0
0.2
0.4
0.6
�
0.8
0
1
1
0
0.2
0.4
�
1
a
c
0.6
0.8
1
b
d
Fig. 1 The figure shows „a… stochastic collocation points in a two-dimensional stochastic space using a level-4 depth of interpolation and „b… level-6 depth of interpolation. „c… shows the function g„ · …, which is a sum of two Gaussian distributions, N„2 , 0.22… and N„1 , 0.12…. The PDF of g is shown in „d….
allows for flexibility in implementation because it can be adjusted according to the computational expense of the computations. 2.2 Solving Hemodynamic Equations With Uncertainty. Blood flow in the cardiovascular system is governed by the Navier–Stokes equations. The velocities u and pressures p are expanded using finite elements in space and the finite difference technique in time. We define the residual as 关31兴 R = 共共u,t + 共u · ⵜ兲u兲 + ⵜp − ⵜ2u − f兲, where denotes the viscosity, denotes density, and f represents all body forces. In the stochastic dimension, Lagrange interpolates are used to M represent u and p. Hence, we have u共x , t , 兲 = 兺i=1 ui共x , t , i兲Li共兲 M and p共x , t , 兲 = 兺i=1 pi共x , t , i兲Li共兲. These interpolating polynomials have the property, Li共 j兲 = 1 if and only if i = j and 0 otherwise. By imposing the residuals, R to be 0 at = i, we get a set of decoupled equations at the stochastic collocation points. As a result, we need only solve M deterministic equations when performing uncertainty analysis. Note that the boundary conditions imposed on the problem will also be decoupled. This is significant because the method is nonintrusive and solvers need not be rewritten in order to implement the method. Journal of Biomechanical Engineering
3
Numerical Implementation
3.1 Modeling and Solution of Deterministic Hemodynamic Equations. A customized version of the SIMVASCULAR software package is used for cardiovascular geometry modeling as well as solving the Navier–Stokes equations 关32,33兴. Models can be constructed for idealized as well as patient-specific models using this software. Idealized models are parametrized using a set of geometrical variables. Scripts are written that can be interfaced with the software to generate idealized models from their analytic description. Patient specific models are constructed directly from image data. Based on the image data, three basic steps are performed to construct the model 关12,32兴: 共i兲 centerline paths are created along all blood vessels, 共ii兲 segments are drawn along these paths that are perpendicular to the vessel using a 2D level set method, and 共iii兲 the segments are lofted to generate the 3D model. Once the model is generated, it is meshed using tetrahedral elements to be used with the finite element solver. The stabilized finite element technique using the generalized-␣ method 关34,35兴 is employed with linear basis elements and fourth MARCH 2011, Vol. 133 / 031001-3
order Runge–Kutta time stepping. Walls are assumed to be rigid, and Newtonian constitutive behavior is assumed, with a viscosity of blood set to 0.04 g/cm s and density set to 1.06 g / cm3. The number of elements and time steps are chosen based on the problem. Both steady-state and pulsatile inflow boundary conditions are imposed at the inflow face. We assume a parabolic flow profile for simplicity but the methods presented here do not restrict the use of other flow profiles, such as the Womerseley solution. Outflow boundary conditions are imposed using the coupled multidomain method 关36兴 using resistance, impedance, or RCR models. These lump the vasculature downstream of the outlets and manifest as additional terms in the finite element weak form. In each example, we choose the finite element grid size so that the velocity and pressure fields do not change significantly with further refinement. The maximum, minimum, and mean of these fields, as well as the contour plots, are checked and tested to be invariant with grid refinement. Uncertain parameters that are studied in this paper include 共a兲 uncertainty in geometry, 共b兲 uncertainty in boundary conditions, and 共c兲 uncertainty in flow-split. 3.2 Uncertainty Quantification in NS Equations Using Stochastic Collocation. The main advantage of the stochastic collocation technique is its nonintrusive nature; i.e., it can be seamlessly integrated over the existing simulation software with no modifications to the solver. Hence, the interpolation in the stochastic space is built independently on top of the hemodynamic solver. The stochastic code was implemented in MATLAB using the following steps:
location points for Lagrange interpolating polynomials. The goal is to reduce computational cost because of the large expense of performing multiple cardiovascular simulations. The choice of the error indicator plays an important role in the adaptive algorithm. Finite element simulations have used Hessian information for applications with linear finite elements 关31,38兴 to create adaptive meshing schemes. The rationale is that if a Taylor expansion is used for the functions, the second order term is the least order that cannot be captured. Further, finite elements use local interpolants, which makes the choice of Hessians inappropriate in the context of global interpolation. Since the theory behind collocation relies on convergence of the function value with increasing depth of interpolation 共which is global兲, we use error indicators based on the function itself 共rather than its gradients or hessians兲. For a collocation point ck, we denote its neighbors as N共ck兲. The essence of the algorithm is to split collocation points into a frozen set and an active set. An existing collocation point will be refined if there is at least one active point in a local neighborhood surrounding that point. We present the adaptive algorithm formally below. Compute the function values for depth of interpolation d = 0 and d = 1. Denote this set as Cd. Set F = 쏗 共F represents the set of frozen collocation points兲. Perform the following until the termination criterion is met: 1. Evaluate neighbors of a collocation point, and check if the function value needs to be evaluated: Set d = d + 1 and evaluate the function 共using Lagrange interpolation兲 at Cadapt,d+1 ⬅ 共Cd+1 − Cd兲, the set of collocation points that are in Cd+1 but not in Cd. If a collocation point c 苸 Cadapt,d+1 has at least one neighbor, h that is not in the frozen set, i.e., ∃h 苸 N共c兲 苸 F, perform a simulation at c. Otherwise, add c to F. 2. Compute hierarchical error indicator: Compute the hierarchical error indicator, E共ct兲 = f共ct兲 − If共ct兲, the difference between the function value and the interpolated value, at each collocation point where the function was evaluated in step 1. 3. Update the set of frozen points: For each point c evaluated in step 1, add the collocation point to the set F if E共c兲 ⬍ ⑀, where ⑀ is the chosen tolerance value. 4. Check termination criterion: If all of the collocation points are frozen, terminate. Else, go to step 1.
1. The collocation points are generated based on the stochastic dimensions as well as the depth of interpolation. The sparse grid toolkit spinterp 关29兴 is employed for this purpose. Each collocation point represents a different value of the uncertain parameters in physical space. 2. If moments are to be computed, the weights corresponding to each collocation point are computed by integrating the Lagrange functions over the stochastic space 3. At each collocation point, a 3D Navier–Stokes simulation is performed and the relevant outputs are stored. When all simulations have been performed, statistics, PDFs, as well as confidence intervals are estimated. 4. The depth of interpolation is increased until sufficient convergence of the PDF has been reached. To couple the collocation tools with the model generation and flow solver, the geometries in this paper 共except the Fontan problem兲 are generated using automated scripts. The interface to the fluid-solver is also automated using scripts. All scripts are directly interfaced with SIMVASCULAR and call internal SIMVASCULAR functions for meshing, boundary conditions, postprocessing, etc., automatically. The PDF and confidence intervals are computed by taking a very large number of input variables 共of the order of 100,000兲 and using spinterp to obtain the interpolated values. From this, the histogram and hence PDF and confidence intervals can be computed.
Using this method, when we increment the depth of interpolation, we perform simulations only at those points, which are not a subset of frozen patches that are computed according to our error estimate. This algorithm preserves the interpolation error up to ⑀. Further, setting ⑀ = 0 makes this algorithm equivalent to the conventional sparse grid algorithm. The value of ⑀ can be chosen according to the smoothness of the function and the expense of computing function values. This is similar to the adaptive parameter used in Ref. 关27兴. Figure 2 shows a flowchart of the procedure for performing uncertainty analysis with adaptivity.
3.3 Adaptive Collocation. The stochastic collocation method chooses points that minimize the overall error. However, this does not take into account any information about the function itself. Dimension independent adaptivity has been proposed in previous work, wherein a dimension is refined based on its error indicator. Yet, the refinement of each dimension itself is uniform, and hence adaptivity over a specific region in the stochastic space is not done. Dimensional adaptivity refines each dimension conventionally but operates on the more important dimensions first 关28兴. Hence, it does not account for steep function variations and reduces to a conventional sparse grid for any symmetric problem. The concept of functional adaptivity has been attempted for locally linear basis functions 关37兴. However, such interpolates with discontinuous gradients are not appropriate for our application. We have therefore developed a method to adaptively choose col-
4
031001-4 / Vol. 133, MARCH 2011
Numerical Examples
In this section, we apply these stochastic methods to three cardiovascular model problems: an idealized abdominal aortic aneurysm, an idealized carotid artery bifurcation, and a patient-specific Fontan surgery problem. 4.1 Abdominal Aortic Aneurysm. In this example, we evaluate uncertainties in an idealized model of an abdominal aortic aneurysm 共AAA兲. Current research in AAA hemodynamics revolves around three questions: 共a兲 What is the cause of aneurysm? 共b兲 What determines their rate of expansion? 共c兲 When do they rupture? The exact pathogenesis of AAA is unknown and is hypothesized to be a combination of factors such as genetic disorders, mycotic infection, high blood pressure, smoking, atherosclerosis, and aging 关39兴. The rate of expansion of the aneurysm is a Transactions of the ASME
Identify input uncertainties
Compute stochastic grid and interpolates
Perform simulation at each collocation point
Post-process, compute error indicators
converged? yes
stop
no refine grid/increase depth of interpolation
Fig. 2 A schematic of the stochastic collocation technique procedure for performing uncertainty analysis in cardiovascular simulations
valuable indicator to determine the risk of rupture and decide if surgical intervention is necessary 关39兴. This, however, depends on factors such as the formation of endoluminal thrombus 共anomalous response of the endothelium to low and oscillatory shear stress 关40,41兴兲 and the mechanical properties of the arterial wall. This has motivated researchers to perform hemodynamic and FSI simulations and study shear stresses and recirculation near walls of the AAA. Idealized models have been widely used to study flow patterns and hemodynamic stresses in the AAA 关42–44兴. Flow separation in the aneurysm and shear stresses on AAA walls help to determine formation of regions of stasis as well as growth dynamics of the AAA 关43兴. Parametric in vitro studies of the effect of increase in AAA radius on the flow patterns and wall stresses have been studied to identify the critical size for rupture of the aneurysm 关43兴. Realistic patient-specific studies have been performed to assess the risk of aneurysm rupture using solid mechanics 关45兴 as well as fluid-structure interaction simulations 关46兴. It has been reported that surgical interventions should not be based on radius alone but on other factors such as wall shear stress 关47兴. Here, we perform the task of computing the effect of uncertainty in AAA radius using the sparse grid collocation technique. The goal is to illustrate the stochastic collocation method by evaluating the effect of uncertainty in the aneurysm size on output parameters. While we use an idealized model here, we emphasize that the technique we present is generally applicable to the patient-specific case as well. An idealized AAA model is constructed using an automated script that takes the radius as an input parameter. The values of the parameters are chosen based on typical sizes for humans 关48兴 with the diameter of the parent vessel, d p = 2.0 cm, bifurcation angle
= 36 deg, and iliac artery diameter, di = 1.4 cm. Steady state velocity boundary conditions are assumed at the inlet to the abdominal aorta with flow rate Q = 30 cm3 / s. The outlets are modeled using resistance boundary conditions to represent the downstream vasculature and are appropriate for steady-state flows with fully developed velocities at the outlet. The pressure and flow rate are related as p = QR, where R is the resistance and Q is the flow rate. Resistance boundary conditions with R = 443.4 dynes s / cm5 are employed at the outlet iliac arteries. The uncertainty in radius is expressed as a normal random variable, r共兲 ⬃ N共r , r2兲 with mean r = 1.8 and standard deviation r = 0.2. The radius is given as r共兲 = r + r. A tetrahedral mesh with roughly 80,000 elements, which ensured spatial convergence, was generated for each AAA model. A time step of 0.005 s was used and the simulation was run for 400 timesteps to ensure convergence to steady-state conditions. A one-dimensional stochastic space is represented using Chebyshev nodes and Lagrange polynomial interpolates. The Navier– Stokes equations are solved at each collocation point. The mean spatial wall shear stress 共MWSS兲 across the aneurysmal region is chosen as the output variable. A plot of the MWSS in the stochastic space and its convergence using Lagrange polynomials is shown in Fig. 3. Locally linear interpolating functions did a poor job of refining the function near = 0. The shape of the shear stress plot is due to a combination of increasing cross-sectional area of the aneurysm and reduction in traction due to recirculation of blood. Increased area reduces the velocity across the aneurysm for a constant volumetric inflow rate but once recirculation sets in, forward flow is confined to the central portion or the core of the artery. The one-dimensional plot shown in Fig. 3 has regions of
� cm � s
τ
�
g � cm s2
vz
ξ
a
b
Fig. 3 „a… Stochastic space representation of mean shear stress over the abdominal aneurysm. Different depths of interpolation using conventional sparse grids are shown in the figure. „b… shows the onset of recirculation depicted using the vertical blood velocities.
Journal of Biomechanical Engineering
MARCH 2011, Vol. 133 / 031001-5
MWSS
ξ = 0.0
ξ = 0.5
�
g � cm s2
Further, we compute the PDF of shear stresses, which is shown in Fig. 7. This figure shows the probability of average shear stresses across the aneurysm. The PDF does not change significantly beyond level 6 and hence, a depth of interpolation 6 is found to be sufficient for this problem. From the PDF, we extracted confidence intervals as well as confidence levels. A confidence interval, CI, is given by CI= 关L , U兴, where Pr共L ⬍ ⬍ U兲 = 1 − ␣ and 共1 − ␣兲 ⫻ 100% is the confidence level. The confidence bounds are given in Table 1. This table indicates that for the given uncertainty in the radius, we can be 99.9% certain that the MWSS is between 0.46 and 0.81 g / 共cm− s2兲.
ξ = 1.0
Fig. 4 The figure shows wall shear stress plots at different radii corresponding to the extremes and mean of the stochastic space
steep function variation 共corresponding to initial variation with increasing radius兲 and regions where it is almost constant 共once recirculation sets in兲. Shear stress plots are shown in Fig. 4 for three different radius values. Figure 5 shows contours of vz illustrating recirculation for different radii of the abdominal aneurysm. The recirculation region develops between = 0.02 and = 0.14 but does not vary significantly from = 0.14 to = 0.5. This explains the initial steep variation in the shear stresses but moderate variation beyond = 0.1. To further reduce the number of required flow simulations, we used the adaptive algorithm with ⑀ = 5 ⫻ 10−3. This resulted in a significant reduction in the number of collocation points because points were not added in the flat region of the function. For a level 7 Smolyak sparse grid, 129 points were required, but 41 points sufficed for the adaptive algorithm. For levels 5 and 6, 29 and 35 points were required using the adaptive algorithm as opposed to 33 and 65 points, respectively, as shown in Fig. 6. The adaptive algorithm resulted in savings of almost 50%.
Fig. 5 Contours of vz for the recirculating regions „with positive component of vz… „from left… = 0.02, = 0.09, = 0.14, and = 0.5
4.2 Carotid Artery Bifurcation. The carotid artery is a major vessel that provides oxygenated blood to the neck and head. Pioneering work of Zarins and co-workers 关49兴 demonstrated a link between atherogenesis and hemodynamic variations to the bifurcation geometry 共obtained from human cadaver data兲 using in vivo steady-state flow experiments on the carotid bifurcation. Intimal thickening 共formation of atherosclerotic plaque兲 was found to be inversely proportional to the shear stresses and the measured shear stresses were significantly lower at the locations of plaque formation. Subsequently, strong correlations were found between the inverse of maximum shear stress, inverse of mean shear stress, and oscillatory shear stress with the intima thickness under pulsatile flow conditions 关50兴. The carotid sinus, which occurs at the bifurcation of the common carotid artery into the interior and exterior carotid arteries, has been the focus of many computational studies 关6,34,48兴. The study of hemodynamics and wall shear stresses near the carotid sinus is an area of significant interest. Milner et al. 关6兴 performed a detailed computational study of hemodynamics in the carotid bifurcation. In this example, we examine hemodynamics in an idealized carotid artery due to uncertainties in geometry as well as boundary conditions. Thomas et al. reported 关51兴 that the sinus geometry, as well as flow rate, can vary significantly in humans if measured over a time period of a couple of weeks. Geometrical uncertainty can be associated with changing positions of the patient and limitations of the measurement instrument 关51兴. Marshall et al. 关52兴 used magnetic resonance imaging 共MRI兲 with cine phase contrast to measure blood velocities in the carotid bifurcation. This example illustrates the use of the stochastic collocation method with more than one uncertain parameter. The radius of the carotid artery sinus and the inflow velocity waveform are assumed to be uncertain. Impedance boundary conditions are imposed at the outlets 关36兴. In this method, the flow rate at any time depends on the pressure history over one time period and utilizes Womersley’s linear wave theory. The split angle is 50 deg, the diameter of the CCA is 6.2 mm, the ICA is 3.5 mm, and that of the OCA is 4.4 mm. Outflow and the inflow velocity profiles were taken from literature values 关52兴. The outflow velocity was used to specify the flow-split to the two outflows. This information was used together with a typical pressure waveform to compute impedance values. The finite element mesh contained 100,000 tetrahedral elements and a time step of 0.003067 was chosen. The time period of a cardiac cycle is 0.923 s. Three cardiac cycles 共900 time steps兲 were simulated to ensure convergence of the results.
0.1
0.1
0.05
0.05
0
0
−0.05
−0.05
−0.1 0
0.1
0.2
0.3
0.4
0.5
ξ
0.6
0.7
0.8
0.9
1
−0.1 0
0.1
0.2
0.3
0.4
0.5
ξ
0.6
0.7
0.8
0.9
1
Fig. 6 The stochastic collocation points for a depth of interpolation 6 using „left… conventional sparse grid and „right… adaptive sparse grid
031001-6 / Vol. 133, MARCH 2011
Transactions of the ASME
0.4 Level 2 Level 4 Level 6 Level 7 Level 8
Probability distribution function
0.35
0.3
0.25
0.2
0.15
0.1
0.05
0
0.45
0.5
0.55
0.6 0.65 Shear Stress
0.7
0.75
0.8
Fig. 7 The figure shows convergence of the PDF of shear stresses „cgs units… as the level of interpolation is increased. The relatively long tail in the PDF is a manifestation of the plateau in Fig. 3.
The mean aneurysm radius is 4.0 mm and is uniformly distributed between 3.7 mm and 4.3 mm. The blood flow velocity depends on the state of the individual. Activities such as walking, sitting, standing, sleeping, and running have different flow rates associated with them. Uncertainty can occur due to physiological factors, as well as the absence of prior knowledge about how the subject spends his time. Based on the individual, the PDF of activities, and hence the blood flow rate, will change. For example, a construction worker might spend equal amount of time walking, standing, and sleeping, whereas a software engineer might spend most of his time sitting. While our framework can use data, if available, about the habits of a particular subject, we restrict ourselves to perform two representative studies here: 共a兲 a uniform PDF of inlet velocities for subjects with a labor-intensive workhabit in which all velocities in the range are assumed to be equiprobable, v = U共0.8¯v , 1.2¯v兲 and 共b兲 a Gaussian distribution of inlet velocities for subjects with a sedentary lifestyle in which a mean value is assumed to be the most probable, with some variation v = N共¯v , 0.2¯v2兲. v represents inflow velocity and ¯v, the mean velocity, is chosen from literature 关52兴. The analytical PDFs in 共a兲 and 共b兲 were chosen in the spirit of elucidating our technique and its applicability rather than being representative of the actual variations in the blood flow rate for human subjects. The input PDFs are chosen so that both have the same mean and range. For more complex input data, maximum entropy techniques can be used to compute the input distribution 关25兴. A two-dimensional Smolyak sparse grid using Gauss–Lobatto– Chebyshev points is constructed. Inflow velocities and carotid radius are assigned to each grid point and the Navier–Stokes equations are solved. The mean shear stress over the carotid sinus is extracted every 10 timesteps during the last simulated cardiac cycle. Figure 8 illustrates the variation of the shear stress over the stochastic space. Plots of the variation of the blood flow velocity due to uncertainties in the geometry and boundary conditions for Table 1 The confidence intervals on shear stresses for the AAA problem corresponding to different confidence levels CL CI 共g / cm s2兲
90 关0.46,0.57兴
95 关0.46,0.62兴
99 关0.46,0.765兴
Journal of Biomechanical Engineering
99.9 关0.46,0.81兴
the carotid artery are shown in Fig. 9. We also performed a sensitivity analysis by computing the gradients of the interpolating Lagrange polynomials, as shown in Fig. 10. The shear stress shows positive sensitivity with respect to velocity and predominantly negative sensitivity to the radius owing to regions of recirculation. However, they are of a similar order of magnitude meaning that they are equally important stochastic dimensions. The output PDFs corresponding to both the inlet PDFs are shown in Fig. 11. The shape of the output PDF is quite different for the two cases since the Gaussian case represents more information 共mean and standard deviation兲 than a uniform distribution 共no information兲. Table 2 shows the confidence intervals corresponding to the PDFs shown in Fig. 11. As expected, the Gaussian PDF has tighter confidence intervals, which means that the more information we have about the inputs, the higher the confidence on the outputs. For the uniform distribution, there is an almost linear variation in the confidence intervals. Further, the adaptive algorithm was performed with ⑀ = 0.1. The choice of ⑀ depends on the maximum value of the output stochastic variable that is computed. We choose ⑀ to be less than 1% of the maximum value. A comparison of the reduction in grid points is shown in Fig. 12. For a level 4 sparse grid, 65 points are required for Smolyak sparse grid, while only 46 points are required for the adaptive sparse grid. Similarly, for a level 5 sparse grid, 145 points are necessary for a conventional sparse grid, while 73 points were required for the adaptive sparse grid. There is roughly a 50% reduction in the number of collocation points using the adaptive strategy. 4.3 Uncertainty in Patient-Specific Model of the Fontan Surgery. The Fontan surgery is performed to treat children with single ventricle heart defects. These defects are uniformly fatal if left untreated, as they leave a patient with only one functioning ventricle. Palliation usually requires three surgeries starting immediately after birth, and culminating in a Fontan procedure. The IVC and SVC are connected to the pulmonary arteries, resulting in a total cavo-pulmonary connection 共TCPC兲 关53兴. The Fontan surgery has been widely studied using computations, and quantities such as energy loss and wall shear stress have been extracted 关54,55兴. We have previously performed detailed simulations of Fontan hemodynamics at rest and exercise conditions and have extracted multiple parameters including wall shear stress, energy MARCH 2011, Vol. 133 / 031001-7
Fig. 8 Comparison of stochastic space representation of the wall shear stress in cgs units using „left… depth of interpolation 3 and „right… depth of interpolation 4
(cm/s)
�����
�����
Fig. 9 Plots of the magnitude of blood velocity in the carotid artery at four points in the stochastic space „from left… 1 , 2 = „0.5, 0…, „0.5, 1…, „0,0.5…, and „0,1…, where the first coordinate represents the stochastic velocity dimension and the second represents the stochastic radius dimension. The results were computed at t = 0.923 s.
efficiency, pressure levels, and flow distribution 关9,10,12兴. We have also evaluated alternate surgical designs, such as a Y-graft design that improved hemodynamic performance in a single patient-specific model. There are a number of uncertain parameters that should be evaluated to perform a comprehensive assessment of Fontan simulation output sensitivity. In this example, we choose to focus on the LPA/RPA flow-split as an illustration of the potential of the stochastic collocation method. The flow-split between the LPA and the RPA is an important factor that determines the hemodynamics. In healthy subjects, the flow-split can change with exercise conditions, age 关56兴, and other physiologic factors. It has been reported that the pulmonary artery geometry can influence how the flow-split changes with increasing levels of exercise. In small patients, using PC-MRI to measure flow in the LPA and RPA can be challenging and subject to variability. Due to a combination of these factors, we assume the flow-split between RPA and LPA to vary from 70–30% to 40–60%, based on previous studies examining changes in flow-split. Here, we present a computational technique to efficiently compute the relationship between flow-split and both the energy efficiency and pressure drop
�����
�����
Fig. 10 The figure shows sensitivities of the wall shear stress to input uncertainties which is positive with velocity „left… / 2 and negative with radius „right… / 1. Contours illustrate similar order of magnitude of the sensitivity of wall shear stress to input parameters.
031001-8 / Vol. 133, MARCH 2011
Transactions of the ASME
PDF
PDF
τ
�
g � cm s2
τ
�
g � cm s2
Fig. 11 A comparison of PDF of mean shear stress across the aneurysm using „left… a uniform PDF for velocity and „right… a Gaussian PDF for velocity
from the IVC to the LPA. We show that the stochastic collocation technique can be performed in a realistic time-frame with patientspecific models of the TCPC. A patient-specific Fontan model geometry was generated directly from MRI image data 关12兴. Flow rates are chosen to simulate resting flow conditions of the patient. Pulsatile inflow rates were acquired from patient-specific PC-MRI data and a respiratory model was superimposed. A parabolic velocity profile is imposed at the inferior vena cava 共IVC兲 and superior vena cava 共SVC兲 inlets. A three element Windkessel model 共RCR兲 关57兴 was used to enforce downstream boundary conditions. This is a lumped pa-
rameter model, and is implemented in the Finite element solver using a coupled multidomain method. Initial RCR parameters were chosen to produce a 55%–45% flow-split between the left and right pulmonary arteries. The flow-split is assumed to be a Gaussian distribution with mean 55% and standard deviation of 5%. To produce a 3 flow-split variation on either side of the mean, a Gaussian stochastic space with the flow-split varying between 40–60% and 70–30% was chosen. The desired flow-splits were achieved by adjusting the RCR parameters as explained below. The lumped parameter RCR equations at the outlets in the model are given by
Table 2 Confidence intervals on the shear stresses for the carotid artery bifurcation problem for different confidence levels 90 关4.4,19.6兴 关7.9,13.6兴
95 关4.1,20.2兴 关7.4,14.3兴
99 关3.8,21.0兴 关6.9,15.0兴
99.9 关3.6,21.5兴 关6.8,17.5兴
1
0.9
0.9
0.8
0.8
0.7
0.7
0.6
0.6 2
1
0.5
0.4
0.3
0.3
0.2
0.2
0.1
0.1
0.1
0.2
0.3
0.4
0.5
ξ
0.6
1
0.7
0.8
0.9
1
共2兲
0.5
0.4
0 0
pin Qin = pout + 共R1 + R2兲Qin + R1R2 t t
where pin and pout represent the inlet and outlet pressures in the domain downstream of the outlets, Qin is the flow leaving the outlet, R1 and R2 are resistances, and C is the capacitance of the
ξ
ξ2
CL CI 共uniform, g / cm s2兲 CI 共Gaussian, g / cm s2兲
pin + R2C
0 0
0.2
0.4
ξ1
0.6
0.8
1
Fig. 12 The figure shows „left… an adaptive Chebyshev–Gauss–Lobatto grid and „right… a conventional sparse grid for the Carotid artery bifurcation problem. The adaptive method reduces the number of required simulations by roughly 50%.
Journal of Biomechanical Engineering
MARCH 2011, Vol. 133 / 031001-9
mean velocity
a
� cm � s
std.of velocity
b
c
d
Fig. 13 The figure shows mean flow velocities for the Fontan patient with uncertainty in flow-split. The plots show mean velocities at „top left… t = 0.0, „top right… t = 0.81, „bottom left… t = 1.62, and „bottom right… t = 2.43 s. The period of the respiratory cycle is 2.86 s
Windkessel model. ˆ = kQ where k The flow through the outlet is modified as Q = N共1 , 0.052兲 is chosen from the flow-split to be simulated. To maintain the same pressures, one choice is to modify the resistances as follows: pin + Rˆ2C
pin Qin = pout + k共Rˆ1 + Rˆ2兲Qin + kRˆ1Rˆ2 t t
共3兲
Comparing Eqs. 共2兲 and 共3兲, we have kRˆ1Rˆ2 = R1R2 ⬅ C0 and k共Rˆ1 + Rˆ2兲 = 共R1 + R2兲 ⬅ C1. Solving, we obtain C1 ⫾ 冑C21 − 4kC0 Rˆ2 = 2k 共4兲
C1 ⫿ 冑C21 − 4kC0 Rˆ1 = 2k
Thus, the uncertainty in flow-split is transformed into uncertainties in the boundary resistances, Rˆ1 and Rˆ2. Stochastic collo-
0.8
0.14
Probability density function
Probability density function
0.7
0.4
0.3
0.2
d
0.12
0.1
0.08
0.06
0.04
0.02
0.1
0 0.95
c
cation points based on the Chebyshev grid are chosen in the 关0,1兴 interval and transformed to 关⫺2.57,2.57兴 共corresponding to 关0.01,0.99兴 in the Chebyshev grid兲 using inverse Gaussian CDF. This is mapped to the flow-split from which k values are computed. The resistance values are computed from k using the equations described above. The Navier–Stokes solver was used for computing the velocity and pressure fields. A grid containing over 1,000,000 elements was employed using adaptive meshing with a time step size of 0.002 s and a total run time of two respiratory cycles. The size was chosen so that the finite element results do not change with further increase in grid resolution. The results were gathered over the final respiratory cycle. A single simulation took about 3 h to complete using 96 AMD processors in parallel. Figure 13 shows the mean flow velocities computed using level-4 sparse grid interpolation. We show the results with level-4 since the results from level-5 were almost the same. Figure 14 shows the standard deviation of velocities computed using the sparse grid collocation technique. Since the uncertainties are defined on boundary resistances, the standard deviation propagates from the boundary to the center. During the period of retrograde flow in the IVC, the standard deviation of velocities propagates back to the IVC as depicted at t = 2.43 in Fig. 14. However, it is 0 0.16
0.5
b
s
Fig. 14 The figure shows standard deviation of flow velocities for the Fontan patient with uncertainty in flow-split. The plots show standard deviations at „top left… t = 0.0, „top right… t = 0.81, „bottom left… t = 1.62, and „bottom right… t = 2.43 s.
0.9
0.6
a
� cm �
0.952
0.954
0.956
0.958
0.96
efficiency
0.962
0.964
0.966
0.968
0.97
0 0.75
1.125
1.5
1.875
2.25
∆ P (mm Hg)
2.625
3.0
3.375
Fig. 15 The figure shows „left… PDF of hemodynamic efficiency and „right… PDF of pressure difference between the IVC and the LPA using level-4 sparse grid collocation
031001-10 / Vol. 133, MARCH 2011
Transactions of the ASME
Table 3 Confidence intervals on the pressure difference between IVC and the LPA in mm Hg CL CI ⌬p 共mm Hg兲
90 关1.68,2.48兴
95 关1.67,2.56兴
99 关1.57,2.81兴
99.9 关1.48,2.93兴
in the SVC at all times. Figure 15 shows PDFs of energy efficiency and pressure drop between the IVC and the LPA 共⌬p兲. We observe that the efficiency is not very sensitive to the flow-split. One reason for this observation might be that the efficiency is computed by summing the flow energies at all outlets, so rebalancing the flow has little effect. These variations are very small compared with the differences in efficiency between competing designs for the TCPC evaluated in our previous work 关12兴. In contrast, ⌬p computed at t = 0.81 shows a large sensitivity to the flow-split, and confidence intervals on ⌬p are summarized in Table 3. The computed CIs are more than 1 mm Hg and are large enough that they could lead to a different clinical decision from one end of the range to the other. We therefore conclude that uncertainty in flow-split have a non-negligible effect on the ⌬p between the IVC and the LPA. Uncertainty in the overall 共IVC + SVC兲 LPA/RPA flow-split will also influence predictions of IVC flow distribution to the LPA and RPA. This will influence the concentration of the hepatic factor that has been shown in clinical studies to impact normal lung development 关58兴. The distribution of the IVC flow is known to differ significantly from the overall flow distribution 关59兴. This work demonstrates that the required accuracy of the input data for Fontan simulations depends on what output quantity is being computed. However, this study was conducted assuming the IVC and SVC inflow velocities are known deterministically, and the reconstructed geometry is exact. A more extensive study could be performed to rank multiple output parameters according to sensitivity with respect to multiple input uncertainties.
5
Discussion
We have presented a generally applicable computational technique for incorporating uncertainties in hemodynamic simulations. Using the sparse grid collocation technique, we choose collocation points and interpolates in the stochastic space and perform a carefully chosen set of cardiovascular simulations. Further, we developed a new adaptive technique using Lagrange polynomials to reduce the number of required simulations, cutting down the overall computational cost by as much as 50%. We showed the applicability of the technique to three problems with different sources of uncertainties in 共a兲 geometry, 共b兲 inlet velocity, and 共c兲 flow-split. Convergence was shown with increasing depths of interpolation in the stochastic space. Confidence bounds as well as PDFs were constructed for variables of interest. Shear stresses were studied across the aneurysm in an idealized AAA model and across the sinus in an idealized carotid bifurcation model. In the AAA problem, the 99% CI has almost a 30% variation around the mean value of WSS. In the carotid artery bifurcation problem, the sensitivity of shear stresses due to velocities was significantly higher than that due to uncertainties in the geometry. In both of these problems, uncertainty quantification plays an important role and outputs were very sensitive to input uncertainties. Uncertainties need to be accounted for if the actual input variability is close to what was used in this work. For the patient-specific Fontan problem, the energy efficiency was quite robust to variability in flow-split. However, the pressure difference between IVC and LPA showed significant variability. Additional patients should be evaluated so that a comprehensive ranking of multiple parameter sensitivities can be made. This work demonstrates a promising approach that offers a systematic and efficient method to quantify uncertainties in cardioJournal of Biomechanical Engineering
vascular simulations. This method has the potential to replace current “trial and error” sensitivity analyses by using a unified framework with sound mathematical convergence theory.
6
Limitations and Future Work
The technique presented in this work shows significant promise to be extended to robust design problems, i.e., problems in which the design cost is stable to small fluctuations in the problem parameters. We plan to couple these methods with a framework we have developed for cardiovascular optimization 关60,61兴. In addition to characterizing PDFs, we will use the technique to evaluate sensitivities and robustness of problem parameters. These will hopefully result in a better trust of simulation results that will eventually lead to adoption of these tools in the clinical setting. In the future, the adaptive stochastic collocation method could be applied to a wide range of cardiovascular simulations and other complex flow problems. One limitation in this paper is that we use simple PDF models for input uncertainties. In the future, we plan to build realistic models for input uncertainties using data-driven techniques such as maximum entropy 关25兴. We have only examined two uncertain inputs. We plan to evaluate more sources, which will significantly increase computational cost. Another limitation is when there are flow transitions or bifurcation regions in the stochastic space, which cannot be captured using Lagrange interpolates. Wavelet interpolates may be a better choice to resolve such local regions of sharp variations 关62兴 and is an area of ongoing research. In our simulations, we assume that the walls are rigid, and we plan to perform FSI simulations with uncertainties in material properties.
Acknowledgment The work was supported by an American Heart Association Beginning Grant in Aid award and Burroughs Wellcome Fund Career Award at the Scientific Interface. We wish to thank the Simvascular open source project 共simtk.org 关33兴兲, CVSim, Dr. Nathan Wilson, and Dr. Charles Taylor for software resources and expertise. We would like to thank Jeff Feinstein, M.D. for his expertise and discussion on the Fontan example.
References 关1兴 Ku, J. P., Draney, M. T., Arko, F. R., Lee, W. A., Chan, F. P., Pelc, N. J., Zarins, C. K., and Taylor, C. A., 2002, “In Vivo Validation of Numerical Prediction of Blood Flow in Arterial Bypass Grafts,” Ann. Biomed. Eng., 30共6兲, pp. 743–752. 关2兴 Leuprecht, A., Perktold, K., Prosi, M., Berk, T., Trubel, W., and Schima, H., 2002, “Numerical Study of Hemodynamics and Wall Mechanics in Distal Endto-Side Anastomoses of Bypass Grafts,” J. Biomech., 35共2兲, pp. 225–236. 关3兴 Perktold, K., Leuprecht, A., Prosi, M., Berk, T., Czerny, M., Trubel, W., and Schima, H., 2002, “Fluid Dynamics, Wall Mechanics, and Oxygen Transfer in Peripheral Bypass Anastomoses,” Ann. Biomed. Eng., 30共4兲, pp. 447–460. 关4兴 Steele, B. N., Draney, M. T., Ku, J. P., and Taylor, C. A., 2003, “InternetBased System for Simulation-Based Medical Planning for Cardiovascular Disease,” IEEE Trans. Inf. Technol. Biomed., 7共2兲, pp. 123–129. 关5兴 Wilson, N., Arko, F. R., and Taylor, C. A., 2004, “Medical Image Computing and Computer-Assisted Intervention,” Lect. Notes Comput. Sci., 3217, pp. 422–429. 关6兴 Milner, J. S., Moore, J. A., Rutt, B. K., and Steinman, D. A., 1998, “Hemodynamics of Human Carotid Artery Bifurcations: Computational Studies With Models Reconstructed From Magnetic Resonance Imaging of Normal Subjects,” J. Vasc. Surg., 28共1兲, pp. 143–156. 关7兴 Tang, B. T., Cheng, C. P., Draney, M. T., Wilson, N. M., Tsao, P. S., Herfkens, R. J., and Taylor, C. A., 2006, “Abdominal Aortic Hemodynamics in Young Healthy Adults at Rest and During Lower Limb Exercise: Quantification Using Image-Based Computer Modeling,” Am. J. Physiol. Heart Circ. Physiol., 291共2兲, pp. H668–H676. 关8兴 Taylor, C. A., Hughes, T. J. R., and Zarins, C. K., 1998, “Finite Element Modeling of Three-Dimensional Pulsatile Flow in the Abdominal Aorta: Relevance to Atherosclerosis,” Ann. Biomed. Eng., 26共6兲, pp. 975–987. 关9兴 Marsden, A. L., Vignon-Clementel, I. E., Chan, F. P., Feinstein, J. A., and Taylor, C. A., 2007, “Effects of Exercise and Respiration on Hemodynamic Efficiency in CFD Simulations of the Total Cavopulmonary Connection,” Ann. Biomed. Eng., 35共2兲, pp. 250–263. 关10兴 Marsden, A. L., Bernstein, A. J., Spilker, R. L., Chan, F. P., Taylor, C. A., and Feinstein, J. A., 2007, “Large Differences in Efficiency Among Fontan Patients Demonstrated in Patient Specific Models of Blood Flow Simulations,” Circu-
MARCH 2011, Vol. 133 / 031001-11
lation, 116共16兲, pp. 480–480. 关11兴 Bove, E. L., de Leval, M. R., Migliavacca, F., Guadagni, G., and Dubini, G., 2003, “Computational Fluid Dynamics in the Evaluation of Hemodynamic Performance of Cavopulmonary Connections After the Norwood Procedure for Hypoplastic Left Heart Syndrome,” J. Thorac. Cardiovasc. Surg., 126共4兲, pp. 1040–1047. 关12兴 Marsden, A. L., Bernstein, A. D., Reddy, V. M., Shadden, S., Spilker, R., Chan, F. P., Taylor, C. A., and Feinstein, J. A., 2009, “Evaluation of a Novel Y-Shaped Extracardiac Fontan Baffle Using Computational Fluid Dynamics,” J. Thorac. Cardiovasc. Surg., 137, pp. 394–403. 关13兴 LaDisa, J. F., Guler, I., Olson, L. E., Hettrick, D. A., Kersten, J. R., Warltier, D. C., and Pagel, P. S., 2003, “Three-Dimensional Computational Fluid Dynamics Modeling of Alterations in Coronary Wall Shear Stress Produced by Stent Implantation,” Ann. Biomed. Eng., 31共8兲, pp. 972–980. 关14兴 LaDisa, J. F., Olson, L. E., Molthen, R. C., Hettrick, D. A., Pratt, P. F., Hardel, M. D., Kersten, J. R., Warltier, D. C., and Pagel, P. S., 2005, “Alterations in Wall Shear Stress Predict Sites of Neointimal Hyperplasia After Stent Implantation in Rabbit Iliac Arteries,” Am. J. Physiol. Heart Circ. Physiol., 288共5兲, pp. H2465–H2475. 关15兴 LaDisa, J. F., Olson, L. E., Douglas, H. A., Warltier, D. C., Kersten, J. R., and Pagel, P. S., 2006, “Alterations in Regional Vascular Geometry Produced by Theoretical Stent Implantation Influence Distributions of Wall Shear Stress: Analysis of a Curved Coronary Artery Using 3D Computational Fluid Dynamics Modeling,” Biomedical Engineering Online. 关16兴 Moore, J. A., Steinman, D. A., and Ethier, C. R., 1997, “Computational Blood Flow Modelling: Errors Associated With Reconstructing Finite Element Models From Magnetic Resonance Images,” J. Biomech., 31, pp. 179–184. 关17兴 Moore, J. A., Steinman, D. A., Holdsworth, D. W., and Ethier, C. R., 1999, “Accuracy of Computational Hemodynamics in Complex Arterial Geometries Reconstructed From Magnetic Resonance Imaging,” Ann. Biomed. Eng., 27, pp. 32–41. 关18兴 Moyle, K. R., Antiga, L., and Steinman, D. A., 2006, “Inlet Conditions for Image-Based CFD Models of the Carotid Bifurcation: Is It Reasonable to Assume Fully-Developed Flow,” ASME J. Biomech. Eng., 128共3兲, pp. 371– 379. 关19兴 Lee, S. W., and Steinman, D. A., 2007, “On the Relative Importance of Rheology for Image-Based CFD Models of the Carotid Bifurcation,” ASME J. Biomech. Eng., 129共2兲, pp. 273–278. 关20兴 Ghanem, R. G., and Spanos, P. D., 1991, Stochastic Finite Elements: A Spectral Approach, Springer-Verlag, New York. 关21兴 Xiu, D., and Karniadakis, G. E., 2002, “Modeling Uncertainty in Steady State Diffusion Problems via Generalized Polynomial Chaos,” Comput. Methods Appl. Mech. Eng., 191, pp. 4927–4948. 关22兴 Najm, H. N., 2009, “Uncertainty Quantification and Polynomial Chaos Techniques in Computational Fluid Dynamics,” Annu. Rev. Fluid Mech., 41, pp. 35–52. 关23兴 Xiu, D., and Hesthaven, J. S., 2005, “High Order Collocation Methods for the Differential Equation With Random Inputs,” J. Sci. Comput., 27, pp. 1118– 1139. 关24兴 Babuska, I., Nobile, F., and Tempone, R., 2007, “A Stochastic Collocation Method for Elliptic Partial Differential Equations With Random Input Data,” SIAM J. Num. Anal., 45共3兲, pp. 1005–1034. 关25兴 Sankaran, S., and Zabaras, N., 2006, “A Maximum Entropy Approach for Property Prediction of Random Microstructures,” Acta Mater., 54共8兲, pp. 2265–2276. 关26兴 Loève, M., 1977, Probability Theory, 4th ed., Springer-Verlag, Berlin. 关27兴 Klimke, A., 2006, “Uncertainty Modeling Using Fuzzy Arithmetic and Sparse Grids,” Ph.D. thesis, Universitt Stuttgart, Shaker Verlag, Aachen. 关28兴 Ganapathysubramanian, B., and Zabaras, N., 2007, “Sparse Grid Collocation Schemes for Stochastic Natural Convection Problems,” J. Comput. Phys., 225, pp. 652–685. 关29兴 Klimke, A., 2006, “Sparse Grid Interpolation Toolbox Users Guide,” IANS Report No. 2006/001. 关30兴 Gerstner, T., and Griebel, M., 1998, “Numerical Integration Using Sparse Grids,” Numer. Algorithms, 18, pp. 209–232. 关31兴 Müller, J., Sahni, O., Li, X., Jansen, K. E., Shephard, M. S., and Taylor, C. A., 2005, “Anisotropic Adaptive Finite Element Method for Modeling Blood Flow,” Comput. Methods Biomech. Biomed. Eng., 8共5兲, pp. 295–305. 关32兴 Wilson, N., Wang, K., Dutton, R., and Taylor, C. A., 2001, “A Software Framework for Creating Patient Specific Geometric Models From Medical Imaging Data for Simulation Based Medical Planning of Vascular Surgery,” Lect. Notes Comput. Sci., 2208, pp. 449–456. 关33兴 Schmidt, J. P., Delp, S. L., Sherman, M. A., Taylor, C. A., Pande, V. S., and Altman, R. B., 2008, “The Simbios National Center: Systems Biology in Motion,” Proc. IEEE, 96共8兲, pp. 1266–1280. 关34兴 Taylor, C. A., Hughes, T. J. R., and Zarins, C. K., 1997, “Finite Element Modeling of Blood Flow in Arteries,” Comput. Methods Appl. Mech. Eng., 158共1–2兲, pp. 155–196. 关35兴 Jansen, K. E., Whiting, C. H., and Hulbert, G. M., 2000, “A GeneralizedAlpha Method for Integrating the Filtered Navier Stokes Equations With a Stabilized Finite Element Method,” Comput. Methods Appl. Mech. Eng., 190共3–4兲, pp. 305–319. 关36兴 Vignon-Clementel, I. E., Figueroa, C. A., Jansen, K. E., and Taylor, C. A., 2006, “Outflow Boundary Conditions for Three-Dimensional Finite Element Modeling of Blood Flow and Pressure in Arteries,” Comput. Methods Appl. Mech. Eng., 195, pp. 3776–3796.
031001-12 / Vol. 133, MARCH 2011
关37兴 Ma, X., and Zabaras, N., 2009, “An Adaptive Hierarchical Sparse Grid Collocation Algorithm for the Solution of Stochastic Differential Equations,” J. Comput. Phys., 228共8兲, pp. 3084–3113. 关38兴 Lipnikov, K., and Vassilevski, Y., 2006, “Analysis of Hessian Recovery Methods for Generating Adaptive Meshes,” Proceedings of the 15th International Meshing Roundtable, Springer, Berlin. 关39兴 Lasheras, J., 2007, “The Biomechanics of Arterial Aneurysms,” Annu. Rev. Fluid Mech., 39, pp. 293–319. 关40兴 Wilson, N., Wang, K., Dutton, R., and Taylor, C. A., 2005, “Changes in the Hemodynamic Stresses Occurring During the Enlargement of Abdominal Aortic Aneurysms,” Ph.D. thesis, University of California, San Diego, San Diego, CA. 关41兴 Wurzinger, L. J., Blasberg, P., and Schmid-Schonbein, H., 1985, “Towards a Concept of Thrombosis in Accelerated Flow: Rheology, Fluid Dynamics, and Biochemistry,” Biorheology, 22, pp. 437–449. 关42兴 Egelhoff, C. J., Budwig, R. S., Elger, D. F., Khraishi, T. A., and Johansen, K. H., 1999, “Model Studies of the Flow in Abdominal Aortic Aneurysms During Resting and Exercise Conditions,” J. Biomech., 32共12兲, pp. 1319–1329. 关43兴 Salsac, A. V., Sparks, S. R., and Lasheras, J. C., 2004, “Hemodynamic Changes Occurring During the Progressive Enlargement of Abdominal Aortic Aneurysms,” Ann. Vasc. Surg., 18共1兲, pp. 14–21. 关44兴 Taylor, T. W., and Yamaguchi, T., 1994, “Three-Dimensional Simulation of Blood Flow in an Abdominal Aortic Aneurysm: Steady and Unsteady Flow Cases,” ASME J. Biomech. Eng., 116共1兲, pp. 89–97. 关45兴 Raghavan, M. L., Vorp, D. A., Federle, M. P., Makaroun, M. S., and Webster, M. W., 2000, “Wall Stress Distribution on Three-Dimensionally Reconstructed Models of Human Abdominal Aortic Aneurysm,” J. Vasc. Surg., 31共4兲, pp. 760–769. 关46兴 Scotti, C. M., and Finol, E. A., 2007, “Compliant Biomechanics of Abdominal Aortic Aneurysms: A Fluid-Structure Interaction Study,” Comput. Struct., 85共11–14兲, pp. 1097–1113. 关47兴 Leung, J. H., Wright, A. R., Cheshire, N., Crane, J., Thom, S. A., Hughes, A. D., and Xu, Y., 2006, “Fluid Structure Interaction of Patient Specific Abdominal Aortic Aneurysms: A Comparison With Solid Stress Models,” Biomedical Engineering Online. 关48兴 Shadden, S. C., and Taylor, C. A., 2008, “Characterization of Coherent Structures in the Cardiovascular System,” Ann. Biomed. Eng., 36共7兲, pp. 1152– 1162. 关49兴 Zarins, C. K., Giddens, D. P., Bharadvaj, B. K., Sottiurai, V. S., Mabon, R. F., and Glagov, S., 1983, “Carotid Bifurcation Atherosclerosis. Quantitative Correlation of Plaque Localization With Flow Velocity Profiles and Wall Shear Stress,” Circ. Res., 53, pp. 502–514. 关50兴 Ku, D. N., Giddens, D. P., Zarins, C. K., and Glagov, S., 1985, “Pulsatile Flow and Atherosclerosis in the Human Carotid Bifurcation. Positive Correlation Between Plaque Location and Low Oscillating Shear Stress,” Arterioscler., Thromb., Vasc. Biol., 5, pp. 293–302. 关51兴 Thomas, J. B., Milner, J. S., Rutt, B. K., and Steinman, D. A., 2003, “Reproducibility of Image-Based Computational Fluid Dynamics Models of the Human Carotid Bifurcation,” Ann. Biomed. Eng., 31, pp. 132–141. 关52兴 Marshall, I., Papathanasopoulou, P., and Wartolowksa, K., 2004, “Carotid Flow Rates and Flow Division at the Bifurcation in Healthy Volunteers,” Physiol. Meas, 25共3兲, pp. 691–697. 关53兴 Migliavacca, F., Kilner, P. J., Pennati, G., Dubini, G., Pietrabissa, R., Fumero, R., and de Leval, M. R., 1999, “Computational Fluid Dynamic and Magnetic Resonance Analyses of Flow Distribution Between the Lungs After Total Cavopulmonary Connection,” IEEE Trans. Biomed. Eng., 46共4兲, pp. 393–399. 关54兴 Whitehead, K. K., Pekkan, K., Kitajima, H. D., Paridon, S. M., Yoganathan, A. P., and Fogel, M. A., 2007, “Nonlinear Power Loss During Exercise in SingleVentricle Patients After the Fontan—Insights From Computational Fluid Dynamics,” Circulation, 116共11兲, pp. I165–I171. 关55兴 Dasi, L. P., Pekkan, K., Katajima, H. D., and Yoganathan, A., 2008, “Functional Analysis of Fontan Energy Dissipation,” J. Biomech., 41, pp. 2246– 2252. 关56兴 Cheng, C. P., Herfkens, R. J., Taylor, C. A., and Feinstein, J. A., 2005, “Proximal Pulmonary Artery Blood Flow Characteristics in Healthy Subjects Measured in an Upright Posture Using MRI: The Effects of Exercise and Age,” J. Magn. Reson Imaging, 21共6兲, pp. 752–758. 关57兴 Westerhof, N., Bosman, F., DeVries, C. J., and Noordergraaf, A., 1969, “Analogue Studies of the Human Systemic Arterial Tree,” J. Biomech., 2, pp. 121–143. 关58兴 Pike, N. A., Vricella, L. A., Feinstein, J. A., Black, M. D., and Reitz, B. A., 2004, “Regression of Severe Pulmonary Arteriovenous Malformations After Fontan Revision and “Hepatic Factor” Rerouting,” Ann. Thorac. Surg., 78, pp. 697–699. 关59兴 Marsden, A., Reddy, V., Shadden, S., Chan, F., Taylor, C., and Feinstein, J., 2010, “A New Multi-Parameter Approach to Computational Simulation for Fontan Assessment and Redesign,” Congenital Heart Disease, 5, pp. 104–117. 关60兴 Marsden, A. L., Feinstein, J. A., and Taylor, C. A., 2008, “A Computational Framework for Derivative-Free Optimization of Cardiovascular Geometries,” Comput. Methods Appl. Mech. Eng., 197共21–24兲, pp. 1890–1905. 关61兴 Sankaran, S., and Marsden, A. L., 2010, “A Method for Stochastic Constrained Optimization Using Derivative-Free Surrogate Pattern Search and Collocation?,” J. Comput. Phys., 229共12兲, pp. 4664–4682. 关62兴 Le Maître, O. P., Knio, O. M., Najm, H. N., and Ghanem, R. G., 2004, “Uncertainty Propagation Using Wiener–Haar Expansions,” J. Comput. Phys., 197共1兲, pp. 28–57.
Transactions of the ASME