satisfaction can be derived from a variety of commodity bundles. ... ence curves for quantities of pairs of three different goods: hats, pairs of shoes, and ... though, we should recognize that the degree of convexity was not great, and that some.
PSYCHOMETRIKA--VOL. 56, NO. 2, 279-307 JUNE 1991
A STOCHASTIC MULTIDIMENSIONAL SCALING PROCEDURE FOR THE EMPIRICAL DETERMINATION OF CONVEX INDIFFERENCE CURVES FOR PREFERENCE/CHOICE ANALYSIS WAYNE S. DESARBO DEPARTMENTS OF MARKETING AND STATISTICS SCHOOL OF BUSINESS THE UNIVERSITY OF MICHIGAN KAMEL JEDIDI GRADUATE SCHOOL OF BUSINESS COLUMBIA UNIVERSITY
JOEL H. STECKEL DEPARTMENT OF MARKETING STERN SCHOOL OF BUSINESS NEW YORK UNIVERSITY The vast majority of existing multidimensional scaling (MDS) procedures devised for the analysis of paired comparison preference/choice judgments are typically based on either scalar product (i.e., vector) or unfolding (i.e., ideal-point) models. Such methods tend to ignore many of the essential components of microeconomic theory including convex indifference curves, constrained utility maximization, demand functions, et cetera.This paper presents a new stochastic MDS procedure called MICROSCALE that attempts to operationalize many of these traditional microeconomic concepts. First, we briefly review several existing MDS models that operate on paired comparisons data, noting the particular nature of the utility functions implied by each class of models. These utility assumptions are then directly contrasted to those of microeconomic theory. The new maximum likelihood based procedure, MICROSCALE, is presented, as well as the technical details of the estimation procedure. The results of a Monte Carlo analysis investigating the performance of the algorithm as a number of model, data, and error factors are experimentally manipulated are provided. Finally, an illustration in consumer psychology concerning a convenience sample of thirty consumers providing paired comparisons judgments for some fourteen brands of over-the-counter analgesics is discussed. Key words: multidimensional scaling, paired comparisons data, maximum likelihood estimation, microeconomics, consumer psychology.
1. Introduction Psychometric procedures developed for the analysis of paired comparisons data typically attempt to utilize spatial models to display the structure in such data. Typically, one of two general classes of models have been utilized to represent such preference/choice data: vector and unfolding models. A vector or scalar products multidimensional scaling model (Slater, 1960; Tucker, 1960) represents subjects as vectors and objects as points in a T-dimensional space. The projection of object points onto subject vector(s) is assumed at least monotone with that subject's preferences. These analyses estimate both the subjects' vector directions and object coordinates in a prescribed Requests for reprints should be sent to Wayne S. DeSarbo, Departments of Marketing and Statistics, School of Business, University of Michigan, Ann Arbor, MI 48109-1234. 0033 -3123/91/0600-89130500.75/0 © 1991 The Psychometric Society
279
280
PSYCHOMETR1KA
dimensionality. Vector models have the property that preference or utility changes monotonically with all dimensions. That is, these models assume that if a certain amount of a dimension is good, even more must be better. (The iso-utility contours in two dimensions therefore are parallel straight lines perpendicular to a subject's vector.) Work by Bechtel, Tucker, and Chang (1971), Cooper and Nakanishi (1983), Carroll (1980), De Soete and Carroll (1983, 1986), and DeSarbo, Oliver, and De Soete (1986) present alternative probabilistic vector MDS models that operate on such paired comparisons data. The other major type of psychometric model used to represent such paired comparisons preference/choice data is the ideal-point or unfolding model. We will only discuss Coombs' (1964, pp. 80-119) simple unfolding model. Here, both subjects and objects are represented as points in a T-dimensional space. The points for the subjects represent ideal-points, or optimal sets of dimensional values. The farther a given object point is from a subject's ideal-point, the less utility that object provides to that subject. This notion of relative distance often assumes a Euclidean metric on the space implying that, in two dimensions, iso-utility contours are families of concentric circles centered at a subject's ideal-point. Carroll (1980) demonstrates that the vector model is a special case of this unfolding model where the ideal-point goes off to infinity. The goal in unfolding analysis is to estimate both the subjects' ideal-points and the coordinates for the objects in a prescribed dimensionality in some optimal fashion. Cooper and Nakanishi (1983), Schfnemann and Wang (1972), Wang, Schrnemann, and Rusk (1975), Zinnes and Griggs (1974), De Soete, Carroll, and DeSarbo (1986), De Soete and Carroll (1986), and DeSarbo, De Soete, and Eliashberg (1986) provide alternative probabilistic MDS unfolding models that operate on paired comparisons data. Most economists would be quite critical of the nature of the utility functions implied by both these vector and unfolding models. In the vector model, subjects have linear indifference or iso-utility curves that imply a constant rate of substitution (i.e., the amount of one dimension a subject will sacrifice to obtain a unit of a second is constant and independent of the amount of either dimension possessed by the object in question). In simple unfolding models, subjects possess circular (in two dimensions) indifference or iso-utility curves around their ideal point. This makes it possible for two object points: (cl, c2) and (dl, d2) to be equally preferred by a subject, where cl > dt and c2 > d2, and thus, the first object dominates the second object on both dimensions. In contrast, basic microeconomic theory assumes that subjects will have convex indifference curves with a decreasing marginal rate of substitution, where the amount of one dimension or characteristic a subject will sacrifice for one unit of a second is negatively related to the amount of the second characteristic already possessed (see Henderson & Quandt, 1984; Lancaster, 1971). Against this background, this paper develops a new multidimensional scaling procedure incorporating the microeconomic notion of convex subject preferences. The underlying model also incorporates recent developments in multidimensional scaling that allow for a translation of physical object attributes into derived object coordinates (e.g., DeSarbo & Rao, 1984, 1986). These two features described above, convex preferences and translation from physical attributes to perceptual characteristics, enable us to relate our procedure to Lancaster's (1966, I971) microeconomic theory of consumer demand. Hence, we call the procedure MICROSCALE. The next section briefly reviews basic concepts of utility theory in microeconomics including developments by Lancaster (I966, 1971). MICROSCALE is then described in terms of the model, maximum likelihood estimation, and program options. The results of a modest Monte Carlo analysis are discussed showing somewhat consistent algorithm performance over a number of different model, data, and error specifications. Finally, an application in
WAYNE S. DESARBO, KAMELJEDIDI, AND JOEL H. STECKEL
281
consumer psychology is provided where consumer preferences for some 14 brands of over-the-counter analgesics are analyzed by M I C R O S C A L E .
2.
Microeconomic Conceptualizations of Preference and Utility
We first briefly review the traditional microeconomic conceptualization of preferences and describe several standard regularity assumptions concerning them. In particular, we discuss the utility function and its relationship to preference orderings. Then, the problem of utility maximization subject to a budget constraint is presented in terms of traditional views on consumer behavior. Finally, we describe the L a n c a s t e r (1966, 1971) view of consumer behavior in terms of its differences from the traditional views. For the discussion that follows, we interchange the use of consumer with subject, and goods/services, commodities, or brands with objects. Traditional microeconomic theory pictures a consumer faced with possible consumption bundles in some set X*, his consumption set. A consumption/commodity bundle x is a collection of amounts of all goods and services consumed. If there are N goods and services in the e c o n o m y , then x is a vector o f real numbers [Xl, x2, • • • , XN]', where xj is the amount of the j - t h commodity consumed. Equivalently, x is a point in Euclidean N space. The following discussion is adapted from H e n d e r s o n and Quandt (1984), Varian (1984), and Russell and Wilkinson (1979).
Assumption 1: (Consumption Space).
The consumption space, X*, is the non-
negative Euclidean N-orthant. The consumer is assumed to have preferences over the various commodity bundles in X*. x >> y indicates bundle x is preferred to y, x - y indicates bundle x and y are equally preferred (consumer is indifferent), and y >> x indicates that bundle y is preferred to x. Weak preference relationship___s >> and _~ are similarly defined. We use - , >and ~ to designate less than or equal to, greater than or equal to, or not equal to, respectively, for specifying order relations between the amounts of all commodities between any pair of bundles.
Assumption 2: (Completeness).
F o r all x and y in X*, either x >>__y, or y ->__x, or
both.
Assumption 3: (Reflexivity).
For all x in X*, x >> x.
Assumption 4: (Transitivity). For all x, y, and z in X*, if x >> y, y >>__x, then x >__>z.
Assumption 5: (Continuity). For all y in X*, {x: x >__>y} and {x: x ~ y} are closed sets; or equivalently, {x: x >> y} and {x: x ~ y} are open sets. This fifth assumption is necessary to rule out certain discontinuous behavior; it says that, if (x i) is a sequence of consumption bundles that are all preferred to a bundle y and if this sequence converges to some bundle x*, then x* is preferred to y. The most important consequence o f continuity is that if y is strictly preferred to z and if x is a bundle that is close enough to y, then x must be strictly preferred to z.
Assumption 6: (Strong Monotonicity).
If x -> y and x # y, then x >> y.
282
PSYCHOMETRIKA
This states that more of a bundle is better than less. This is akin to the assumptions made in vector/scalar products MDS models. Note that ideal-point (finite) MDS models violate this assumption. Assumption 7: (Strict Convexity). Given x ~ y and z in X*, if x >>___z and y >_.>z, t h e n t x + (1 - t ) y > > z f o r a l l 0 < t < 1. Note that a lexicographic preference ordering violates strict convexity (Henderson & Quandt, 1984, p. 13). Thus, such preferences are not truly captured by the classical theory. In classical economic theory, one often summarizes a consumer's behavior by means of a utility function, that is, a continuous function u: X* ---> R such that x >> y if and only if u(x) > u(y). It can be shown that, if the preference ordering is complete, reflexive, transitive, and continuous, then it can be represented by some utility function. A utility function u(x) is often a very convenient way to describe preferences, but it may not have any coherent psychological interpretation (see Cooper, 1973, for distinctions between preference and utility). One relevant property of a utility function is its ordinal character. Thus, if u(x) represents some preferences and f: R ---> R is a monotonic, increasing function, then flu(x)) will represent exactly the same preferences since f(u(x)) > flu(y)) if and only if u(x) > u(y). Utility functions are usually graphically displayed with the help of indifference curves, or the sets of all consumption bundles that a consumer is indifferent between. One can think of indifference curves as being level sets of the utility function. The set of all bundles on or above an indifference curve, {x ~ X*: x >_>x0}, is called an upper contour set. A particular level of utility or satisfaction can be derived from a variety of commodity bundles. An indifference curve is thus defined as {x E X*lu(x) = u0} for some constant u0. Note, Assumption 5 guarantees that the derived indifference curves are continuous, while Assumption 7 guarantees that the derived indifference curves are convex to the origin. Convex indifference curves imply that a consumer has diminishing marginal rates of substitution (i.e., the amount of one commodity a consumer will substitute for another and keep the same level of utility is a decreasing function of the second commodity). In the basic problem of preference maximization, the set of feasible alternatives is just the set of all bundles that the consumer can afford. Let w be the fixed amount of money available to a consumer, and let p = (Pl . . . . , PN)' be the vector of prices of goods 1 . . . . , N. The set of affordable bundles, the budget set of the consumer, is given by:
S={x~X*:
p'x--> c. This set of outer boundary points, E, is called the e~ciencyfrontier. The solution to Lancaster's model is the point on the efficiency frontier that is tangent to an indifference curve if such exists. If not, the solution is a vertex of E, each of which is the image of a vertex in S. Lancaster (1971) shows that the combination of goods x* that corresponds to c* satisfy p'x* = w, and can be found through the following linear program: Min s.t.
p'x Bx = e*, x > - 0 .
We would be remiss if we did not point out that Lancaster's theory has its critics (Ladd & Zober, 1977). Three implicit assumptions have been questioned. First, Hendler (1975) suggests that the marginal utilities of certain characteristics may be negative. Second, Lucas (1975) and Hendler both suggest that consumption technologies may be nonlinear. Finally, Lucas and Hendler both argue that utility may not be independent
WAYNE S. DESARBO, KAMEL JEDIDI, AND JOEL H. STECKEL
285
of the characteristics' distribution across categories. For example, a consumer would prefer one combination of food to another with the same carbohydrates, protein, et cetera. If any or all of these criticisms apply, Lancaster's analysis may break down. In particular, the optimal c, may not be the point of tangency between an indifference curve and E, as defined earlier (Ladd & Zober, 1977). In MICROSCALE, physical attributes are translated into dimensions upon which consumers base their decisions. In Lancaster's model, goods are translated into characteristics upon which consumers base their decisions. Thus, there is a natural correspondence between MICROSCALE and Lancaster's model. Each takes an observable construct, a brand's physical attributes in MICROSCALE and a collection of goods in Lancaster's model, and transforms them into an unobservable one, dimensions in MICROSCALE and characteristics in Lancaster's model, which consumer's ultimately use. Our dimensions are somewhat different from Lancaster's characteristics. As Ratchford (1975) points out, Lancaster asserts that characteristics should be defined in terms of objective measurement and not people's reactions. In contrast, multidimensional scaling procedures (ours included) can focus on a consumer's perceptions or preferences as well as objective characteristics. Ratchford suggests that the vector model option in PREFMAP (Carroll, 1972) may be useful in empirical applications of Lancaster's theory. Such an approach, however, carries a number of limitations with respect to Lancaster's theory. First, as indicated earlier, the indifference curves are linear. Second, rotational indeterminacies in PREFMAP (and other two-way operationalizations of the vector model) inhibit the dividing by price in goods space. Therefore, construction of the efficiency frontier becomes impossible. In contrast, MICROSCALE not only has convex indifference curves, but also produces unique solutions in which all characteristics are positive ratio scales. Additionally, while Lancaster (and microeconomics in general) concerns himself with choice among bundles of different products, we focus on choice among different brands within a single product class. Finally, unlike Lancaster, MICROSCALE takes on a probabilistic form with a just noticeable difference term, similar in form to many economic random utility models of choice (see McFadden, 1976). 3.
The MICROSCALE Procedure
The Full MICROSCALE Model Let: i = 1, . . . , I consumers; j, k = 1 . . . . .
N brands;
t = 1, . . . , T dimensions;
~ijk= I
I if consumer i prefers brand j to k; 0 if consumer i is indifferent between brands jand k; - 1 if consumer i prefers brand k to j;
Xjt : the t-th coordinate for brand j, where Xjt > O; Uij : the latent utility derived from the choice of brand j by consumer i as described by a Cobb-Douglas formulation:
286
PSYCHOMETRIKA
T 1-I Xj~t" + eij,
a i
(i)
t=l
where:
a i : a multiplicative constant for consumer i, a i >-- 0 ; Otit " the t-th coordinate of the exponent for consumer i with: O ~ Otit 0 , ~'~t=l T flit = 1, and 0 < flit Uig + si), where si is a just-noticeable difference parameter (Thurstone, 1927), where
WAYNE S. DESARBO, KAMEL JEDIDI, AND JOEL H. STECKEL
=
dp ai
XTt"
--
Xkt"
-- Si
~ijk,
287
(3)
where ~ is the standard normal cdL The denominator vanishes since the variance term can be embedded in the a i and si terms. Similarly, P(subject i prefers brand k to j) = P ( 8 0 k = --1) = cI) al
Xkt" --
X)t
- si
=
P ( U i k 7> Uij + si) Uijk.
(4)
And P(consumer i is indifferent between brands j and k) = P(rijk = O) = P(IUij ---~ 1 -- g2_(t)
-
Uik{
< Si)
t'~_(2)
g2_(3)
'-'Uk -- '-'ijk = ,-'~k.
(5)
Note that we model a consumer specific just-noticeable threshold term, s i , which is a departure from Lancaster (1966, 1971). MICROSCALE assumes that consumers make choices that follow a random utility model (McFadden, 1976) with thresholds (Krishnan, 1977). Most utility based models of consumer choice assume that the decision makers always select the alternative that provides them with maximum utility. Accordingly, they have no problem recognizing differences in utilities, no matter how small. We take the view espoused by Lioukas (1984) who suggests that consumers may be insensitive to small differences and that certain thresholds have to be exceeded before the consumer notices a difference (the just-noticeable difference). In economics, an analogous notion was proposed by Quandt (1956) who argued that a band of indifference exists around the level of utility derived from a given quantity of a good. Small changes in the quantity will not affect utility. Later, Krishnan (1977) described thresholds as minimum perceivable differences between the utilities of choice alternatives. According to him, an individual would prefer one alternative to another only if the corresponding difference in utilities exceeded that threshold. We adopt this view in MICROSCALE. Finally, an important special case of the above model arises when data are collected as forced-choice paired comparisons. In that case, si is equal to zero and the last term in (5) vanishes. We note that, like Thurstone's Case V unidimensional scaling, MICROSCALE assumes strong stochastic transitivity. Estimation
Assuming independence over i, j, and k subscripts, the general form of the likelihood function is
288
PSYCHOMETRIKA 1
L
N
(2) - a~)t-2(3)1 -Isu~l FI F i l l ~(1)8~ ) G ijk J. Jt L .LL X V ijk ~'J ijk , i=1
(6)
j M since one can only identify at most N T coordinates (for X). Thus, in most a p p l i c a tions, such reparameterizations actually improve the degrees of freedom of the model by reducing the number of parameters to be estimated. Given I(N)(N - 1)/2 independent paired comparison judgments, the number of estimated model parameters in the full model (a i, s i , ait , X) is:
P=NT+I(T+
1 ) - 1.
Note, one of the benefits of MICROSCALE is the fact that one obtains an X configuration that is unique in the positive orthant of a T-dimensional space (there is no rotational indeterminacy as in competing models) up to a scale indeterminacy with the a i coefficients in the full model (one must set one of the ai's equal to 1).
Goodness-of-Fit Indicies A number of goodness-of-fit measures are computed for MICROSCALE. 1. A deviance measure (McCullagh & Nelder, 1983; Nelder & Wedderburn, 1972): D = - 2 In L. Note that one can potentially test nested models within MICROSCALE as the difference between respective deviance measures. One obvious problem with this approach concerns the presence of incidental parameters in the likelihood function (i.e., parameters whose order vary according to the order of A, such as the Otit'S) a s there are no within-subject replications. In such cases, maximum likelihood estimators may not be consistent. Other measures should also be examined. 2. The proportion of correct predictions in A. Here, the proportion of times the solution correctly predicts 8ijk is calculated using a simple matching coefficient for the total sample as well as for each subject. In addition, a Spearman's rho correlation coefficient between ~ijk and ~ijk, predicted choices, is also computed. 3. Akaike's (1974) information criterion defined as: - 2 In L + 2P. However, as noted by Bozdogan (1987), the AIC statistic tends to overestimate the appropriate dimensionality for certain models tested, emphasizing the need to examine multiple measures. 4. For situations where 8ij k contains no ties, a phi coefficient and point biserial correlation are also computed.
290
PSYCHOMETRIKA
Microeconomic Extensions Given the above MICROSCALE formulation, a number of interesting analogs to the microeconomic theory of the consumer are possible. For example, one can define a consumer's marginal utility with respect to a particular dimension of a specific brand as:
MUi(Xjt) = OXjt
OXjt ai I-I xjt" +eij t=l
T --=-a i o t i t g ; i'-I H gj~", l~.t
(11)
or in the case of reparameterizing X in terms of physical attributes:
MUi(Hjm) = O~lij = aio~it,YmtXai~ - 1 HT X j at, s. OHjm
(~2)
s~t
Of particular interest in each case is that marginal utility is a function of both consumer (i) and brand (j) (and/or its physical attribute (m)) parameters. With such notions of marginal utility, one could determine the marginal rate of substitution (MRS) that, in the case of product coordinates, is defined as the rate at which consumer i's consumption of dimension v can be reduced, without reducing his overall utility, when his consumption of dimension r is increased at the rate of an additional unit: OUij
MRS~i/
=
MUi(Xjr)
=
OXjr
- -
MUi(Xj~).~ OU0
(13)
oXj~ This is also equal to the negative of the slope of the derived indifference curve defined in this region. Given the strict convexity to the origin requirement of the indifference curves estimated by MICROSCALE, the marginal rate of substitution of dimension r for dimension v with respect to a change in the consumption of dimension r, along an indifference curve, is strictly decreasing. This implies the notion of a diminishing marginal rate of substitution, here defined for the dimensions. A similar extension can be derived for the physical attributes as in Lancaster (1966, 1971). As an analog to vector MDS models (e.g., MDPREF), one can also solve for individual specific preference vectors. For convenience, assume one consumer and two dimensions, where X is confined in the positive quadrant of a two dimensional space. Given the requirement of strict convexity to the origin of the resulting indifference curves, the direction or vector of increasing utility will necessarily have a 0°-90° orientation. The question is to find an exact orientation, which will necessarily vary according to the specific orientation of a consumer's indifference curve. Suppose we hold utility constant for a consumer and thus concentrate on one indifference curve. Then, the shortest ray from the origin to a point on that curve will define the direction of increasing preference. If one were to pick an alternative point, one could reorient a ray between the origin and that point in the direction of the point with the shortest distance, arid with that original (longer) distance attain a higher level of utility (on a higher indifference curve). A formal proof by contradiction can easily be shown on these grounds. Thus, we want to find the point (r 1 ,r z) that lies on some fixed or
WAYNES. DESARBO,KAMELJEDIDI, AND JOEL H. STECKEL
291
constant level of utility U* that is minimum distance or squared distance from the origin, where squared distance here is: d 2 = (rl
-
0) 2 +
(r2 -- 0) 2 = r~ + r 2.
(14)
Now
1-or I ,
U~(rl,r2) = air~'r 2
(15)
and solving for r l, we obtain
={ u,, .),,°, r,
\air~_~,
(16)
Substituting in (14), one obtains
d2=[~ a i r v,* ~_~
+ rZ2.
(17)
Taking derivatives of (17), setting them equal to zero, and solving for r2, gives
r~ = U*~ ( 1 - a l ~
a'/2
a-7/ \ - - - ' 7 - /
.
(18)
Substituting this in (16), we solve for r]
(
E~
)l/or,
r~ = \ a i r ~ l _ a 1
U~ [ o~1 ](I-a,)/2 = aU [ ~ J
(19)
Given (r] ,r~) for a specific indifference curve, one can now draw a ray from the origin to this point to indicate the direction of increasing utility--or what we call the preference expansion direction (PED). Given the fact that indifference curves for any consumer will be parallel, we can extend this ray to infinity to denote this direction for higher levels of utility (see also Grandmont, 1978, for an alternative vector formulation for the Cobb-Douglas utility function and interpretations relating to the elasticity of substitution). This formulation generalizes to T > 2 dimensions in a straightforward manner. Finally, we wish to discuss the remaining issue of utility maximization and optimal choice in the derived space. As mentioned, MICROSCALE will produce a configuration of brands/products (X), indifference c u r v e s (ait), and we can derive a PED (also, if X is reparameterized, we can also represent 7rot by direction vectors in the space emanating from the origin). Unlike traditional microeconomic theory, MICROSCALE analyses are typically performed for brands in a designated product class (X are brands in a/'-dimensional space) as opposed to vectors of commodities. As such, there is little sense to impose a budget constraint in MICROSCALE. For example, if the product class is over-the-counter analgesics, one typically assumes all are affordable given the rather small range of price variation. Instead, analogous to Lancaster's efficiency frontier, MICROSCALE can construct a technological feasibility frontier (TFF) defined as the outer boundary of the convex hull of the outer set of brand coordinates. Depending upon the product class and nature of the derived dimensions, this TFF can often be interpreted as a limit to the available technology with respect to the derived dimensions and the present set of brands studied. If, for the over-the-counter analgesics illustration, the dimensions relate directly to ingredients, the TFF could be utilized to define
292
PSYCHOMETRIKA TABL~ 1 Independent Variables UtiliTed in the MICROSCALE Monte Carlo Analysis I
Factor
III
II
Des't~amion
III
I
.........i' """i
""'i"
Levels
Code
10 Number of Consumers
II
30
X1 X2
10 15
x3 x4
20
Nmnber of Brands
w
in
Number of Dimensions
3 4
x5 X6 m
IV
V
Type of Threshold (si)
Amount of Error
Constant
X7
Varying
x8
O=1 O-- 2
o =3 VI
Error Distribution
X9 Xl0
Normal Uniform
Xl 1
Exponential
X12
VII
Type of Analysis
Extemal Internal
X 13
VIII
Starting Solution
Rational (SVD) Random
X14
existing limits on the amount of specific ingredients (e.g., the FDA limits the amount of aspirin per tablet that can be sold without a prescription). This notion may be more relevant for external preference analyses where the dimensions are known physical attributes. This convex hull can be easily constructed by splines whose knots are the brand locations of the outermost brands in the space. Given this convex hull approximation, the point of maximal feasible utility for an individual would be the point of intersection of his/her highest utility indifference curve and this TFF. 4.
Monte Carlo Analysis
To examine the performance of the procedure, a Monte Carlo analysis was performed as a number of data, model, and error factors were experimentally manipulated.
293
WAYNE S. DESARBO, KAMEL JEDIDI, AND JOEL H. STECKEL
TABLE 2 Dependent Measures Utilized in the MICROSCALE Monte Carlo Analysis '""%
"
,,, ,~,
,,
'"i
~
'
'"'
""""'
, ,,,,J
' "'
A. Computational Effort: YI: Number of iterations required for convergence. B. 6ijk Goodness-of-Fit: Y2: A matching coefficient of (~ijk' ~tik); Y3: Spearman rho correlation of (Sijk, ~ijk). C. Parameter Recovery for each of ~ 0~ and s_ Y4' Y5' Y6: Root mean square error (3 measures--X, 2, s); Y7' YS' Y9: Sum-of-squares accounted-for (3 measures--X, 2 , s).
Table 1 presents the list of some eight independent variables and their respective levels that were utilized in the Monte Carlo analysis. The dependent measures were defined around three major constructs: (a) computational effort, (b) overall goodness-of-fit with 6ijk, and (c) parameter recovery. Table 2 provides a list of the multiple dependent measures used here. Given the 3622 structure of the independent variable set, 2,916 trials would be required for a full factorial design with no replications. As in DeSarbo (1982) and DeSarbo and Carroll (1985), a main effects only design was utilized via an asymmetric fractional factorial design (see Addelman, 1962) to provide a feasible computer experiment. While the assumption of main effects only is clearly a limitation, the resulting 27 trials from the design provide a modest test of the procedure and its performance in recovering several synthetic data sets with known structure. Note, in all trials, o-i ai 1 was fixed. For each of the 27 trials, synthetic data were generated according to the first six factors in Table 1. Values of the multiple dependent measures were collected for each trial and regression/ANOVA analyses of these Monte Carlo results were performed. Note, for those dependent measures ranging between 0 and 1, the arcsin transformation was applied to the square root of that measure--a step suggested in Snedecor and Cochran (1981, p. 196) to stabilize the resulting variance. The significant results of these analyses are summarized below. Concerning computational effort and the first dependent measure (Y1), the only consistent finding is that internal analyses (X13) tend to significantly increase the amount of computation involved in estimation, as opposed to external analyses where X is fixed. Concerning overall goodness-of-fit and the second pair of dependent measures (Y2 and Y3), we observe consistent findings with respect to the two higher values of o(X 9 and X10) significantly reducing overall goodness-of-fit. Also, the uniform error mis=
294
PSYCHOMETRIKA
specification appears to significantly increase both measures here. The matching coefficient is significantly lower for larger sets of brands (X 3 and X4), constant threshold specifications (XT), and external analyses (Xz3). Concerning parameter recovery and the pair of measures concerning X(Y4 and YT), consistent results are obtained with respect to the fact that external analyses (X13) result in better recovery of X (since X is fixed) and that somewhat poorer recovery occurs in larger dimensionality (X5 and X6) where more parameters are estimated. Surprisingly, using the rational start procedure (X~4) tends to result in poorer sumsof-squares accounted-for-values. With respect to ot recovery, the only consistent finding across the two measures (I"5 and Ys) is the fact that larger stimulus (X 3 and X4) sets (i.e., more data) tends to result in significantly better t, recovery. For Y5, specifying larger dimensionality (X5 and X6) detracts significantly from ot recovery, while the uniform error misspecification surprisingly improves such parameter recovery. For Ys, holding X fixed in external analyses (Xl3) improves the RMS measure. Finally, with respect to s recovery and Y6 and Y9, the only consistent finding is that it appears harder to recover the true s when s is allowed to vary over subjects (X8), and thus, when there are more parameters to estimate. Overall, with some exceptions, these Monte Carlo analyses appear to give a somewhat consistent description of the performance of MICROSCALE. All else held constant, MICROSCALE tends to require more computational effort for internal analyses; data recovery suffers as tr is larger; and, parameter recovery tends to improve as the data set size increases (especially with respect to J) and there are smaller numbers of parameters to estimate--a common finding in nonlinear model estimation. Perhaps the most unexplainable finding concerns the role of the uniform and exponential error misspecification that one would initially hypothesize to have deleterious effects across all these dependent measures, but yet has scattered incidence of positive benefits in some cases. In addition, the rational start had relatively no effect on all but one measure, and that effect was negative (Y4)Obviously, there are limitations to such a modest study. Barring restrictions on computer time, it would have been preferable to perform a full factorial experiment with replications to measure possible interaction effects that may confound main effects only estimation. Such a study would have been prohibitive from a cost/time perspective. In addition, it would have been beneficial to specify additional levels per factor (especially concerning the error misspecification factor) and perhaps additional factors (e.g., control parameters for the algorithm). 5.
A Consumer Psychology Illustration
Study Design A sample o f / = 30 undergraduate students at a major northeastern business school were asked to take part in a small study designed to measure preferences for various brands of existing over-the-counter (OTC) analgesic pain relievers. These respondents were initially questioned as to the brand(s) they currently use (as well as frequency of use) and their personal motivations for why they chose such brand(s) (e.g., ingredients, price, availability, etc.). They were then presented fourteen existing OTC analgesic brands: Advil (ADV), Anacin (ANA), Anacin-3 (ANA3), Ascriptin (ASC), Bayer (BAY), Bufferin (BUF), Cope (COP), CVS Buffered Aspirin (a generic) (CVS), Datril (DAT), Excedrin (EXE), Nuprin (NUP), Panadol (PAN), Tylenol (TYL), and Vanquish (VAN). l The letters in parentheses are plotting codes that will be used throughout this paper. I The products listed are registered trademarks of their respective companies.
295
WAYNE S. DESARBO, KAMEL JEDIDI, AND JOEL H. STECKEL
TABLE3 OTC AnalgesicBrandDescriptions
Plot
co~
Mg. of
sr~t Advil
ANA
Anaein
ANA3 Amein-3
Mg. of
Mg. of
Mg. of Buf[e~
Price in U.S.
Maximum Recommended M s d ~
Aspirin minaphoa roepro~ C~elne Compoends Don~ I
ADV
Mg. of Aoe~2
ill illllllllllll
3
~
5
r~sage
Share
....7_
8
6
0
0
200
0
0
6.99
6
3.7
400
0
0
32
0
3.97
10
10.3
0
500
0
0
0
5.29
8
6.8
ASC
Aseriptin
325
0
0
0
150
3.29
12
2.6
BAY
Bayer
325
0
0
0
0
2.69
12
20.6
BUF
Buffedn
324
0
0
0
100
3.89
10
8.8
COP
Cope
421
0
0
32
75
5.31
8
0.4
CVS
CVS
500
0
0
0
100
1.99
12
0.3
DAT
Dalril
0
500
0
0
0
5.75
8
2.1
EXE
Em:edtin
250
250
0
65
0
4.99
8
12.0
NUP
Nuprin
0
0
200
0
0
7.59
6
3.4
PAN
Panadol
0
500
0
0
0
4.99
8
3.2
TYL
Tylenol
0
325
0
0
0
3.69
8
22.7
VAN
Vanquish
227
194
0
33
75
4.99
12
1.1
Correlations Feature 1
2 3 4 5 6 7 8
1.000 -.653 .442 .354 .623 -.673 .704 -.074
1.000 -.323 -.063 -.458 .199 -.302 .038
1.000 -.239 -.288 .716 -.611 -.203
1.000 -.065
.061 -.019 .013
1.000 - . 4 4 7 1.000 .624 -.828 - . 4 2 4 -.356
1.000
.051
1.000
Initially, they were presented colored photographs of each brand and its packaging, together with price per 100 tablets, ingredients, package claims, and manufacturer (see DeSarbo & Carroll, 1985). Table 3 presents summaries of selected portions of the descriptions for each of the brands. Each subject/consumer was requested to read this information and return to it anytime during the experiment if he/she so wished. After a period of time, they were asked to make paired comparison preference judgments for all possible 91 pairs of brands. They were told that they had to choose one from each pair (i.e., no ties were allowed). The presented pairs were randomized for each subject. DeSarbo, De Soete, Carroll, and Ramaswamy (1988) have utilized these data in fitting
296
PSYCHOMETRIKA
TABLE4 Goodness-of-Fit Irdicies for Analgesics Data IIIIIII
r "m', ,~
IIIIIII
IIII111~1,,
T
Model DF
ha L
MC
PBC
PHI
1
13
-1494.71
.713
.510
.425
2
55
-1148.70
.808
.674
.615
3
98
-1037.77
.828
.717
.655
4
141
-875.54
.855
.769
.710
Correlations Between Xand Brand Descriptors Descriptor
Dimension I
1
.474
-.806
2
-.127
.156
3
-.541
.849
4
-.072
-.328
5
.067
-.585
6
-.856
.749
7
.558
-.813
8
.597
.030
various stochastic ultrametric tree models designed for such paired comparisons. DeSarbo, De Soete, and Jedidi (I986) have also reported analyses (two-dimensional solutions) utilizing the DeSarbo, Oliver, and De Soete (1986) and DeSarbo, De Soete, and Eliashberg (1987) vector and unfolding models for these paired comparisons data using reparameterization options for the brand coordinates. MICROSCALE
Analysis
A MICROSCALE analysis was performed on this resulting 30 × 14 × 14 array in T = I to 4 dimensions with s = 0, given the absence of ties in 8ij k , and a = I to reduce the number of estimated parameters. Given the excessive collinearity between many of the brand attributes as shown in Table 3, we decided to perform non-reparameterized analyses. Table 4 provides a number of goodness-of-fit indicies, that appear to suggest
297
WAYNE S. DESARBO, KAMEL JEDIDI, AND JOEL H. STECKEL IIIIIIIII
7 6
4/!
5
ANA."
3
u=4
2
• EXE
1 -
~ . . _ _
~B A Y
-
ASC
i
Bur
0
0
u=3
•
CVS
u = 2
_ . _ - -u-=- l-
=,I,
I
I
I
=I
I
1
2
3
4
5
6
7
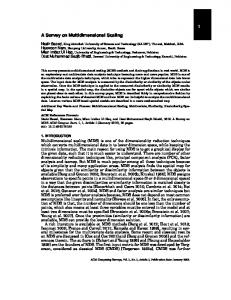
FIGURE I Student one's MICROSCALE joint space representation for the analgesics data,
the T = 2 dimensional solution is most parsimonious in describing the structure in the ~ijk (AIC = 2407.16). Figures 1 and 2 present the resulting joint space two-dimensional plots for two selected students. Common to all these figures is the notion that the first dimension (horizontal) appears to separate the major, highly advertised, high market-share brands from the remaining brands. Of particular interest here is the fact that CVS, a local generic brand popular in the area of the study, is also located in this group of higher market share/advertised brands (Anacin, Bayer, Bufferin, Tylenol), reflecting the particular environment under which the study was conducted. Also, this dimension is also highly correlated with price (-.856) indicating that the brands toward the positive end of this dimension (mostly aspirin-based) are much cheaper in cost than the ibuprofen
298
PSYCHOMETRIKA
7 6
u=6
5 4 T
Y
L
~
u = 4
ANA3
3 DAT
=
.
PAN
~
~
2 11=2
1
r
A S C-,-'--------.--...._.~'~ A III
COP
0
.,VAN
• .I
0
1
= BAY
u=
1
•
BUF •
I
I
I
2
3
4
¶CVS I
5
6
7
FIGURE2 Student two's MICROSCALEjoint space representationfor the analgesicsdata. and specialty aspirin brands located near the origin. The second dimension (vertical) clearly separates the ibuprofen brands from the aspirin-based brands, with the acetominophen brands near the middle of the dimension. Note how Excedrin is located below the acetominophen brands near the aspirin brands given the fact that it is comprised of both ingredients, Thus, the two dimensions appear to relate rather directly to the type of analgesic ingredient, cost, and popularity as demonstrated by the correlations between X and the features presented in Table 4. Each figure shows the PED for each of the two students. We do not construct the TFF given the nature of the derived dimensions. Student one (Figure 1) displays symmetric looking indifference curves. For this student, the aspirin substitutes appear to be more desirable, especially Tylenol that has highest predicted utility. The PED for this student points near the direction of Tylenol. On the other hand, the second student
WAYNE S. DESARBO~ KAMEL JEDIDI, AND JOEL H, STECKEL
299
(Figure 2) displays rather skewed indifference curves. For this student, the ibuprofen brands, Nuprin and Advil, have highest utility. The PED for this student is directed just to the southeast of these two brands. Thus, MICROSCALE can reveal individual differences in conceptualization of preference/choice/utility--a feature missing in the wandering vector or ideal point models (De Soete & Carroll, 1983; De Soete, Carroll, & DeSarbo, 1986). One can also compute the predicted utility values (Jij for each of the 14 brands by subject. A noticeable congruence between (Jij, the brand utility means, and the actual market shares (r = +0.78) is observed, where the major, heavily advertised brands such as Tylenol, Advil, Anacin, Anacin-3, Bayer, Bufferin, Excedrin, and Panadol are predicted on average to have higher overall utility. Finally, given the fact that MICROSCALE is prone to locally optimal solutions, we performed ten computer analyses for the two dimensional solution with different random starts (SVD default option for X) and examined statistical summaries for these ten analyses, including means and standard deviations. With the possible exception of one run, all of the solutions rendered relatively similar goodness-of-fit measures (as well as parameter values for X and or). Thus, there is some evidence of somewhat stable solutions with MICROSCALE,
The DeSarbo, Oliver, and De Soete (1986) Vector Model Comparative Results Given some similarity in utility assumptions between MICROSCALE and the vector model (i.e., the more the better), we decided to compare the above MICROSCALE two-dimensional solution with a two-dimensional solution obtained from applying the DeSarbo et al. (1986) vector model on the same data using similar program options. The resulting two-dimensional solution with crijk = 1 and no reparameterization option, produced a log likelihood value (the overall mathematical structure of this likelihood and that of MICROSCALE are equivalent in the case of no ties) of -1152.44 (AIC = 2472.88), a phi coefficient = 0.637, a matching coefficient of 0.819, and a point biserial correlation of 0.629. Thus, this alternative model is not as good a representation as MICROSCALE according to the AIC statistic. Two of the other goodness-of-fit statistics are higher because many more free parameters are estimated in this vector model as compared to MICROSCALE. Table 5 presents the correlations of this solution with the eight brand attributes reported in Table 3. Note, unlike MICROSCALE that produces a unique brand space, these loadings (interpretation) will change according to the specific type of rotation used in this vector model to interpret the results! As with most two-way, bilinear models, there is an indeterminacy of the resulting coordinates to any non-singular transformation. The first dimension appears to relate to market share. The second dimension contrasts the aspirin versus ibuprophen brands. The former also tend to be cheaper and involve higher maximum dosage recommendations. This interpretation is apparent by inspection of the resulting joint space representation shown in Figure 3. One of the advantages of this type of procedure over MICROSCALE is the ability to portray all subjects in one joint space plot versus having to inspect 30 of them. As shown, preference tends to be heavily in favor of the more popular, high market-share/ highly advertised brands (the first dimension). However, there is substantial variation in preference concerning the second dimensionmingredients. But how similar are the results from this vector model with those obtained from MICROSCALE? We performed canonical correlation analyses for the two resulting brand coordinate spaces as an "approximate" configuration matching procedure and obtained canonical correlations of 0.966 and 0.883. Given the uniqueness properties of
300
PSYCHOMETRIKA
TABLE 5 The DeSafoo et al. (1986) Solution Correlations Between the Derived Brand Coordinates and Attributes HH
I I I
IIII
•
,
!
--
!!'.
ALL--
,
!'
,.
'!11~
IIIIIIII
I"
Dimension ~ t o ~
..................
I
ii
n
1
.313
-.701
2
-.370
.238
3
.129
.759
4
.278
-.301
5
.482
-.476
6
.320
.813
7
.048
-.792
8
-.748
-.208
the MICROSCALE solution, these canonical correlations would necessarily be overstated somewhat. Using the MICROSCALE dimensions as dependent variables and the brand coordinates for the vector model as independent variables in multiple regression analyses, the two resulting adjusted R 2 values were 0.882 and 0.867 indicating somewhat high consistency between the two solutions. In addition, measures of association between the utility scores were computed for each of the two models across the 30 subjects (average correlation across subjects = 0.94). With the possible exception of one or two subjects, there appears to be substantial congruence between these derived utility scores across this sample. Thus, the MICROSCALE procedure provides a slightly better fit to this data according to an AIC criteria. Its primary advantage is the unique brand coordinate space derived where the user need not worry about selection of an appropriate rotation. Yet, both solutions are reasonably congruent with respect to the basic structure of utility derived from this same data set. Note, there are differences concerning policy implications for individual utility maximization. In the DeSarbo et al. (1986) vector model, to maximize a subject's utility, a brand would be positioned in the space (within a technologically feasible area) where its projection on a subject's vector would be highest. In MICROSCALE, this utility maximizing brand location for a given subject would be positioned at the intersection of the subject's highest indifference curve and the TFF. Future experimental research should focus upon the specific conditions under which a particular utility representation is most appropriate.
301
WAYNE S. DESARBO, KAMEL JEDIDI, AND JOEL H. STECKEL
Dim. I1
IADV
NUP
DAT Dim.I
ASC
VAN
CVS
COP
FIGURE 3 DeSarbo et al. (1986) vector model joint space for the analgesics data.
6. Conclusion We have described the complete MICROSCALE procedure including data requirements, model structure and properties, the ACML algorithm for parameter estimation, a modest Monte Carlo analysis documenting algorithm performance, and a consumer psychology application contrasting MICROSCALE with the results of a recently developed vector model. While these initial results look promising, further research is required to more fully investigate the MICROSCALE procedure. As mentioned in section 4, more ambitious Monte Carlo experimental designs are required allowing for the estimation of interaction effects and investigating the frequency of locally optimal solution problems. The sensitivity of the procedure to empirical/synthetic data that do not satisfy strong stochastic transitivity should also be thoroughly tested. Extensions of MICROSCALE to accommodate incomplete paired comparisons designs should be investigated given the difficulty in collecting such N ( N - 1)/2 responses per subject. Finally, further applications are desired using empirical data from a number of different disciplines to examine the appropriateness of this convex indifference curve specification, contrast the results of MICROSCALE with the results of more traditional vector and unfolding models, investigate respective policy recommendations, and so forth.
302
PSYCHOMETRIKA Appendix: The MICROSCALE ACML Procedure
Algorithm:
MICROSCALE uses a conjugate gradient method with automatic restarts (see Powell, 1977). The estimation method is an alternating conditional maximum likelihood procedure (ACML) where the log of the likelihood function is maximized with respect to a specific set of parameters (i.e., the object/brand coordinates, the consumers' t~ parameters, the multipliers, ai's, and the thresholds si's) holding the other sets constant. Estimation alternates across all the parameter sets until a convergence tolerance is satisfied. Phase 1: Input Options
The user must specify the number of consumers (I), the number of brands ( J ) , the number of dimensions (T), the type of analysis (internal or external), the option for the multiplier a i (varying by consumer, constant, or set equal to one), the option for the threshold (varying by consumer, constant, or set equal to zero), and, the file name containing the input data. This file should include the brand coordinates if an external analysis is to be performed or if a rational start is available. In addition, it should also contain H if the reparameterization options are requested. Phase II: Starting Estimates Options exist for the user to specify a random start, a rational start for X (a singular value decomposition, SVD, analysis on the aggregated preference data obtained by summing over the rows of the complete pairwise comparison data (upper and lower diagonal) as suggested in Carroll (1980), with subsequent translation of origin to satisfy the positivity constraint of the brand coordinates) or, a given start. Phase III: Estimate X, a, a, and s We need to impose nonnegative constraints on the brand coordinates ( S j t ~ 0), the subject parameters (Otit ~ 0 and ~ t =Tl Olit = 1) the multipliers (a i --> 0), and the threshold parameters (si >- 0). To accomplish this, we estimate the corresponding squared entities:
, a 2, and s 2 T
E o,2, I=1
as suggested by Gill, Murry, and Wright (1981, p. 268-269), and as described in section three of this paper. Partial Derivatives
Let T
uij = N (x),) t=l
UDijk = a2(Uij - Uik),
303
WAYNE S. DESARBO, KAMEL JEDIDI, AND JOEL H. STECKEL
¢,(. ) = ,~(Un~sk O(*)
=
¢(--VDij k
s~),
-
- s2i).
Then
0 lnL
Oai
1
= ~_,~, 6ij+k ~
4~(" ) [ 2 a i ( U i j - Uik)]
j