123. A structured approach to product and process optimization for manufacturing and service industries. Biren Prasad. EDS/General Motors, CERA Institute, ...
A structured approach to product and process optimization for manufacturing and service industries
Product and process optimization 123
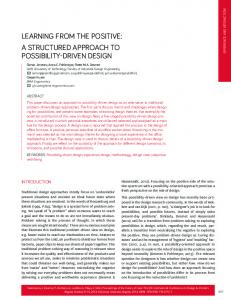
Biren Prasad EDS/General Motors, CERA Institute, West Bloomfield, USA Introduction In an effort to reduce time to market, foster teamwork, cut costs, and eliminate late engineering changes, managers in many organizations are trying to redefine the role of an employee in the context of a new paradigm. This new paradigm is characterized by recognizing the importance and real value of an employee as part of a co-operative work environment supporting concurrent functionality, and by horizontal and vertical integration within the enterprise. It is also characterized by empowerment, or pushing decision making to the lowest in ranks, emphasis on well-rounded experience and expertise, reengineering the process, considerations of both long-range and short-range goals, and a total customer-focus[1]. Today, we are witnessing the demise of “control age” and dawn of a “flexibility era” – a new breed of customized products. Consumers want finished goods tailored to international (left versus right drive), national (emission requirements, etc.), regional, ethnic, and personal tastes. For manufacturers that means producing a great mix of product options at low volumes. Today’s customers want the product features of “skill-based manufacturing” at the speed, quality, and cost of informationbased mass production[2]. Figure 1 describes some of the various forces driving the change in an organization. Product and process re-engineering In the midst of all of this, management focus and organization structure is changing. Many organizations are aligning themselves along the lines of strategic business units (SBUs). Many competitive, multi-tiered initiatives have rippled through the organization. Examples include just-in-time, quality function deployment, employee empowerment, ISO 9000, quality circles, sixsigma programme, continuous process improvements (CPI), cross-functional teams, process management and control, etc. The walls between engineering and manufacturing groups are crumbling. The computational tools that have been developed to perfection over the years, only work well with each specialized unit. This is because they were designed for independent departments. Coercing these tools to fit into the changing organizational structure does not meet enterprise needs. It creates a backlash of problems,
International Journal of Quality & Reliability Management, Vol. 12 No. 9, 1995, pp. 123-138, © MCB University Press, 0265-671X
IJQRM 12,9
Emerging technology push
Product and process re-engineering pull
124
Change
Figure 1. Example of forces driving change
Performance/ productivity improvement pull
Competitive pressure push
such as production delays and communication bottlenecks. There appears to be a growing technological imbalance among the activities of a production cycle. In conjunction with technological push, many companies are also reviewing their current product and process methods and introducing re-engineering tactics – pulling what are the right things to do. Blindly following automation is not always the right way to enhance productivity. If we do not re-engineer a process right, there is a danger that one might simply automate one’s wasteful processes and make the same old mistakes only faster this time. Areas of manufacturing competitiveness A basic premiss of manufacturing refers to the best transformation of customer expectations and requirements into useful products and services (see Figure 2). Alternatively, the identification of the best manufacturing transformation process is that which produces satisfied customers recurrently. A large number of companies across Europe, America, and Japan was recently studied[3], with the focus on manufacturing strategies and competitive priorities. Manufacturers who used to be able to differentiate themselves because of a lock on raw materials, technical knowledge, capital, process superiority or innovation, have found that manufacturing is a vulnerable market. Technology by itself cannot create long-lasting competitive advantage. If the push for emerging technology is high, the pull for product and process engineering is
Product and process optimization
Customers' expectations and requirements
The customers
The company
Products and service
usually low. Similarly, high competitive pressure is created because of low performance or productivity improvement level or status. If the performance or productivity level of a company is high, there is less of an emerging technology push. When products come to market anybody can copy their salient features. The competitive edge, if any, is usually short lived. What is difficult to duplicate is how technology is deployed into one’s process. The improvements made through deployment of technology and subsequent product and process renovation can provide a real competitive advantage. Engineering schools and researchers tend to ignore the process renovation factors and look exclusively at the technological solutions (e.g., CAD/CAM, CAE, CIM, etc.), while the industrial researchers think of computers and all off-the-shelf tools as commodities that anyone can buy and use. Most truly successful companies (both in the USA and Japan) believe that process management techniques are the product of decades of “corporate learning” that others cannot buy or copy. The Japanese seem to be far ahead in mastering the technology and structuring it to fit their unique environments. Two significant technological innovations are product innovation and process innovation. From 1955 to 1990, Japan’s real gross domestic product increased almost nine times, the output of manufacturing in monetary value increased 17 times, and the added value of this industrial sector increased 21 times[4]. Labour productivity in manufacturing increased during the same years at an average of 6.8 per cent annually. Coming to terms with the Japanese market was one of the challenges Americans and Europeans had to meet to narrow the competitive gap. The two things competitors cannot buy is their own unique process and their own unique organizational culture. This can be a blessing in disguise or a curse depending on how one looks at it. For most US automotive industries, the production process is deeply rooted in the way teams design and manufacture the products, and thus inflexible, while the Japanese seem to have a better handle on it.
125 Figure 2. Basic premiss of manufacturing and service organizations
IJQRM 12,9
126
With regard to culture, Americans seem to be more open than the Japanese, whose strong cultural ties facilitate joint collaboration and teamwork. Thus, Americans seem to fall short on both ends. The studies have also shown some subtle differences in the way the two look at their processes. Europeans still focus on quality improvements and operational efficiency during the process of manufacturing. The Japanese focus on flexibility while continuing improvements in quality, dependability, cost, and productivity. To the Japanese, flexibility in manufacturing means a rapid and efficient process of introducing changes in production volumes and product mix[5]. In the field of manufacturing, the Japanese focus on a process of rapid development of new products is aimed at becoming innovators of new process technologies. Locals of the Toyota factory in Japan can receive their car built to their specification within few days of placing the orders. Achieving perfection in process flexibility did not come without pain even for the Japanese. Such process flexibility was not attributed to an edge in technologies. It has been observed by Putnum[6] that the success of the Japanese was largely due to practising socially appropriate production, supremacy in process management and continuous refinements. Examples are the well known kanban system of production control, kaizen, Taguchi method of quality control, market-oriented manufacturing, etc. The recognized decline in the productivity of many US companies has been a strong stimulant to search for ways to improve their operational efficiency and become more competitive in the world marketplace. Many have changed their attitudes towards customers, their production processes, and their internal management approaches, whereas others continue to search for the reasons for their demise. Successful companies have been the ones who have gained a better focus on eliminating waste, normally sneaked into their products, by understanding what drives product and process costs and, how can value be added. They have chosen to emphasize high-quality production rather than high-volume production. With increasingly pervasive global competition, engineering excellence is becoming as fundamental a competitive weapon as manufacturing excellence[2]. Significantly, what we are seeing is the completion of a definition of what it takes to be a world class manufacturing company. Life-cycle management To date, many companies view product realization as characterized by long lead times, a multitude of engineering changes, manufacturing complications, and, ultimately, heavy costs to satisfy the customer requirements. The number of engineering changes that occur in the best US or European company is 40 to 60 per cent more than the best Japanese company (see Figure 3). This is because in most US companies, efficient decision-making process is lacking. They either limit the process to conventional “design review” or “red-team” meetings that inhibit free flow of information, and serve no purpose but to postpone decisions from being made until after the meeting. They tend to centralize the decisionmaking authority in some committees or hierarchical tall silo’s structure. For
100 Field returns
Best US company (following traditional methods)
127
Best Japanese company (following concurrent methods)
50
Number of engineering changes processed (per cent)
85 per cent total changes complete
Product and process optimization
Customer ship
0 25-30
20-25
15-20
10-15
5-10
0-5
Job No.1
Number of months prior to production
Source: L.P. Sullivan, American Supplier Institute
example, an engineers’ choice of “design for X-ability” decision is often perceived as a functional service to be called on periodically for incremental improvements in product quality, new product lead times, and costs. The perception is clearly different in successful engineering companies, where DFX is seen as a pervasive set of engineering activities that form the regenerating life blood of the CE co-operating teams. Decision making steers the PDD process. Company determines what subsystems, components, parts, etc., to develop, defines a set of consistent product objectives with respect to company and customer goals, sets priorities, and allocate resources. Table I compares the actual 1990 automobile production data between the USA and Japan[7]. In all the five categories shown, US production levels fall short. It took 43 per cent more design effort, but the time it took to finish the design was 22 per cent more than the time it took for the Japanese automobile company. At any year the model in production for Japan was twice as large as what the Americans seemed to put through their own production system. Aspects of life-cycle management Change happens all the time in all organizations. Most often, however, change is unplanned, unmanaged and uncomfortable. Life-cycle management means learning to deal with changing technologies and systems, initiating quality leadership, process management, shaping direction for the change, taking control, and establishing the improvement process. With the advent of new process and design techniques, current processes may need to be restructured,
Figure 3. Engineering changes in best US and Japanese companies (automobile manufacturing)
IJQRM 12,9
128 Table I. US and Japanese data for automobile production
US (Japan) data during 1990
Competitive advantage (Per cent)
Design time per model (months)
60 (47)
21.7
Design effort per model (man hours)
3.0 (1.7)
43.3
Average replacement period per model (years)
9.2 (4.2)
54.3
Average annual production per model (thousands)
230 (120)
47.8
36 (72)
50.0
Concept to delivery life cycle
Number of models in production Source: [7]
reprocessed, or renovated to exploit their maximum potential on product life cycle. Life-cycle management means management process for systematically handling continuity, a revision-type product change to incorporation of a new product family or a technology. There are three aspects of life-cycle management[8]: (1) managing reprocessing, restructuring or re-engineering change; (2) managing continuity; (3) managing revision change. One of the major challenges in CE is to find an appropriate balance among “continuity,” “revision” and “re-engineering”. Continuity is used here to indicate carrying the day-to-day operation, with the exceptions of “engineering changeorder” procedures or minor alterations. “Major change” means changing the life-cycle methodology, process re-engineering or anything new that is introduced. They are discussed next. Managing reprocessing, restructuring or re-engineering change The key in “managing change” is to establish an optimal balance between the following types of changes: ● A mix of CPI restructuring or renovation strategies. ● New product introduction. ● Strategic technology insertion. ● Agile and virtual organizational traits. This section begins with re-engineering strategies, traits, goals and objectives to manage the changes effectively. Re-engineering strategies Figure 4 shows a degree of severity in managing change. Continuous improvement is the lowest denominator. If the process is stable, it keeps pace with the
Product and process optimization Product/process renovation Best industry practices Innovative/unmatched practices
Benchmarking
129
Organizational traits Agile and virtual traits
Restructuring product/process Types of re-engineering strategies
Common best corporate system Continuous improvement Common environment Degree of severity of change
known common changes. Restructuring is a next level of strategy for managing change that commonly cannot be handled by “continuous improvement” process. Organizational trail plays a pivotal role in the CE process. It helps define strategies for bringing manufacturers, suppliers, and customers closer together. Renovation means transformation from old ways of conducting business to a new way both by using the same level of abstraction in product, process, enterprise and behavioural modelling, and at a minimum by maintaining the systems’ performance (product functionality and semantics) at the same level. Refocusing the efforts in the definition phase, so that product is done right the first time a design is released, and a definition of a common best corporate system are examples of “renovation”. Renovation means taking steps to redesign and simplify business systems and processes, to develop a more competitive workforce, and to explore new business methods (see Figure 4). Unlike restructuring, renovation involves alteration in the level of abstraction to reconfigure or reconstitute the subject system into a new form (or to a new level of abstract descriptions) and the subsequent implementation of the altered form. Incorporation of best industry practices provides some examples of renovation efforts. New tools and systems are introduced one batch at a time. As the team gets familiar or trained in one set of systems or its use, other sets are introduced progressively. The deployment is done on an incremental basis: “pay-as-you-go” type to ensure a managed impact.
Figure 4. Degree of severity in managing change
IJQRM 12,9
Managing continuity The continuity management process begins with the initial design of configuration management process and allows the changes to take place without violating the outer boundaries around which configuration control is defined.
130
Configuration management Configuration management is a cross-functional process management framework for organizing various “as designed” processes and product families, where appropriate configuration control activities (where, how, and when changes will occur) can take place. A comprehensive configuration management process is required earlier in the programme. This involves shifting from a multi-detail drawing-based system to a “mono-detail,” “digitalbased” configuration (part and modelling structure) for product life-cycle management (see Figure 5). Product life-cycle configuration management (from inception to recycling) consists of three major stages: development, production, and service. The development stage starts with “as-planned’ configuration and ends with “as-designed”. On the development side, engineers work in an
Configuration management
Inception
Recycling Release for production
Development
As-planned configuration
Figure 5. Product life cycle configuration management
As-designed configuration
Customer requirements
Delivery to user
Production
As-built configuration
Configuration management
Service
As-maintained configuration
End product
open-ended or “evolving environment” where product form, fit, and functions unfold creatively. Development duration = [trfp – ti ] where, trfp and ti are timings at “release for production” and “inception” points, respectively. The production stage starts with “as-designed’ configuration and ends with “as-built” configuration. Here, configuration management implies enforcing release procedures. Examples of such release procedures are: only approved parts to be used; a top-level assembly can be promoted to a “release-level” if all of its components have also reached a “released-level” status; etc. At the production stage, plant engineers work in a stable environment so that they can operate the production at maximum capacity. Production duration = [tdtu – trfp ] where, tdtu and trfp are timings at “delivery to user” and “release for production” points, respectively. The service stage begins with “as-built” configuration and ends with “asmaintained’ configuration. What is required for the configuration system to work efficiently is tools and interfaces that follow structured methodologies and are based on up-coming international standards. Service duration =[tr – tdtu] where, t r and t dtu are timings at “recycling” and “delivery to user” points, respectively. Each stage methodology includes a “measurement of merits” of underlying processes in metric forms. Metrics include change incorporation control tied to designated product check-points, option incorporation, and family of product variation. This provides better co-operation, more flexibility, and allows for greater change during the development cycle. Managing revision changes This means managing the various revision changes, such as levels for parts, product releases, and CAD/CAM part prints. Change management methodology Methodology for change management (CM) has four main elements as shown in Figure 6. They are: quality leadership process (Pql ); process management (Ppm ); change control process (Pcc ); and improvement process (Pip ). In other words, CM = ƒ (Pql, Ppm, Pcc, Pip ) where CM stands for change management and ƒ stands for function. Understanding where we are starting from is an essential prerequisite for establishing the need for a change. The quality leadership process is focused on determining the sources (many known and unknown factors) such as regularity mandates; customer preferences; technological breakthroughs; and world of
Product and process optimization 131
IJQRM 12,9
Change management process Improvement process
No
Control process
?
132
Yes Process management
No ? Yes
Quality leadership process
Figure 6. Elements of a change management process and their relationship to configuration management
Customer requirements
No ? Yes
Configuration management
End product
business realities that may legitimize the change from both “must-have” and “want-to-have” perspectives. The second element, process management, involves validating the changes – teams analysing and evaluating the various processes and types of changes under considerations. The third element is a change control process. There are many special causes of variations, such as improper set-up, operator errors, defective gauging, broken tools, materials that are under the direct control of the operator (production team). Through preventive action and continuous elimination of their sources of variation, teams can turn an unstable and unpredictable process into a process which has a predictable outcome. This process utilizes a routing and queuing model to simulate the impacts of potential change. The final element is bringing about the needed improvement. This is very similar to continuous process improvement (CPI). Quality leadership process In the area of change management, it is important to facilitate and provide a well-balanced quality leadership as unobtrusively as possible. All aspects of a company’s operations should be continuously scrutinized, re-examined, and questioned. Total quality management (TQM) is a recently formalized initiative aimed at improving the industrial productivity and quality of products produced by the global manufacturing industry. The big three automobile manufacturers have changed their quality standards which the suppliers must meet to be viable suppliers. Ford Motor went from Q101 to Q1 and now total quality excellence[9]. General Motors changed from SPEAR 1 to Targets of Excellence and Chrysler Motors moved from Penta Star to Excellence.
Organizations need to keep a constant watch on new technologies as they appear, utilizing those that are appropriate for TQM missions. Pql = ƒ[ Ptqm, Pqs] where, Ptqm and Pqs denote total quality management and quality standards, respectively. Process management The second element of change management is understanding the change process for its best results. Improvements may result from product change, process change, cultural (human factors) change, requirement change, or enterprise operations change. Juran and Gryna[10] mention that any change has a cultural bearing on one’s formed comfort zone. When the level of change exceeds this zone, management often encounters some degree of resistance. The effective management of a process necessitates a structured approach that takes into account the “who,” the “how” and the “what” of the changes. The process management (Ppm) can be viewed as a five-stage process. To determine (see Figure 7): ● current status, Pcurrent, (where are we now?); ● future status, Pfuture, (where we would like to be?); ● analysis of what is lacking in current process, Panalysis, (review of who, how and what); ● how to accomplish the transition, Ptransition, (getting there); and ● rational criteria or basis for measuring progress; Ppm = ƒ[Pcurrent, Panalysis, Pfuture, Ptransition] The measurement process can be expressed mathematically as: Measurement progress = |∆|[Pfuture, Pcurrent ]. Carrying out a measurement or diagnosis at the starting point is necessary for the success of the whole change management process. Measurement serves as a mechanism for a further systematic refinement of the process, and if needed, for improving and optimizing the overall output of the company. Change control The third element is change control process. There are two aspects of change control: minimizing change variety; and adherence to change specifications. Pcc = ƒ[Pcv, Pcs] where, Pcv and P cs stand for change variety and change specifications, respectively. Pcc stands for change control. Both reinforce the need for a good configuration management system having a built-in change control process. The latter ensures an orderly set of practices that could recognize and fix errors, could promote CPI and TQM, and could add discipline to decision making.
Product and process optimization 133
IJQRM 12,9
How to accomplish the transition? Process management
134 Where are we now?
Figure 7. Elements of process management (PM)
Measuring progress
Where we would like to be?
Analysis of what is lacking
Continuous improvement process This is an iterative approach to optimize results and is similar to what is referred to as continuous process improvement (CPI). The development and implementation of a CE process into a manufacturing enterprise is a classic example of TQM and the application of CPI. Continuous improvement is a cyclic process of product and process optimization over a product life cycle. Optimization implies that an organization is keeping in constant touch with new technological advances and frequently employs them to improve an existing product. Cycling means that an organization is continually exploring new frontiers in manufacturing technologies. The latest advances in related fields such as computers and systems are often reviewed regularly for possible inclusion in the product development cycle. The appropriate technology is captured and utilized, if it is proved to be the cost-effective thing to do. The right decisions are made at the right time while sorting out an array of issues and choices. Successful implementation requires that teams work together, monitor quality, identify controlling factors affecting them, and find the appropriate technologies. Use of continual refining process such as “QFD” is important[11]. Many companies are regularly using such programmes in quality and continuous improvement to maintain a world-class competitive position. One of the hallmarks of the Toyota system is kaizen. The Japanese word kaizen may have no clear English translation, but the oldfashioned American phrase “every day in every way I am getting better and better” seems a practical way of describing it. Here, the Japanese tend to study
and improve processes manually for years before computerizing it. This is useful for processes that are subject to frequent changes. For processes that are fairly static, kaizen may appear to be simply a mechanism for obtaining consensus among workers before automation. The Japanese perspective, however, is very different. Their objective (through kaizen) is to create permanently a culture within a growing organization. This would either help workers prevent the development of mistakes in designed product or manufacturing processes, or help prevent errors being passed on to the next operation in the process. This culture includes the utilization of a structured problem-solving process integrated with a mistake-proofing methodology that focuses on product design and manufacturing, both new and existing. Both Deming and Feigenbaum emphasize the importance of continuous improvement to assure a firm’s long-term viability. A structured approach to PPO “in a continuous improvement” mode is shown in Figure 8. It consists of three connected balloons. It shows CPI as one of the balloons but product improvement is a three-way process. The product and process optimization starts with CPI suggesting initial areas and motivation for change. The project management methods interact with the QFD to determine an improvement planning matrix. In the start project, management method suggests a trial project management matrix. QFD evaluates the matrix and provides process measurements and feedbacks. If the improvement planning matrix is satisfactory, it is then fed back to CPI for further cycling. PPO methodology (PPOM) for product improvement is a function of: PPOM = ƒ [CPI, QFD, PM] where, in addition to CPI, QFD and project management (PM) are required to control each product development project. The inclusions of quality function deployment and project management methods add additional power to classical CPI approaches. The latter is indicative of a loop of a product realization process. Besides the three-way interactions, CPI, QFD and PM each performs its own independent four-part cyclic loops. Each loop cycles the information clockwise as shown in Figure 8. Focusing on customer satisfaction To understand what it takes to satisfy the customer, one must focus on the “voice of the customer” which is represented only in part by existing customers. Customers who do not buy a company’s product also have a voice. The definition of quality as stated earlier relates to internal as well as external customers. Everyone wants the information – the voice of the customers to be timely, accurate, and straightforward. No matter who is supplying the information, products or a service, the recipients rely on the information source (internal or external) for quality work. The internal requirements are as real as those of external customers – whether it is speed, accuracy or measurement. Defining quality as “managing conformance to specification in order to achieve customer satisfaction” represents a minimum set of “dos” of what a company has to do.
Product and process optimization 135
IJQRM 12,9
Identify Identify current technological frontiers process (strategic organization and needs) operations
Gather voice of customer
Understand the voice of customer
Deploy improvements matrices
Establish QFD characteristics matrices
136 Deploy plan for Choose areas of selective opportunity improvements Continuous process improvement (CPI)
Improvement planning matrix
Quality function development (QFD)
Product and process optimization methodology (PPOM)
Areas and motivation for change
Process measurements and feedback Project management matrix
Project management methods
Establish checkpoints, Determine activities, project objectives interfaces and and goals time-estimates
Figure 8. Elements of a structured approach to product and process optimization
Deploy plan for selective improvements
Establish crossfunctional improvement team and methods
There are partners and internal customers, who want their opinion to be sought and their issues to be addressed. The “voice of the customer” includes inputs from sources such as manufacturing, purchasing, field service, suppliers, etc. They represent a company’s internal customers. Figure 9 lists various sources of data to develop customer requirements[8]. Product requirements = ƒ [ Dvoc, Dp, Dwf, Dma]
Product data • Your products • Your competitors' products • Teardown data • Historical data • Benchmarks • Existing company information
Internal customers • Your designers • Your engineers • Your managers • Your owners • Your employers • Your dealers
Product and process optimization Warranty field data
137
Product data
Voice of Warranty • Warranty data External customers customers field data • Field support • Who bought your Develop customer • Repair and maintenance products requirements information • Who are satisfied • Customers' complaints • Who are not satisfied • Others Market analysis Past and future customers • Your competitors • Who switched to your competitor • Who bought competitors' products
• • • • • •
Mail, telephone, etc. Clinics Focus groups Individual interviews Listening in dealerships Listening in trade shows, etc. • Trade magazines • Marketing surveys Market analysis
where, Dvoc, Dp, D wf, Dma stand for voice of the customers, product, warranty or field, and market analysis data, respectively. The voice of the customers data (Dvoc data) in turn is a function of Dvoc = ƒ [ Dic, Dec, Dp&f] where, Dic, Dec, Dp&f stand for internal customers, external customers, and past and future customers, respectively. Today, the customer focus is broader than just satisfying internal and external customers. Additionally, it includes making products that delight the user and cause a positive attitude towards their value, usage and quality. As products become obsolete more quickly in a highly dynamic marketplace, to many companies maintaining value over the life of the product is becoming the most important quality dimension. Incorporate lessons learned Most companies gain a competitive advantage in the marketplace through a process of “corporate learning” that has gone into building their intellectual workforce. Though not obvious immediately, during this learning, a number of databases of experiences are created. If design programs are used, a trail of design history is inadvertently left behind. Lessons learned from previous programs and in-process developments can be immediately reflected if digital model or other forms of representations (such as knowledge base, database, etc.) are employed. This may be entered as a part of corporate technical memory containing both positive and negative past experiences. With proper keywords
Figure 9. Sources of data to develop customer requirements
IJQRM 12,9
138
and on-line-search capability, knowledge-base teams can search for occurrences of similar situations and thus capitalize on teams’ past experiences. Concluding remarks With continuous improvement, companies have been able to decrease steadily lead time and cost of the product while satisfying the customer with a robust design. In the foreseeable future, there is a need for radical changes in the way engineering is managed and executed, just to stay in the race. In the future design is more likely to be characterized by: ● zero distinction between researchers, designers, and production engineers; ● no annotation of detail until manufacturing intent is assured; ● no manufacturing engineering sign-off because multi-disciplinary teams solve conflicts early; ● 100 per cent predictable and controllable quality by design, not by inspection; ● total replacement of classical PERT project management techniques with goal-oriented approaches; ● research, design, development, production engineering and manufacturing engineering activities carried out in parallel and not in series. Continuous improvements will be ingrained in the way we design and develop a product rather than a piece-wise improvement process as we see today. References 1. Ross, E.M., “CALS: enabling the new manufacturing paradigm”, CALS Journal, Winter 1992, pp. 29-37. 2. Prasad, B., “Modern manufacturing”, in Zaremba, M. and Prasad, B. (Eds), Modern Manufacturing: Information Control & Technology, Springer-Verlag, London, 1994, ch. 1, pp. 1-15. 3. Ferdows, K. and De Meyer, A., Towards an Understanding of Manufacturing Strategies in Europe – a Comparative Survey 1985-1986, Insead Research Paper, London, 1986. 4. Hitomi, K., “Manufacturing technology in Japan”, Journal of Manufacturing Systems, Vol. 12 No. 3, 1993, pp. 209-15. 5. Wheelright, S.C. and Hayes, H., “Competing through manufacturing”, Harvard Business Review, Vol. 63 No. 1, January-February 1985, pp. 99-108. 6. Putnum, A.O., “A redesign for engineering”, Harvard Business Review, Vol. 63 No. 3, MayJune 1985, pp. 139-44. 7. The Economist, 14 April 1990. 8. Prasad, B., Concurrent Engineering: Fundamentals, Volume I: Product and Process Organization, Prentice-Hall, New York, NY, 1995, ch. 2 and 3. 9. Fauteck, R.D. and Studzinski, G.C., “Supplier improvement process plan”, SAE Paper No. 940661, Quality and Design Issues in Automotive Simultaneous Engineering, SAE SP-1035, 1994, pp. 25-34. 10. Juran, J.M. and Gryna, F.M., The Quality Planning and Analysis, 3rd ed., McGraw-Hill, New York, NY, 1993, pp. 158-60. 11. Hauser, R. and Clausing, D., “The House of quality,” Harvard Business Review, Vol. 66 No. 3, May-June 1988, pp. 63-73.