3 Convex Drawings of Planar Graphs. 63. 3.1 Introduction. 63. 3.2 Preliminaries. 64. 3.3 Chrobak and Kant Algorithm. 66. 3.3.1 Outline of CK Algorithm. 67.
A Study Of Some Efficient Algorithms For Drawing Graphs A Thesis Presented to Mathematics Department, Faculty of Science, South Valley University, Egypt.
Submitted In Partial Fulfillment For The Award Of Master Of Science In Mathematics (Computer Science) By Mohamed Abdel-Halim El-Sayed Omar B. Sc. Mathematics and Computer Science, 1994 El-Minia University, Egypt.
Supervised By Prof. Dr. A. M. Khidr
Dr. Ahmed A. A. Radwan
Professor in Mathematics Department, Faculty of Science, South Valley University in Aswan.
Assistant Professor in Computer Science Department, Faculty of Science, El-Minia University.
Department of Mathematics, Faculty of Science, South Valley University, Aswan, Egypt. (2002)
Contents
Contents Page Acknowledgments
V
Abstract
VII
1 Introduction
1
1.1 Background
4
1.2 Graph Drawing
5
1.3 Drawing Styles
8
1.3.1 Polyline drawings
9
1.3.2 Planar drawings
9
1.3.3 Straight line drawings
10
1.3.4 Orthogonal drawings
11
1.3.5 Grid drawings
12
1.4 Properties of Drawings.
14
1.5 Preliminaries
14
1.5.1Graphs and Multigraphs
15
1.5.2 Subgraphs
16
1.5.3 Paths and Cycles
17
1.5.4 Connectivity
18
1.5.5 Trees
19
1.5.6 Binary Trees
20
1.6 Planar Graphs
22
1.6.1 Planar graphs and plane graphs
22
1.6.2 Euler's formula
24
1.6.3 Dual graphs
24 I
Contents
1.7 Algorithms and Complexity
26
1.7.1 The notation O(n)
26
1.7.2 Polynomial algorithms
26
2 Triangulated Drawings of Planar Graphs
27
2.1 Introduction
27
2.2 Background
28
2.3 Tools for Triangulated Drawings
30
2.4 Chroback ’s Algorithm
33
2.5 Schnyder suggestion for improving of Chrobak’s Algorithm
44
2.6 New Algorithm for Drawing Planar Graph in (n-2)(n-2)
47
A Linear-time Implementation of the Algorithm
57
2. 7 Conclusion
61
3 Convex Drawings of Planar Graphs
63
3.1 Introduction
63
3.2 Preliminaries
64
3.3 Chrobak and Kant Algorithm
66
3.3.1 Outline of CK Algorithm
67
3.3.2 Improving of CK Algorithm
70
3.3.3 Linear-time Implementation of MCK Algorithm
77
3.4 Radwan and EI-Sayed Algorithm 3.4.1 Outline of REConvexDraw algorithm
II
82 82
Contents
3.4.2 Improving the grid size of RECovexDraw Algorithm
86
3.4.3 Linear-time Implementation of MREConvexDraw Algorithm
93
3.5 Conclusion
98 99
4 Orthogonal Drawings 4.1 Introduction
99
4.2 The general framework
101
4.3 Orthogonal Drawings of 4-Planar Graphs
104
4.4 Orthogonal Drawings of 3-Planar Graphs
111
4.5 New Algorithm of 3-Planar Graphs
114
4.5.1 Outline of the New3-Orthogonal
115
4.5.2 Linear-time Implementation of New 3-Orthogonal Algorithm
123
4.5.3 The Modified New3-Orthogonal Algorithm
126
4.6 Conclusion
132
Appendix I
133
Appendix II
147
Appendix III
161
References
175
III
Acknowledgments In the name of Allah, The Beneficent, The Merciful First and foremost, I like to thank the Almighty God, Allah, for everything HE gave me of all my life. I would like to specially thank my supervisors, Prof. Dr. A. M. Khidr, and Dr. A. A. A. Radwan for introducing me to this beautiful and fascinating field, guidance and encouragement they have given me during done my research. They suggested ideas and problems to look at and provided constructive criticism. They also forced me to express my thought learned about how to organize and present research results. Their support, encouragement and friendship have made the years a truly enjoyable experience. Also I would like to thank all the staff members and the head of the Department of Mathematics, the Dean, and the Vice-dean for higher research, Faculty of Science, South Valley University in Aswan for providing a stimulating and friendly environment. I would also like to thank all the staff of the Department of Pure Mathematics, Faculty of Science, Cairo University for teaching me post graduate courses. Great many thanks go to my family for their constant encouragement and moral support throughout my life, and being there when I needed them. In particular, I want to thank my father and mother for taking care of me, and stimulating me the many days I worked at home. To them I dedicate this thesis. Author Mohamed Abdel-Halim El-Sayed.
VII
Abstract The problem of automatic graph drawing has attracted recently a lot of attention, due to its numerous practical applications in mathematics, computer science and other branches. In many applications graphical representations are used for displaying information. The function of these representations is to clarify or to display the structure of the information in a compact and relatively small space. Many times one picture says more than thousand words, but the picture has to be clear and readable. Almost every body is aware of schemas, using rectangles with information, and lines and arrows connecting them. If a schema is small, then it can easily be drawn by hand. The problem becomes more and more difficult if one tries to draw the electrical diagrams of electrical applications in a readable form. The electrical schema of e.g. a television set gives a readable idea how the different components in the television are connected with each other. On the other hand, a computer is also used to calculate the optimal placement of the components inside the electrical application. The application contains a numerous amount of small electrical components, which must be connected with each other. These components have to be placed on a chip, such that the number of crossings between the connections is as small as possible, and the required area of the chip must not become too large. To compute an optimal placement of the components on a chip by hand requires an incredible amount of time. The problem becomes even more complex when several additional constraints have to be satisfied as well, e.g., the number of bends and the total length of the connections must be minimized as well. These questions arise in the design of Very Large Scale Integration (VLSI) chips. This thesis presents efficient algorithms for drawing planar graphs. Graph drawing addresses the problem of constructing geometric representation of information and finds applications in almost every
VIII
branch of science and technology. In this thesis we study triangulated drawings, convex drawings and orthogonal drawings. In chapter one an introduction and background about graph drawing is given. Then we present the drawing styles, the properties of drawings, and some preliminaries. In chapter two, we give general survey about the known algorithms, which deal with triangulated drawing of planar graphs. Then, we have introduced a new algorithm that embeds an n-vertex planar graph into the (n-2)×(n-2) in linear-time implementation. Our implementation is similar to Chrobak and Payne implementation, which embeds the same graph into the (2n-4)×(n-2). The area of the square covering the embedding graph using our approach is half of the rectangular area covering the embedding of the same graph using their approach. In chapter three, we discuss some algorithms for constructing convex drawings of tri-connected planar graphs. Hence we introduced a new algorithm which reduce the drawing area to be (n-3)×(n-3), which is the optimal result up to the date of publishing this thesis as far as we know. In chapter four, we discuss different techniques for orthogonal drawing of 3- and 4-planar graph . Also we compare the algorithms of 3planar graphs and we find that the most recent algorithm given by Radwan,2001 is the optimal because it improves the lower and upper bounds and it also minimizes the number of bends over the previous algorithms.
Author Mohamed Abdel-Halim El-Sayed.
IX
Chapter One
Introduction
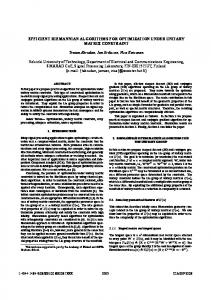
Chapter One Introduction In recent years graphics workstations have become the main platforms for software and information engineers. Research on graph drawing algorithms has spread over the broad spectrum of Computer Science, from VLSI (Very Large Scale Integration) to data base design. A number of data presentation problems involve the drawing of a graph on a two- and tree-dimensional surface. Examples include schematics, algorithm animation, and software engineering. Graph drawing addresses the problem of constructing geometric representations of graphs, a key component of support tools for complex applications in science and engineering. Graph drawing is a young research field that has grows very rapidly in the last decade. One of its distinctive characteristics is to have furthered collaborative efforts between computer scientists, mathematicians, and applied researchers. Examples include database design systems [Kam89, RBB+84, RBF+87, BNTT85, BT86, Kaw75], VLSI design systems [Har88, BBB+86, BLSV92], network design systems [KK88, KMG88, TSS96], visual programming interfaces [WRH92, NFS+86, CE95, EZ95, EZ96a, EZ96b], and program comprehension and reverse engineering systems [SV92, GKNV92, PSTS91]. Information displayed in graphical form is a fundamental part of contemporary life [Herd91, Tuf90]. For example, Figure 1.1 shows a graphical representation of the volume of international internet traffic over a particular two-hour period. Each country is represented by a boxshaped object located at its capital. This box is scaled and coloured according to the total number of packets emanating from that country. The curved arcs – or edges – between the countries show the intercountry traffic; the higher and redder arcs represent larger traffic flows,
1
Chapter One
Introduction
while the lower and greener arcs represent lower traffic flows. This data could also be presented in tabular form, however the graphical form reveals the underlying structure at a single glance. This visualisation has a natural geometric structure based on the geography of the globe. However, there is also information that exists in abstract – or relational – form and this information is often modeled using “graphs”. Examples of this type of information include electronic circuit connections, telecommunications network structures, flows of control in complicated systems, computer program call graphs, computer file system structures, and computer program data dependencies.
Figure 1.1: A three-dimensional visualisation of international internet traffic over a specific two hour period. (Stephen G. Eick, Bell Labs.) 2
Chapter One
Introduction
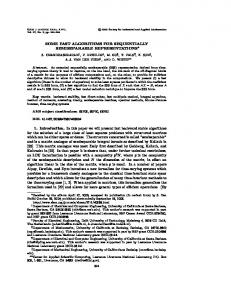
Current systems mostly use graphs to model relational structures: the entities are vertices (or nodes), and the relationships are edges (or links). For example [EMar], Figure 1.2(a) shows a graph that represents the relations between the procedures of a program; Figure 1.2(b) shows a graph that represents the relations between the classes in an object oriented design. Examples of this type of information include electronic circuit connections, telecommunications network structures, flows of control in complicated systems, computer program call graphs, computer file system structures, and computer program data dependencies. Main
Read File
Read Error
Write File
Read String
Write String
Read Char
Write Char (a)
Polygon Triangle
Quadrilateral
Parallelogram
Rectangle
Square (b)
Figure 1.2: Two sample graphs
3
Chapter One
Introduction
Current systems mostly use graphs to model relational structures: the entities are vertices (or nodes), and the relationships are edges (or links). For example [EMar], Figure 1.2(a) shows a graph that represents the relations between the procedures of a program; Figure 1.2(b) shows a graph that represents the relations between the classes in an object oriented design. The relational model is only useful to the degree that the associated diagrams effectively convey information to the engineers who use them. A good diagram is worth a thousand words, but a poor diagram can be confusing and misleading. The central problem in automatically creating a good diagram is designing an algorithm which assigns a location for each vertex and a route for each edge; this is the graph drawing problem.
1.1 Background We can classify the graph drawing problems into two classes, two-dimension problems and, three-dimension problems, see [Web98]. In this thesis, we will deal only with the two-dimension type. In this section, we discuss some of the results for drawing graphs in twodimension (2D). The bulk of known results in graph drawing relate to drawing graphs on the plane. One of the most common aesthetics is that it is preferable to have no edge crossings, “planar graph”. Fáry [Far48], Stein [Ste51], and Wagner [Wag36] proved independently that every planar graph can be drawn on the plane with straight-line edges and without edge crossings, and there are many algorithms for constructing such drawings. For example, de Fraysseix et al. [FPP90] provide an algorithm for drawing planar graphs without edge crossings where edges are drawn as straight-line segments and every vertex is positioned on a 2n×n 2D grid. Another aesthetic criterion requires that each face of the graph is drawn as a convex polygon. Tutte [Tut63] provides a method for drawing 4
Chapter One
Introduction
3-connected planar graphs without edge crossings so that each face is convex. Tutte’s method is notable for its simplicity to both understand and implement. Chiba et al. [CYN84] provide an algorithm for drawing planar graphs without edge crossings so that every face is drawn as a convex polygon, if such a drawing is possible. Edge crossings are unavoidable, however, when drawing non planar graphs on the plane. Due to the large number of available algorithms for drawing planar graphs, a common method for drawing non planar graphs is to “planarise” the graph (see for example Kant [Kan92] and Mutzel [Mut94]) – for example by replacing edge crossings with dummy vertices – and then use some planar graph drawing algorithm. The dummy vertices are then removed. Eades [Ead84] provides a method for drawing graphs in 2D where the edges and vertices of the graph are modeled as springs and steel rings, respectively. Vertex coordinates in the drawing are calculated by finding an equilibrium state for this physical system. The notable characteristics of algorithms based on the spring model are that they are easy to understand and implement, they draw both planar and nonplanar graphs, and they are usually slow. There are many methods for constructing 2D graph drawings using spring and similar models (see for example Fruchterman and Reingold [FR91] and Davidson and Harel [DH89]).
1.2 Graph Drawing This section describes the terms “graph”, “graph drawing”, “aesthetics”, and “graph drawing research”. A graph is a structure G = (V,E) in which V={v1, v2, …, vn} is a finite set of vertices and EVV is a finite set of edges, each edge is an unordered pair of vertices. We denote the set of vertices of G by V (G) and the set of edges by E(G). A good graph drawing will make clear some or all aspects of the structure of G, while a bad graph drawing may obscure these same
5
Chapter One
Introduction
aspects. Those characteristics of a graph drawing that lead us to tag it as either good or bad are called the aesthetics of the drawing. The definition of the readability of graph drawings varies between applications and users. However, some common goals, called aesthetic criteria, have been well recognized [STT81, Sug87, EL89, ES91, BNTT84, TBB88, BFN85, Lin92]: Minimize the number of edge crossings. The drawing in Figure 1.3(a) has no edge crossings; the drawing in Figure 1.3(b) has many edge crossings. For most viewers, the drawing in (a) is pleasing and easy to understand, while the drawing in (b) is difficult to follow. Minimize the number of bends in the edges. In polyline drawings, many users find it easier to follow edges with fewer bends. edges (or draw the graph with no bends at all, i.e., straight-line edges).
(b)
(a)
Figure 1.3: Two drawings of the same graph.
Maximize the resolution of the drawing. If the vertices are crowded together, or angles between edges are tiny, then the drawing has poor readability. Given a fixed area for the drawing, we would like to maximize the minimum distance between a pair of vertices, and maximize the minimum angle 6
Chapter One
Introduction
formed by a pair of edges. These are two measures of the resolution" of a drawing. Minimizing the total used area. Placing the vertices and bends on grid coordinates. Examples of aesthetic criteria include edge crossings (see Figure 1.3), the distribution of vertex positions, and symmetry (see Manning [Man90]). What makes a particular graph drawing good or bad is highly subjective in many cases, and can depend on both the specific application and the individual user (see Purchase et al. [PCJ96, PL96] ). For example, drawing area and clarity are sometimes conflicting aesthetic criteria – a graph drawing that uses only a small area of the page may simultaneously be one that is difficult to understand. Similarly, aesthetic criteria that are important in one application may be undesirable in another – information-visualisation applications require drawings that are visually easy to understand, while VLSI-layout applications (see Leighton and Rosenberg [LR86] and Rosenberg [Ros83] ) seek drawings that require the least possible drawing area and minimum total edge lengths and need not be easy to interpret. Figure 1.4 shows two drawings of K5 using different graph drawing conventions. In the drawing on the left, each vertex is drawn at a grid point and each edge is drawn as a straight line. In the drawing on the right, each vertex is drawn at a grid point but each edge is drawn as a sequence of line segments where each segment is parallel to the gridlines. The drawing on the left requires less drawing area but the edges are close together. The drawing on the right requires more drawing area, but the edges are well separated. So it is unlikely that there is a single graph drawing method that is best for all applications and users. The purpose of graph drawing research is to develop and analyse methods for visually representing graphs that maximize certain aesthetics of the drawing. Because of the conflict between aesthetics, graph drawing methods are essentially balancing acts, attempting tradeoffs between the chosen aesthetic criteria.
7
Chapter One
Introduction
Figure 1.4 The complete graph K5 drawn on the grid using two different graph drawing conventions.
1.3 Drawing Styles In this section we introduce some important drawing styles and related terminologies. Various graphic standards are used for drawing graphs. Usually, vertices are represented by symbols such as points or boxes, and edges are represented by simple open Jordan curves connecting the symbols that represent the associated vertices. From now onwards, we assume that vertices are represented by points if not specified. We now introduce the following drawing styles.
Figure 1.5: A polyline drawing of a graph.
8
Chapter One
Introduction
1.3.1 Polyline drawings A Polyline drawing is a drawing of a graph in which each edge of the graph is represented by a polygonal chain. A polyline drawing of a graph is shown in Fig. 1.5. The point at which an edge changes its direction in a polyline drawing is called a bend. Polyline drawings provide great flexibility since they can approximate drawings with curved edges. However, edges with more than two or three bends may be difficult to follow for the eye. 1.3.2 Planar drawings A drawing of a graph is planar if no two edges intersect in the drawing. Figure 1.6 shows a planar drawing and a non-planar drawing of the same graph. It is preferable to find a planar drawing of a graph if the graph has such a drawing. Unfortunately not all graphs admit planar drawings. The graph, which admits a planar drawing, is called a planar graph.
b a
a
e
f
b
c
d
e f
c
d
(a) Planar drawing
(b) Non-planar drawing
Figure 1.6: A planar drawing and a non-planar drawing of the same graph.
If one wants to find a planar drawing of a given graph, first he needs to test whether the given graph is planar or not. If the graph is planar, then he needs to find a planar representation of the graph which is a data structure representing adjacency lists: lists in which the edges incident to
9
Chapter One
Introduction
a vertex are ordered, all clockwise or all counterclockwise, according to the planar representation. Kuratowski [Kur30] gave the first complete characterization of planar graphs. Unfortunately Kuratowski's characterization does not lead to an efficient algorithm for planarity testing. Linear-time algorithms for this problem have been developed by Hopcroft and Tarjan [HT74], and Booth and Lueker [BL76]. Chiba et al. [CNAO85], Cai et al. [CHT89] and Mutzel [Mut92] gave linear-time algorithms for finding a planar representation of a planar graph. A planar graph with a fixed planar representation is called a plane graph. 1.3.3 Straight line drawings A straight line drawing is a drawing of a graph in which each edge of the graph is drawn as a straight line segment. See Figure 1.7. A straight line drawing is a special case of a polyline drawing, where edges are drawn without bend. Wagner [Wag36], Fary [Far48] and Stein [Ste57] independently proved that every planar graph has a straight line
(a) Straight line drawing
(b) Convex drawing
Figure 1.7 Straight line drawings.
11
Chapter One
Introduction
representation. Many works have been published on straight line drawings of planar graphs [DETT94]. A straight line drawing of a graph G is called a convex drawing if the faces of G are drawn as convex polygons. Although not every graph has a convex drawing, every 3connected plane graph has such a drawing [Tut60]. Several algorithms are known for finding a convex drawing of a plane graph [CYN84, CON85, Kan96]. 1.3.4 Orthogonal drawings An orthogonal drawing is a drawing of a plane graph in which each edge is drawn as a chain of horizontal and vertical line segments.( See Figure 1.8(a).) Orthogonal drawings have attracted much attention due to their numerous applications in circuit layouts, database diagrams, entity- relationship diagrams etc. Many results have been published in recent years on both planar orthogonal drawings [Bie96a, Bie96b, Kan96, Sto84, Tam87, TTV91] and non-planar orthogonal drawings [BK94, PT95, PT97]. Conventionally, each vertex in an orthogonal drawing is drawn as a point. Clearly a graph having a vertex of degree 5 or more has no orthogonal drawing, because at most four edges can be incident to a vertex in an orthogonal drawing. A box-orthogonal drawing of a graph is a drawing such that each vertex is drawn as a (possibly degenerated) rectangle, called a box, and each edge is drawn as a sequence of alternate horizontal and vertical line segments. (See Figure 1.8(b).) Every plane graph has a box-orthogonal drawing. Several results are known for boxorthogonal drawings [BK97, FKK97, PT98]. An orthogonal drawing is called a rectangular drawing if it has no bend and each face is drawn as a rectangle. Figure 1.8(c) shows a rectangular drawing of a graph.
11
Chapter One
Introduction
(a)
(b)
(c) Figure 1.8: (a) An orthogonal drawing, (b)a box-orthogonal drawing, (c) a rectangular drawing.
1.3.5 Grid drawings A drawing of a graph in which vertices and bends are located at grid points of an integer grid is called a grid drawing (see Figure 1.9). Grid drawing approach overcomes the following problems in graph drawing with real number arithmetic. 1. When the embedding has to be drawn on a raster device, real vertex coordinates have to be mapped to integer grid points, and there is no guarantee that a correct embedding will be obtained after rounding. 12
Chapter One
Introduction
2.
Many vertices may be concentrated in a small region of the drawing. Thus the embedding may be messy, and line intersections may not be detected. 3. One cannot compare area requirement for two or more different drawings using real number arithmetic, since any drawing can be fitted in any area using magnification.
H
W
(a) Straight line drawing on grid
(b) Rectangular grid drawing
Figure 1.9 Grid drawings.
The size of an integer grid required for a grid drawing is measured by the size of the smallest rectangle on the grid which encloses the drawing. The width W of the grid is the width of the rectangle and the height H of the grid is the height of the rectangle. The grid size is usually described as WH. The grid size is sometimes described by the half-perimeter W + H or the area W.H of the grid. It is a very challenging problem to draw a plane graph on a grid of the minimum size. In recent years, several works are devoted to this field [FPP90, Sch90, CN98], for example, any plane graph with n vertices has a straight line drawing on a grid of area WH (n - 1) 2.
13
Chapter One
Introduction
1.4 Properties of Drawings There are infinitely many drawings for a graph. In drawing a graph, we would like to take into account a variety of properties. For example, we may be interested in a planar orthogonal drawing of a graph corresponding to a VLSI circuit such that the number of bends in the drawing is as small as possible, because bends increase the manufacturing cost of a VLSI chip. To avoid wasting valuable space in the chip, it is important to keep the area of the drawing small. Even when we are motivated to obtain only a nice drawing, we cannot precisely define a nice drawing, and hence we consider some properties of the drawing. In this section we introduce some properties of graph drawings which we generally consider. Area. A drawing is useless unless it can be read. If the used area of the drawing is large, then we have to use many pages, or we must decrease resolution, so either way the drawing becomes unreadable. Therefore one major objective is to ensure a small area. Small drawing area is also preferable in application domains like VLSI floorplanning. Bends. At a bend, the drawing of the edge changes direction, and hence a bend on an edge increases the difficulties of following the course of the edge. For this reason, both the total number of bends and the number of bends per edge should be kept small. Crossings. Every crossing of edges bears the potential of confusion, and therefore their number should be kept small. Shape of Faces. If every face has a regular shape in a drawing, the drawing looks nice. For VLSI floorplanning, it is desirable that each face will be drawn as a rectangle.
1.5 Preliminaries In this section we define some basic terms of graph. Definitions, which are not included in this section, will be introduced, as they are needed. We start by giving some definitions of standard graph-theoretical 14
Chapter One
Introduction
terms used throughout the remainder of this thesis. For readers interested in graph theory we refer to [BM76, Eve79, NC88]. 1.5.1 Graphs and Multigraphs Throughout this thesis the number of vertices of G is denoted by n, that is, n=V, and the number of edges of G is denoted by m, that is, m=E . Figure 1.10 depicts a graph G, where each vertex in V(G)={v1, v2,…,v5} is drawn by a small circle and each edge in E(G)={e1, e2,..., e7} is drawn by a line segment , n=5 and m=7. Observe that the definition of graph in section 1.1 permits an edge to be associated with a vertex pair (vi,vi), such an edge having the same vertex as both its end vertices is called a self-loop. Edge e1 in Figure 1.10 is a self-loop. If more one edge associated with the same pair of vertices, such edges are called parallel edges or Multiple edges .For example edges e4 and e5 in Figure 1.10. e1 v1 e5 v3
e3
v2
v5
e2
e4 e6
e7 v4
Figure 1.10 A graph with five vertices and seven edges.
If a graph G has no “multiple edges” or “loops”, then G is said to be a simple graph. The graph in which loops and multiple edges are allowed is called a multigraph. Sometimes a simple graph is simply called a graph if there is no danger of confusion. In the remainder of the thesis we assume that G is simple graph. We denote an edge between two vertices u and v of G by (u, v) or simply by uv.
15
Chapter One
Introduction
A vertex and an edge of G are incident if and only if the edge contains the vertex. In Figure 1.10, for example, edges e2, e6 and e7 are incident with vertex v4. Two vertices of a graph G are called adjacent if there is an edge with these vertices as end vertices. The number of edges incident on vertex vi, with self-loops counted twice, is called the degree, deg(vi), of vertex vi. A vertex of degree one is called a pendant vertex or an end vertex. In Figure 1.10, for example, vertices v4 and v5 are adjacent, but v1 and v4 are not, deg(v1)=3, deg(v2)=4 and vertex v5 is a pendant vertex. A vertex having no degree (incident edge) is called an isolated vertex. A graph in which each vertex has the same degree is called regular graph. We define (G)= max {deg (v)vG}. The neighborhood of a vertex is all the vertices that it is adjacent to it (all of the vertex's neighbors). Labels are just the names we give vertices and edges so we can tell them apart. Two graphs are isomorphic if they are same graphs, drawn differently. In other word, two graphs are isomorphic if you can label both graphs with the same labels so that every vertex has exactly the same neighbors in both graphs. The order of a graph is the number of its vertices. 1.5.2 Subgraphs A subgraph of a graph G=(V,E) is a graph G0 = (V0 ,E0) such that V0 V and E0 E; we then write G0G. If G0 contains all the edges of G that join two vertices in V0, then G0 is said to be the subgraph induced by V0, and is denoted by G[V0]. Figure 1.11(b) depicts a subgraph of G in Figure 1.11(a) induced by {v1, v2, v3, v4}. We often construct new graphs from old ones by deleting some vertices or edges. If v is a vertex of a given graph G = (V,E), then G - v is the subgraph of G obtained by deleting the vertex v and all the edges incident to v. More generally, if V0 is a subset of V , then G -V0 is the subgraph of G obtained by deleting the vertices in V0 and all the edges incident to them. Then G -V0 is a subgraph of G induced by V - V0. 16
Chapter One
Introduction
Similarly, if e is an edge of G, then G - e is the subgraph of G obtained by deleting the edge e. More generally, if E0 -E, then G -E0 is the subgraph of G obtained by deleting the edges in E0. 5 f 1
h
1
a
a i
4
c
b 2
2
e d
6
4
c
b
g
e d
3
j
3
(a)
(b)
Figure 1.11 (a) A graph, (b) A vertex-induced subgraph .
1.5.3 Paths and Cycles A v0–vl walk, v0, e1, v1, …,vl-1; el, vl, in G is an alternating sequence of vertices and edges of G, beginning and ending with a vertex, in which each edge is incident to two vertices immediately preceding and following it. If the vertices v0, v1, …, vl are distinct (except possibly v0,vl), then the walk is called a path and usually denoted either by the sequence of vertices v0, v1, …,vl or by the sequence of edges e1 e2, …, el. The length of the path is l, one less than the number of vertices on the path. A path or walk is closed if v0= vl. A closed path containing at least one edge is called a cycle. More precisely, x=x0, e1, x1, e2,… ,ek , xk = y is a path between x and y, if ei-1=(xi-1,xi)G (for 1 i k). If x=y and k >0, then there is a path with the same begin- and endpoint. Such a path is called a cycle. A cycle of G consisting of 3 edges is called a triangle. If the vertices on the path have degree 2, then the path is called a chain.
17
Chapter One
Introduction
1.5.4 Connectivity A graph G is connected if for every pair {u, v} of distinct vertices there is a path between u and v. A graph which is not connected is called a disconnected graph. A (connected) component of a graph is a maximal connected subgraph. The graph in Figure 1.12 (a) is a connected graph since there is a path for every pair of distinct vertices of the graph. On the other hand the graph in Figure 1.12 (b) is a disconnected graph since there is no path between v1 and v5. The graph in Figure 1.12 (b) has two connected components G1 and G2 indicated by dotted lines. The connectivity (G) of a graph G is the minimum number of vertices whose removal results in a disconnected graph or a single-vertex graph K1. We say that G is k-connected if (G) k. We call a set of vertices in a connected graph G a separator or a vertex cut if the removal of the vertices in the set results in a disconnected or single-vertex graph. If a vertex-cut contains exactly one vertex then we call the vertex a cut vertex. v1
v2
v1
v2 G1
(b) v3 v3 v4 v4
v5
v5 G2 (a) Figure 1.12 (a) a connected graph, (b) a disconnected graph with two connected components.
Let G–{v} denote the graph after deleting vertex v with all its incident edges. If G-{v} is disconnected, then v is called a cutvertex of G. If (x, y) is an edge such that (V,E-{ (x, y) }) is disconnected, then (x,y) is called a bridge of G. Let us consider the connectivity aspects of graphs 18
Chapter One
Introduction
and the involved definitions in more detail. If G is connected and contains no cutvertices, then G is called biconnected or 2-connected. If G is connected and contains no bridges, then G is called bridge-connected or 2-edge-connected. In general, G is k-connected if there is no set of k-1 vertices, whose removal disconnects G. Such a set, is called a separating (k-1) set. By Menger's theorem, G is k-connected if there exist k vertexdisjoint paths between any two vertices of G. A 2-set of vertices is called a separation pair or cutting pair. A maximal biconnected subgraph is called a biconnected component or block. 1.5.5 Trees A tree is a connected graph without any cycle. Figure 1.13 (a) is an example of a tree. The vertices in a tree are usually called nodes. A rooted tree is a tree in which one of the nodes is distinguished from the others. The distinguished node is called the root of the tree. The root of a tree is generally drawn at the top. In Figure 1.13 (a), the root is v1. Every node u other than the root is connected by an edge to some other node p called the parent of u. We also call u a child of p. We draw the parent of a node above that node. For example, in Figure 1.13 (a), v1 is the parent of v2, v3 and v4, while v2 is the parent of v5 and v6 , v2 , v3 and v4 are children of v1, while v5 and v6 are children of v2. A leaf is a node of a tree that has no children. An internal node is a node that has one or more children. Thus every node of a tree is either a leaf or an internal node. In Figure 1.13 (a), the leaves are v4, v5, v6 and v7, and the nodes v1, v2 and v3 are internal nodes. The parent-child relationship can be extended naturally to ancestors and descendants. Suppose that u1, u2,… ,ul is a sequence of nodes in a tree such that u1 is the parent of u2, which is a parent of u3, and so on. Then node u1 is called an ancestor of ul and node ul a descendant of u1. The root is an ancestor of every node in a tree and every node is a descendant of the root. In Figure 1.13 (a), all seven nodes are
19
Chapter One
Introduction
descendants of v1, and v1 is an ancestor of all nodes. The height of a node u in a tree is the length of a longest path from u to a leaf. The height of a tree is the height of the root. The depth of a node u in a tree is the length of a path from the root to u. The level of a node u in a tree is the height of the tree minus the depth of u. In Figure 1.13(a), for example, node v3 is of height 1, depth 1 and level 1. The tree in Figure 1.13(a) has height 2.
v1 v2 v5
v3 v6
v4
v7
(a)
a b
a b
c
c d
d
(b)
(c)
Figure 1.13 (a) a tree, (b) binary tree, (c) representation of binary tree
1.5.6 Binary Trees A binary tree is either empty or else it consists of a root node and two subtree, called the left subtree and right subtree, which are themselves binary trees. When drawing binary trees, left subtrees are 21
Chapter One
Introduction
always shown at the end of an edge slanting to the left, and right subtrees at the end of an edge slanting to the right. For example, the subtrees whose root is c in Figure 1.13(b) is a right subtree. See [Kin98]. Empty binary trees are usually shown as blank spaces with no edge leading to them, but sometimes it is convenient to represent them explicitly, so they can be seen. For example, an alternative representation of the tree given in Figure 1.13 (b) is Figure 1.13(c) in which the empty subtrees appear as square nodes. The square nodes are also called external nodes, and the set of all external nodes of a binary tree T is denoted E(T). The square node version is sometimes called an extended binary tree. The round nodes are called internal nodes, and I(T) denoted the set of internal nodes of T. A binary tree with n internal nodes has n+1 external nodes. The extended version of the empty tree looks like one square without any edge. We often drop the word “internal”, speaking, for example, of a tree with n nodes, meaning n internal nodes. When designing algorithms on graphs, we often need a method for exploring the vertices and edges of a graph. In this section we introduce such a method named depth first search (DFS). In DFS each edge is traversed exactly once in the forward and reverse directions and each vertex is visited. Thus DFS runs in linear time. We now describe the method. Consider visiting the vertices of a graph in the following way. We select and visit a starting vertex v. Then we select any edge (v, w) incident on v and visit w. In general, suppose x is the most recent visited vertex. The search is continued by selecting some unexplored edge (x, y) incident on x. If y has been previously visited, we find another new edge incident on x. If y has not been previously visited, then we visit y and begin a new search starting at y. After completing the search through all paths beginning at y, the search returns to x, the vertex from which y was first reached. The process of selecting unexplored edges incident to x is continued until the list of these edges is exhausted. This method is called
21
Chapter One
Introduction
depth-first search since we continue searching in the deeper direction as long as possible.
1.6 Planar Graphs In this section we give some definitions related to planar graphs used in the remainder of the thesis. For readers interested in planar graphs we refer to [NC88]. 1.6.1 Planar graphs and plane graphs A graph is planar if it can be embedded in the plane so that no two edges intersect geometrically except at a vertex to which they are both incident. Note that a planar graph may have an exponential number of embeddings. Figure 1.14 shows four planar embeddings of the same planar graph.
(a)
(b)
(c)
(d)
Figure 1.14 Four planar embeddings of the same graph.
22
Chapter One
Introduction
A plane graph is a planar graph with a fixed embedding. A plane graph divides the plane into connected regions called faces. We regard the contour of a face as a clockwise cycle formed by the edges on the boundary of the face. We denote the contour of the outer face of graph G by Co(G). A Co(G)-component is either a K2 whose vertices (but not edges) are in Co(G) or consists of a connected component of G-V (Co(G)) together with the edges from that component to Co(G) and their ends [Tho84]. The contour Co(G) of graph G in Figure 1.15 (a) is drawn by thick line, and the Co(G)-components H1, H2 and H3 of G are shown in Figure 1.15 (b).
H3 H1 H2
(a)
(b) Figure 1.15 C0(G)-components.
For a simple cycle C in a plane graph G, we denote by G(C) the plane subgraph of G inside C (including C). The shaded subgraph in Figure 1.16 is G(C) for the cycle C. An edge e of G(C) is called an outer edge of G(C) if e is located on C; otherwise, e is called an inner edge of G(C). An edge, which is incident to exactly one vertex of a simple cycle C and located outside of C is called a leg of C, and the vertex of C to which the leg is incident is called a leg-vertex of C. A simple cycle C in G is called a k-legged cycle of G if C has exactly k legs. A k-legged cycle C is minimal if G(C) does not contain any other k-
23
Chapter One
Introduction
legged cycle of G. The cycle C in Figure 1.16 is a 4-legged cycle with the legs e1, e2, e3 and e4. We say that simple cycles C and C0 in a plane graph G are independent if G(C) and G(C0) have no common vertex. A set S of cycles is independent if any pair of cycles in S are independent.
e2 e1 e3 G(C) C
e4 Figure 1.16: Illustration of G(C) and legs of a cycle C.
1.6.2 Euler's formula There is a simple formula relating the number of vertices, edges and faces in a connected plane graph. It is known as Euler's formula because Euler established it in 1750 for those plane graphs defined by the vertices and edges of polyhedra. We now present Euler's formula as the following Lemma. Lemma 1.6.1 Let G be a connected plane graph, let n, m, and f denote respectively the number of vertices, edges and faces of G. Then n - m + f = 2. 1.6.3 Dual graphs For a plane graph G, we often construct another graph G* called the (geometric) dual of G as follows. A vertex v*i is placed in each face of Fi of G, these are the vertices of G*. Corresponding to each edge e of G we draw an edge e* which crosses e (but no other edge of G) and joins 24
Chapter One
Introduction
the vertices v* i which lie in the faces F i adjoining e, these are the edges of G*. The construction is illustrated in Figure 1.17, the vertices v* i are represented by small white circles, and the edges e* of G* by dotted lines. G* is not necessarily a simple graph even if G is simple. Clearly the dual G* of a plane graph G is also plane. One can easily observe the following lemma.
Figure 1.17: A plane graph G and its dual graph G*.
Lemma 1.6.2 Let G be a connected plane graph with n vertices m edges and f faces, and let the dual G* have n* vertices, m* edges and f* faces, then n* = f, m* = m, and f* = n. Clearly the dual of the dual of the plane graph G is the original graph G. However a planar graph may give rise to two or more geometric duals
25
Chapter One
Introduction
since the plane embedding is not necessarily unique.
1.7 Algorithms and Complexity In this section we briefly introduce some terminologies related to complexity of algorithms. For interested readers, we refer the books of Garey and Johnson [GJ79]. The most widely accepted complexity measure for an algorithm is the running time which is expressed by the number of operations it performs before producing the final answer. The number of operations required by an algorithm is not the same for all problem instances. Thus, we consider all inputs of a given size together, and we define the complexity of the algorithm for that input size to be the worst case behavior of the algorithm on any of these inputs. Then the running time is a function of size n of the input. 1.7.1 The notation O(n) In analyzing the complexity of an algorithm, we are often interested only in the "asymptotic behavior," that is, the behavior of the algorithm when applied to very large inputs. To deal with such a property of functions we shall use the following notations for asymptotic running time. Let f(n) and g(n) are the functions from the positive integers to the positive reals, then we write f(n) =O(g(n)) if there exists positive constants c1 and c2 such that f(n) c1g(n)+c2 for all n. Thus the running time of an algorithm may be bounded from above by phrasing like "takes time O(n2 )." 1.7.2 Polynomial algorithms An algorithm is said to be polynomially bounded (or simply polynomial) if its complexity is bounded by a polynomial of the size of a problem instance. Examples of such complexities are O(n), O(n log n), O(n100), etc. The remaining algorithms are usually referred as exponential or non-polynomial. Example of such complexity are O(2n), O(n!), etc. 26
Chapter One
Introduction
When the running time of an algorithm is bounded by O(n), we call it a linear-time algorithm or simply a linear algorithm.
27
References
References [BBB+86]
C. Batini, P. Brunetti, G. di Battista, P. Naggar, E. Nardelli, G. Richelli, and R. Tamassia. An automatic layout facility and its applications. In Proc. Int. Workshop on Software Engineering Environment, pages 139-157, Beijing, China, China Academic Publishers. (1986).
[BETT94]
G. Di Battista, P. Eades R. Tamassia, I.G. Tollis, Algorithms for
Drawing
Graphs,
an
Annotated
Bibliography,
Computational Geometry: Theory and application 4, 234282. (1994). [Bie96a]
T. C. Biedl, New lower bounds for orthogonal graph drawings, Proc. Graph Drawing'95,Lect. Notes in Computer Science, 1027, pp. 28-39. (1996).
[Bie96b]
T. C. Biedl, Optimal orthogonal drawings of triconnected plane graphs, Proc. Scandinavian Workshop on Algorithm Theory, SWAT'96, Lect. Notes in Computer Science, 1097, pp. 333-344. (1996).
[BFN85]
C. Batini, L. Furlani, and E. Nardelli. What is a good diagram? A pragmatic approach. In Proc. 4th Int. Conf. on the Entity Relationship Approach, (1985).
[BK94]
T. C. Biedl and G. Kant, A better heuristic for orthogonal graph drawings, Proc. Of 2nd European Symposium on Algorithms, Lect. Notes in Computer Science, 855, pp. 2435. (1994).
[BK97]
T. C. Biedl and M. Kaufmann, Area-efficient static and incremental graph drawings, Proc. of 5th European 571
References
Symposium on Algorithms, Lect. Notes in Computer Science, 1284, pp. 37-52. (1997). [BL76]
K. S. Booth and G. S. Lueker, Testing the consecutive ones property, interval graphs, and graph planarity using PQtree algorithms, J. Comput. Syst. Sci., 13, pp. 335- 379. (1976).
[BLSV92]
G. di Battista, G. Liotta, M. Strani, and F. Vargiu. Diagram server. In Advanced Visual Interfaces (Proceedings of AVI'92), volume 36 of World Scientific Series in Computer Science, pages 415-417, (1992).
[BM76]
J.A. Bondy and U.S.R.
Murty. Graph Theory with
Applications. North-Holland, New York, N.Y., (1976). [BNTT84]
C. Batini, E. Nardelli, M. Talamo, and R. Tamassia. A graph theoretic approach to aesthetic layout of information systems diagrams. In Proc. 10th Int. Workshop on Graph Theoretic Concepts in Computer Science (Berlin June 1984), pages 9-18. Trauner Verlag, (1984).
[BNTT85]
C. Batini, E. Nardelli, M. Talamo, and R. Tamassia. GINCOD: a graphical tool for conceptual design of data base applications. In A. Albano, V. de Antonellis, and A. di Leva, editors, Computer Aided Data Base Design, pages 3351. North-Holland, New York, N.Y.,(1985).
[BT86]
G. di Battista and R. Tamassia. An integrated graphic system for designing and accessing statistical data bases. In Proc. 7th Symp. On Computational Statistics (COMPSTAT 1986), pages 231-236. PhysicaVerlag, (1986). 571
References
[BTT84]
C. Batini, M. Talamo, and R. Tamassia. Computer aided layout of entity-relationship diagrams. Journal of Systems and Software, 4:163-173. (1984).
[CE95]
I.F. Cruz and P. Eades, editors. Special Issue on Graph Visualization, volume 6(3) of J. Visual Languages and Computing. (1995).
[CHT89]
J. Cai, X. Han and R. E. Tarjan, New solutions to four planar graph problems, Tech. Report, Dept. of Computer Science, New York University/ Courant Institute, (1989).
[CK97]
M. Chrobak, and G. Kant, Convex Grid Drawing of 3Connected
Planar
Graphs,
International
Journal
of
Computational Geometry & Applications Vol. 7, No. 3, 211-223. (1997). [CN98]
M. Chrobak and S. Nakano, Minimum-width grid drawings of plane graphs, Comp. Geom. Theory Appl., 11, pp. 29-54. pp. 104-110. (1998)
[CNAO85] N. Chiba, T. Nishizeki, S. Abe and T. Ozawa, A linear algorithm for embedding planar graphs using PQ-trees, J. Comput. Syst. Sci.,30, pp. 54-76. (1985). [CON85]
N. Chiba, K. Onoguchi, and T. Nishizeki, Drawing planar graphs nicely, Acta Informatica, 22, pp. 187-201. (1985).
[CP95]
M. Chrobak and T. Payne, A liner-time algorithm for drawing a planar graphs on a grid, Information Processing Letters 54, 241-246. (1995).
[CYN84]
N. Chiba, T. Yamanouchi, and T. Nishizeki, Linear algorithms for convex drawing of planar graphs, (Eds.) J.A. 577
References
Bondy and U.S.R. Murty, Progress in Graph Theory, Academic Press Canada, , pp. 157-173. (1984). [DETT94]
G. Di Battista, P. Eades, R. Tamassia and I. G. Tollis, Algorithms for drawing graphs: an annotated bibliography, Comp. Geom. Theory Appl., 4, pp. 235-282. (1994).
[EG94]
S. Even and G. Granot. Rectilinear planar drawings with few bends in each edge. Technical Report 797, Computer Science Department, Technion, Haifa, Israel Institute of Technology, (1994).
[EL89]
P. Eades and X. Lin. How to draw directed graphs. In Proc. IEEE Workshop on Visual Languages (VL'89), pages 1317, (1989).
[EMar]
P. Eades and P. Mutzel. Handbook on Algorithms and Theory
of
Computation,
chapter
Graph
Drawing
Algorithms. CRC Press, to appear. [ES91]
P. Eades and K. Sugiyama. How to draw a directed graph. Journal of Information Processing, pages 424-437, (1991).
[Eve79]
S. Even. Graph Algorithms. Computer Science Press, Potomac, Mary-land, (1979).
[EZ95]
P. Eades and K. Zhang, editors. Special Issue on Software Visualization, volume 27 (4) of Australian Computer Journal. (1995).
[EZ96a]
P. Eades and K. Zhang. Software Visualization. World Scientific, (1996).
[EZ96b]
P. Eades and K. Zhang, editors. Special Issue on Software Visualization, volume 28 (1) of Australian Computer Journal. (1996). 571
References
[Far48]
I. Fáry, On straight lines representation of planar graphs, Acta Sci. Math. Szeged 11, 229-233. (1948).
[FKK97]
U. Fößmeier, G. Kant and M. Kaufmann, 2-visibility drawings of plane graphs, Proc. of Graph Drawing '96, Lect. Notes in Compute Science, 1190, pp. 155-168. (1997).
[FPP88]
H. de Fraysseix, J. Pach and R. Pollack, Small sets supporting Straight-Line Embeddings of planar graphs, in: proc. 20th Ann. Symp. on Theory of computing, 426-433. (1988).
[FPP90]
H. de Fraysseix, J. Pach and R. Pollack, How to draw a planar graph on a grid, Combinatorica, 10, pp. 41-51. (1990).
[GJ79]
M. R. Garay and D. S. Johnson, Computers and Interacterability, A Guide to the Theorey of NPcompleteness, Freeman, (1979).
[GKNV92] E.R. Gansner, E. Koutso_os, S.C. North, and K.P. Vo. Graph visualization
in
software
analysis.
Symposium
on
Assessment
of
In
Proc.
Quality
IEEE
Software
Development Tools, (May 1992). [GT95]
A. Garg and R. Tamassia. On the computational complexity of upward and rectilinear planarity testing. In R. Tamassia and I. G. Tollis, editors, GD'94, volume 894 of Lecture Notes in Computer Science, pages 286-297. SpringerVerlag, (1995).
[Har88]
D. Harel. On visual formalisms. Communications of the ACM,31(5) p.p.514-530, (1988). 571
References
[Herd91]
Walter Herdeg, The Graphics Press, Zűrich, (1991).
[HT74]
J. E. Hopcroft and R. E. Tarjan, Efficient planarity testing, J. Assoc, Comput. Mach., 21, pp. 549-568. (1974).
[HU91]
Hagerup, T., and C. Uhrig, Triangulating a Planar Graph, in: Library of Efficient Datatypes and Algorithms (LEDA), software package, Max-Plank Institüt für Informatik, Saarbrücken, (1991).
[JEM+91]
S. Jones, P. Eades, A. Moran, N. Ward, G. Delott and R. Tamassia, A note on graph drawings algorithms, Tech. Rept. 216, Dept. of Computer Science, University of Queensland, (1991).
[Kam89]
T. Kamada. Visualizing Abstract Objects and Relations. World Scientific Series in Coputer Science, (1989).
[Kan92]
G. Kant, Drawing planar graphs using the lmc-ordering, Extended Abstract in: Proc. 33th Ann. IEEE Symp. on Found. of Comp. Science, Pittsburgh, pp. 101-110. (1992).
[Kan93a]
G. Kant, Algorithms for Drawing Planar Graphs, Ph. D. Dissertatation, Department of Computer Science, University of Utrecht, (1993).
[Kan93b]
G. Kant, Hexagonal grid drawings, in: E.W. Mayr (Ed.), Proc. 18th Intern. Workshop on Graph-Theoretic Concepts in Comp. Science (WG'92), Lecture Notes in Comp. Science 657, Springer-Verlag, pp. 263-276. (1993).
[Kan96]
G. Kant, Drawing planar graphs using the canonical ordering, Algorithmica 16, pp. 4-32. (1996). 511
References
[Kaw75]
J. Kawakita. The KJ method-a scientific approach to problem solving. Technical report, Kawakita Research Institute, Tokyo, (1975).
[KB92]
G. Kant, and H.L. Bodlaender, Triangulating planar graphs while minimizing the maximum degree, in: O. Nurmi and E. Ukkonen (Eds.), Proc. 3rd Scand. Workshop on Algorithm Theory, Lecture Notes in Comp. Science 621, SpringerVerlag, pp. 258-271. (1992).
[Kin98]
J. H. Kingston, Algorithms and Data Structures, Design, Correctness, Analysis, Secend Edition, Addison-Wesley. (1998).
[KK88]
T. Kamada and S. Kawai. Automatic display of network structures for human understanding. Technical Report 88007, Department of Information Science, University ofTokyo, (1988).
[KMG88]
G. Kar, B.P. Madden, and R.S. Gilbert. Heuristic layout algorithms for network management presentation services. IEEE Network, pages 29-36, November (1988).
[Kur30]
C. Kuratowski, Sur le probleme des courbes gauches en topologie, Fundamenta Math., 15, pp. 271-283. (1930).
[KvL85]
M. R. Kramer and J. van Leeuwen. The complexity of wirerouting and finding minimum area layouts for arbitrary VLSI circuits. In F.P. Preparata, editor, Advances in Computing Research, volume 2, pages 129-146. JAI Press, Greenwich, Conn., (1985).
515
References
[Lei80]
C. E. Leiserson. Area-efficient graph layouts (for VLSI). In Proceedings of the IEEE Symposium on the Foundations of Computer Science, pages 270 - 281. (1980).
[Lin92]
X. Lin. Analysis of Algorithms for Drawing Graphs. PhD thesis, Department of Computer Science, University of Queensland, Australia, (1992).
[LR86]
Frank T. Leighton and Arnold L. Rosenberg, TheeDimensional Circuit Layouts. SIAM J. Comput. , Vol. 15, No. 3, pp. 793-813, August (1986).
[Man90]
Joseph B. Manning. Geometric Symmetry in Graphs. PhD Thesis, Purdue University, December (1990).
[Mut92]
P. Mutzel, A fast linear time embedding algorithm based on the Hofcroft-Tarjan planarity test, Tech. Report, (1992).
[NC88]
T. Nishizeki and N. Chiba, Planar Graphs: Theory and Algorithms, North-Holland, Amsterdam, (1988).
[NFS+86]
K. Nakamura, H. Fujimoto, T. Suzuki, Y. Tarui, and Y. Kiyokane.
Visual
programming
environment
in
communications software. In Proc. 5th IEEE Global Telecom Conference, pages 435-439, (1986). [PCJ96]
Helen C. Purchase, Robert Cohen, and Murray James. Validating Graph Drawing Aesthetics. In Proc. Graph Drawing’95, Lecture Notes in Computer Science, Vol. 1027, pp. 435-446, Springer-Verlag, Berlin, (1996).
[PL96]
Helen C. Purchase, and David Leonard. Graph Drawing Aesthetic Metrics. Technical Report No. 361, Department of Computer Science, University of Queensland, Australia, May (1996). 511
References
[PSTS91]
L.B. Protsko, P.G. Sorenson, J.P. Tremblay, and D.A. Schaefer. Towards the automatic generation of software diagrams. IEEE Transactions on Software Engineering, SE17(1):10-21, (1991).
[PT95]
A. Papakostas and I. G. Tollis, Improved algorithms and bounds for orthogonal drawings, Proc. of GD'94, Lect. Notes in Computer Science, 894, pp. 40-51. (1995).
[PT97]
A. Papakostas and I. G. Tollis, A pairing technique for area efficient orthogonal drawingsProc. of GD'96, Lect. Notes in Computer Science, 1190, pp. 40-51. (1997).
[PT98]
A. Papakostas and I. G. Tollis, Orthogonal drawings of high degree graphs with small area and few bends, Proc. of 5th Workshop on Algorithms and Data Structures, Lect. Notes in Computer Science, 1272, pp. 354-367. (1998).
[RBB+84]
D. Reiner, M. Brodie, G. Brown, M. Chilenskas, M. Friedell, D. Kramlich, J. Lehman, and A. Rosenthal. A database design and evaluation workbench: Preliminary report. In Proc. Int. Conf. on Systems Development and Requirements Specification, (1984).
+
[RBF 87]
D. Reiner, G. Brown, M. Friedell, J. Lehman, R. McKee, P. Rheingans, and A. Rosenthal. A database designer's workbench. In S. Spaccapietra, editor, Entity-Relationship Approach: Proc. 5th Int. Conf. on Entity-Relationship Approach (Dijon France 1987), pages 347-360,New York, N.Y.,. North-Holland. (1987).
511
References
[Rea87]
Read, R.C., A new method for drawing a graph given the cyclic order of the edges at each vertex, Congr. Numer. 56, pp. 31-44. (1987).
[Rad2001]
A. A. A. Radwan, A new algorithm for orthogonal drawing of 3-Planar Graphs. To be appear on the proceedings of the 4th International Conference on Artificial Intelligence Applications, Cairo, Egypt, Febarary 7-10,2001. Also it has been accepted for publication on the In
International
Journal of Applied Mathematics. [RE2000a] A. A. A. Radwan, M. A. El-Sayed, A linear-time algorithm for drawing a planar graphs on an (n-2)×(n-2) grid. International Journal of Applied Mathematics, Volume 2 No. 4, 483-494, (2000). [RE2000b] A. A. A. Radwan, M. A. El-Sayed, Linear-time Algorithm for Convex Grid Drawings of 3-connected Planar Graph. International Journal of Applied Mathematics, Volume 2 No. 11, 1335-1348, (2000). [Ros83]
Arnold L. Rosenberg. Three-Dimensional VLSI: A case Study. JACM, Vol. 30, No. 3 PP. 397-416,( july 1983).
[RT86]
P. Rosenstiehl and R.E. Tarjan, Rectilinear planer layouts and bipolar orientations of planar
graphs, Discrete
Comput. Geom. 1 343-353. (1986). [Sch89]
W. Schynder, planar graphs and poset dimension, Order 5, 323-343. (1989).
511
References
[Sch90]
W. Schnyder, Embedding planar graphs in the grid, in Proc. 1st Ann. ACM-SIAM Symp. on Discrete Algorithms, San Francisco, pp. 138-147. (1990).
[ST92]
W. Schynder, W. Trotter, Convex drawings of
planar
graphs , Abstract Amer. Math. Soc. 13 (5) (1992). [Ste51]
K. S. Stein, Convex maps, Proc. Amer. Math. Soc., 2, pp. 464-466. (1951).
[Sto84]
J. A. Storer, On minimal node-cost planar embeddings, Networks, 14, pp. 181-212. (1984).
[STT81]
K. Sugiyama, S. Tagawa, and M. Toda. Methods for visual understanding of hierarchical systems. IEEE Transactions on Systems, Man and Cybernetics, SMC-11 (2):109-125, (1981).
[Sug87]
K. Sugiyama. A cognitive approach for graph drawing. Cybernetics and Systems: An International Journal, 18:447488, (1987).
[SV92]
J.C. Smart and V. Vemuri. A-vu: A visualization tool for complex software systems. In Proc. IEEE Symposium on Assessment of Quality Software Development Tools, (May 1992).
[Tam85]
R. Tamassia. New layout techniques for entity-relationship diagrams. In Proc. 4th Int. Conf. on Entity-Relationship Approach, pages 304-311. (1985)
[Tam87]
R. Tamassia, On embedding a graph in the grid with the minimum number of bends, SIAM J. Computing, 16(3), pp. 421-444. (1987). 511
References
[TBB88]
R. Tamassia, G. di Battista, and C. Batini. Automatic graph drawing and readability of diagrams. IEEE Transactions on Systems, Man and Cybernetics, SMC-18(1):61-79, (1988).
[Tho80]
C. Thomassen, Planarity an duality of finite and infinite planar graphs, Journal of Combinatorial Theory B 29 (1980) 244-271.
[Tho84]
C. Thomassen, Plane representations of graphs, (Eds.) J.A. Bondy and U.S.R. Murty, Progress in Graph Theory, Academic Press Canada, (1984), pp. 43-69.
[TSS96]
Tom Sawyer Software. Network layout assistant user's guide. Berkeley, CA, (1996).
[TT87]
R. Tamassia and I.G. Tollis. Efficient embedding of planar graphs in linear time. In Proc. IEEE Int. Symp. on Circuits and Systems , pages 495-498. (1987).
[TT89]
R. Tamassia and I.G. Tollis. Planar grid embedding in linear time. IEEE Trans. on Circuits and Systems, CAS36(9):1230-1234. (1989).
[TTV91]
R. Tamassia, I. G. Tollis and J. S. Vitter, Lower bounds for planar orthogonal drawings of graphs, Inf. Proc. Letters 39, pp. 35-40. (1991).
[Tuf90]
Edward R. Tufte, Envisioning Information, Graphics Press, Connecticut, (1990).
[Tut60]
W. T. Tutte, Convex representations of graphs, Proc. London Math. Soc., 10, pp. 304-320. (1960).
[Tut63]
W.T. Tutte, How to draw a graph, Proc. London Math. Soc. 13 743-768. (1963). 511
References
[Ull84]
J.D. Ullman. Computational Aspects of VLSI. Principles of Computer Science. Computer Science Press, Rockville, Md., (1984).
[Val81]
L. Valiant. Universality considerations in VLSI circuits. IEEE Transactions on Computers, C-30(2):135-140. (1981)
[Wag36]
K.
Wagner,
Bemerkungen
zum
vierfarbenproblem,
Jahresbericht. Deutsch. Math-Verien., 46, pp. 26-32. (1936). [Web98]
R. J. Webber, Ph. D. ,Finding the Best Viewpoints for Three-Dimensional Graph Drawings, The Department of Computer
Science
and
Software
Engineering
The
University of Newcastle, Australia,(1998). [WRH92]
C. Williams, J. Rasure, and C. Hansen. The state of the art of visual languages for visualization. In Visualization 92, pages 202 - 209, (1992).
517