ABSTRACT. A forecasting model of new product demand has been developed and applied to forecast new vehicle demand in Malaysia. Since the publication of ...
Journal of Mathematics and Statistics, 9 (2): 84-90, 2013
ISSN 1549-3644 © 2013 Science Publications doi:10.3844/jmssp.2013.84.90 Published Online 9 (2) 2013 (http://www.thescipub.com/jmss.toc)
A STUDY ON NEW PRODUCT DEMAND FORECASTING BASED ON BASS DIFFUSION MODEL Zuhaimy Ismail and Noratikah Abu Department of Mathematics, Faculty of Science, Universiti Teknologi Malaysia, 81310 UTM Skudai, Johor Darul Takzim, Malaysia Received 2012-06-28, Revised 2012-12-05; Accepted 2013-04-29
ABSTRACT A forecasting model of new product demand has been developed and applied to forecast new vehicle demand in Malaysia. Since the publication of the Bass model in 1969, innovation of new diffusion theory has sparked considerable research among marketing science scholars, operational researchers and mathematicians. This study considers the Bass Model for forecasting the diffusion of new products or an innovation in the Malaysian society. The objective of the proposed model is to represent the level of spread on new products among a given set of society in terms of a simple mathematical function that elapsed since the introduction of new products. With limited amount of data available for new products, a robust Bass model was developed to forecast the sales volume. A procedure of the proposed diffusion model was designed and the parameters were estimated. Results obtained by applying the proposed model and numerical calculation show that the proposed Bass diffusion model is robust and effective for forecasting demand of new products. This study concludes that the newly developed bass diffusion of demand function has significantly contributed for forecasting the diffusion of new products. Keywords: Bass Diffusion Model, Forecasting, New Product and Forecast Accuracy divided into six different definitions, which are new-tothe world products, new-to-the firm products, additions to existing product lines, improvements and revisions to existing products, repositioning and cost reductions. When dealing with new product demand, there are problems to be considered. First, new product forecasting has low credibility and low accuracy level because of lack or no historical data as it is just based on assumptions. Secondly, time requires to develop forecast of new products is longer because it requires more manual attention. Lastly, data uncertainty and data scarcity occur when it comes to new products. In the past few decades, many studies were made on demand forecasting but currently not much has been done on forecasting of new product demand. New product forecasting serves as a reality check by providing visibility to what is likely to happen. The forecast of new product demand forecasting is expected
1. INTRODUCTION Demand forecasting is an iterative process for estimating the quantity of products or services that customers will purchase or consume. Many approaches are available in demand forecasting which include the informal and formal method of forecasting. Demand forecasting may be used in determining prices, assessing future capacity requirements, or making decisions on whether to implement new power plant for the new township development. It is particularly essential for companies to produce the required quantities at the right time and arrange well in advance for various elements in the production processes. New product demand forecasting is a process that determines a reasonable estimate of sales attainable under a given set of conditions. New products can mean different things to different people. New product can be
Corresponding Author: Zuhaimy Ismail, Department of Mathematics, Faculty of Science, Universiti Teknologi Malaysia, 81310 UTM Skudai, Johor Darul Takzim, Malaysia Science Publications
84
JMSS
Zuhaimy Ismail and Noratikah Abu / Journal of Mathematics and Statistics 9 (2): 84-90, 2013
to be useful for companies to know better the performance of their new products and take action whenever necessary. In this study, we focus on new product demand forecasting which receives less attention among the researchers. This study presents introduction, material and methods, results and conclusions.
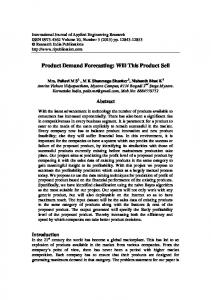
users (Fisher and Pry, 1971). The Bass model is by far the most common diffusion model used in marketing and it is a mixed model capturing both innovative and imitative effects. Bass (1969), Bass assumed that potential adopters of an innovation are influenced by two types of channel communications. Adopters that receive innovation from mass media and other external factors are called innovators while adopters that receive innovation from word-of-mouth and observation or other interpersonal factors are called imitators. In building Bass model, the basic assumption is that the probability of an initial purchase takes place at time t, given that no purchase has yet been made is a linear function of the number of previous buyers. The conceptual structure of Bass model is presented in Fig. 1. As shown in Fig. 1, the new adopters include innovators and imitators. When new products or technologies are introduced into the market, the number of innovators decreases because of less potential innovators. On the other hand, the imitators increase due to the word-of-mouth communications that give strong influence to the imitators when more users adopt new products. Then, the internal influences increase the noncumulative adopters to a peak and then drops gradually as the market get saturated.
1.1. Literature Review 1.1.1. Bass Diffusion Model Diffusion is a process by which an innovation is communicated through certain channels over time among the members of the social system (Rogers, 1983). Mahajan and Muller (1979), stated in their research on innovation diffusion and new product growth models in marketing that the objective of diffusion model is to represent the level of spread of an innovation among a given set of prospective adopters over time. The purpose of the model is to depict the successive increases in the number of adopters and predict the continued development of a diffusion process which already in progress. Innovative models of diffusion focus on communications, external to the social system such as advertising and personal selling (Fourt and Woodlock, 1960). The imitative models of diffusion focus on communications, internal to the social system such as word of mouth reports and observation of other
Fig. 1. Numbers of new adopters versus time Science Publications
85
JMSS
Zuhaimy Ismail and Noratikah Abu / Journal of Mathematics and Statistics 9 (2): 84-90, 2013
where, P(t)is the probability of purchase at time t, Y(t) is the number of previous buyers, m is the total number of buyers, p and q are the coefficient of innovators and imitators, respectively. Then, after some algebraic process, Bass (1969) shows that the number of purchasing at time t as:
Wenrong et al. (2006) applied Bass diffusion model to forecast the number of mobile service subscribers in Asia pacific. They compare basic Bass model with diffusion by analogy and in estimating the parameters, they used adaptive nonlinear square and genetic algorithm. The results show that basic Bass model performs better than diffusion by analogy. It is a common practice when forecasting using quantitative analogies, experts are asked to identify situations that are analogous to the target situation and for which the data are available. Kim et al. (2009), then applied basic Bass model to forecast the diffusion of new technologies in a market and showed that the model can be used in new technology product forecasting. Radojicic and Markovic (2009) also forecast demand for new technology products on television using the basic Bass model. They found that the model can be used to predict peak sales of new product forecast and able to forecast the timing of peak sales. Since there were not many previous studies of Bass model on the new product vehicle demand forecasting, this study focuses on developing bass model for forecasting new vehicle demand. The objective is to implement the basic Bass model in new product demand forecasting.
S ( t ) = pm + ( q − p ) Y ( t ) −
where, S(t) is the sales at time t and pm is total number of buyers that initiate by innovators, S(0) = pm. The optimal time at peak sales and the size of peak sales are obtained by taking first derivatives of the bass model and from Bass (1969), t* time at peak sales is given by: q ln p T= p+q
Size of peak sales is given by: S* =
m (p + q)
2
(1)
4q
In Bass model diffusion, accurate forecast can be achieved by estimating the parameters and the parameters are p (innovators), q (imitators) and m (potential users). In estimating the parameters, from Bass (1969), an analogue is used Equation 2:
2. MATERIALS AND METHODS Bass (1969) model was developed and widely used for new product forecasting. In this model, there are two potential users seeking information for the products. They are innovators who acquire information from the mass media and other external influences, while the imitative users get information from interpersonal influence such as word-of-mouth communications and observation. The influence of these two types of users was used by Bass (1969). From these two potential users, he came out with a theory of diffusion:
S ( t ) = a + bY ( t − 1) + c ( Y ( t − 1) ) , t = 2,3,... 2
(2)
where, S(t) is sales at time t, Y(t-1) is cumulative sales through period t-1 and a estimates pm, b estimates (q-p) and q
c estimates − . From Mahajan and Muller (1979) m there are two conditions when estimating parameters of new product demand i.e., the availability of historical data and the non availability of historical data. Historical data is defined as “not available” when there are three or less data available. In such case, the method employed is the management judgments and diffusion history of analogous products. Historical data is defined as “available” when there are more than three data available. In this case, many methods can be used such as time-varying estimates, time-invariant estimates (Mahajan and Muller, 1979).
The probability that an initial purchase will be made at time T given that no purchase has yet been made is a linear function of the number of previous buyers’ (Bass, 1969). Mathematically the model can be written as: q P(t) = p + Y(t) m Science Publications
2 q ( Y ( t )) m
86
JMSS
Zuhaimy Ismail and Noratikah Abu / Journal of Mathematics and Statistics 9 (2): 84-90, 2013
2.1. Case Study
be greater than innovation for the sales to achieve the maximum value at cumulative sales. So, we do not choose the parameters for the year 2002 until 2006. Since the value of imitation coefficient in year 2002 until 2011 and 2007 until 2011 are greater that innovation, we choose the 2002-2011 as the best parameters because of the highest adjusted r square value. The r square value indicates that the model describe the growth model well. Figure 2 is the graphical representation of the probability of a customer’s adoption of a new product over time; (a) shows the probability that a customer in the target segment will adopt the product before time t and (b) shows the instantaneous likelihood that a customer will adopt the product at exactly time t. Based on the parameters value, we can calculate peak sales from Equation 1:
The automobile industry plays an important role in all countries around the world. It is an important source of national income, a leading earning foreign exchange through exports and a supporting industry for labor and employment. In facing a strong market competition, many companies tend to decrease their overall cost while maintaining high customers’ satisfactions. Perusahan Otomobil Nasional Berhad (Proton) is one good example of automobile industries in Malaysia. It was incorporated in May 7, 1983 to manufacture, assemble and sell motor vehicles and related products, including accessories, spare parts and other components. Proton produced the first Malaysian car, the Proton Saga, commercially launched on July 9, 1985 and since then, Proton still produce new models like Saga, Waja, Perdana and many more. The latest model produced by PROTON is Inspira which was launched in November 2010. Inspira is classified in a new product category because it was the latest model in the company and new model to the world. In this study, sales data of PROTON cars were obtained from the Malaysian Automotive Association (MAA). Sales demand of Inspira increases from the time it was launched until present. As stated earlier, the purpose of this study is to study and apply the Bass model to new product forecasting. Hence, in our case, Inspira sales data are used in studying the Bass model.
S( t ) =
4q
2
=
(179242 )( 0.0503 + 0.484 ) 4 ( 0.484 )
2
= 26430
and the time of peak sales: q 0.484 ln ln p 0.0503 = 4.24 T= = p + q ( 0.484 + 0.0503)
This shows that the time of peak sales will occur approximately in the 5th year after the product was launched. Results presented in the form of graph as shown in Fig. 3 and 4 demonstrate the findings. Table 2 shows the comparison of actual and forecast data of Inspira from 2011 until 2024. As we can see, the sales will achieve the maximum value in year 2016 and the sales will slowly drop as the market gets saturated. Figure 3 and 4 shows the forecasting results obtained from cumulative sales and current sales of Inspira using Bass model respectively. The results prove that the comparison between the forecast value for 2011 and the actual value for 2011 is quite accurate. From (Bass, 1969), said that the growth of sales will increase to a peak and drops gradually as the market get saturated. Figure 4, indicates, after the new product was launched in 2010, the sales increase every year and reaches its peak sales in the year 2016. After that, the sales will slowly drop which means the new product has reached its saturated state. Figure 3 and 4 depict that our forecast on new products follows the Bass diffusion process as the pattern of the adoption follows the diffusion pattern on Fig. 2.
3. RESULTS As discussed in the method, there are three parameters (p, q and m) that need to be estimated for forecasting purposes. Since Inspira has only one year data, from (Mahajan and Muller, 1979), it can be categorized as a system with no historical data. Hence, we employ the comparative procedure with the similar product or technology in the same organization for estimating the parameters. Hence, we used the historical data of Proton Waja from 2002 until 2011 which is a similar product from Proton and previous model before Inspira. The estimation of Bass model parameters using Regression Analysis by SPSS software gives the following results. From Table 1, we can see that there are different values of parameters for different time series. For successful new product, the coefficient of imitation must Science Publications
m(p + q)
87
JMSS
Zuhaimy Ismail and Noratikah Abu / Journal of Mathematics and Statistics 9 (2): 84-90, 2013
(a)
(b)
Fig. 2. The Bass new product diffusion model
Fig. 3. Forecasting cumulative sales Proton Inspira Science Publications
88
JMSS
Zuhaimy Ismail and Noratikah Abu / Journal of Mathematics and Statistics 9 (2): 84-90, 2013
Fig. 4. Forecasting current sales proton Inspira Table 1. Parameters value Waja m 2002-2011 179242 2002-2006 231538 2007-2011 177740
p 0.0503 0.1589 0.0287
Q 0.4840 0.0903 0.4266
comparison of new adopters between actual and forecast values and to predict the long term pattern of diffusion process. The Bass model is used to estimate three parameters; innovations, imitations and number of adopters and if these parameters are well estimated, an accurate forecast can be achieved. This study studies and applies the Bass diffusion model to forecast new product in vehicle demand in Malaysia. Results obtained, prove that the model can be applied in forecasting Proton Inspira even though no historical data are available. After Inspira was launched, the number of adopters increases every year and slowly decrease after the peak demand in 2016. In this study two main factors were considered namely the innovators and the imitators. Further work can be done to include other factors such as advertising, product knowledge and others. In the area of parameter estimations, new methods may be exploited using modern heuristic methods and show the behavior of the parameters in Bass model.
r-square 0.92 0.67 0.84
Table 2. Sales for parameters
Year 2011 2012 2013 2014 2015 2016 2017 2018 2019 2020 2021 2022 2023 2024
Actual Cumulative sales S (t) sales Y (t) 8074 8074
Forecasted current sales S (t) 9016 12707 17163 21797 25391 26341 23647 18037 11727 6683 3476 1712 819 387
Forecasted cumulative sales Y (t) 9016 21723 38886 60683 86074 112415 136062 154099 165826 172509 175985 177697 178516 178903
5. ACKNOWLEDGMENT This research was supported by the Ministry of Higher Education (MOHE) under GUP Grant Vot No. 02H52 and the Department of Mathematics, Faculty of Science, Universiti Teknologi Malaysia. These supports are gratefully acknowledged. The authors would like to thank lecturers and friends for many helpful ideas and discussion.
4. CONCLUSION Bass diffusion model is a popular diffusion model in new product forecasting. This model has the ability to predict number of adoptions, timing at peak sales, Science Publications
89
JMSS
Zuhaimy Ismail and Noratikah Abu / Journal of Mathematics and Statistics 9 (2): 84-90, 2013
Radojicic, V.D. and G.Z. Markovic, 2009. New technology forecasting using the bass model. Proceedings of the 9th International Conference on Telecommunication in Modern Satellite, Cable and Broadcasting Services, Oct. 7-9, IEEE Xplore Press, Nis, pp: 277-280. DOI: 10.1109/TELSKS.2009.5339534 Rogers, E.M., 1983. Diffusion of Innovations. 3rd Edn., Free Press, New York, ISBN-10: 0029266505, pp: 453. Wenrong, W., M. Xie and K. Tsui, 2006. Forecasting of mobile subscriptions in Asia pacific using bass diffusion model. Proceedings of the IEEE International Conference on Management of Innovation and Technology, Jun. 21-23, IEEE Xplore Press, Singapore, China, pp: 300-303. DOI: 10.1109/ICMIT.2006.262172
6. REFERENCES Bass, F.M., 1969. A new product growth for model consumer durables. J. Manage. Sci., 15: 215-227. Fisher, J.C. and R.H. Pry, 1971. A simple substitution model of technological change. Technol. Forecast. Soc. Change, 3: 75-88. DOI: 10.1016/S00401625(71)80005-7 Fourt, L.A. and J.W. Woodlock, 1960. Early prediction of market success for new grocery products. J. Market., 25: 31-38. DOI: 10.2307/1248608 Kim, D.H., Y.G. Shin, S.S. Park and D.S. Jang, 2009. Forecasting diffusion of technology by using bass model. Proceedings of the International Conference on Computational Methods in Sciences and Engineering, Sept. 25-30, Hersonissos, Crete, pp: 149-152. DOI: 10.1063/1.3225258 Mahajan, V. and E. Muller, 1979. Innovation diffusion and new product growth models in marketing. J. Market., 43: 55-68. DOI: 10.2307/1250271
Science Publications
90
JMSS