[Cohen 1985), [Sandor 1985) are made by a list of all tree nodes arranged ..... The future of 3D medical imag invo proc deve. 6. The. Noa this earl. Spe reg. 7. A.
A Survey of 3D Display Techniques to Render Medical Data Jean-Louis Coatriew:l , Christian Barillot2 INSERM U-335, lLaboratoire Traitement du Signal et de l'Image, Université Rennes I Campus de Beaulieu, 35042 Rennes cedex, France 2Service de Neurochirurgie, Hôpital de Pontchaillou, 35033 Rennes cedex, France
Abstract This paper gives a brief survey of 3D display techniques which were developped during the last fifteen years to render medical data. These methods are classified in two families surface rendering and volume rendering. Emphasis is done on the two most recent methodologies which become widely used to render medical volumetric data sets: Ray-Tracing and Oct ree Encoding. Keywords: 3D Display, Volume Rendering, Ray-Tracing, Octree Encoding 1. Introduction 1.1 Aim of 3D Display in Medicine
Almost all physical processes have now been used to image human anatomy from X-ray computed tomography (CT), angiography, and positron emission tomography (PET) to magnetic resonance imaging (MRI). These medical imaging modalities have introduced significant changes in routine patient care, adding diagnostic evidence and expanding therapeutic efficiency. Nevertheless, the mechanisms of medical image understanding are complex. They rely particularJy upon the knowledge of organ topologies and the relations they share. In other respects, the multiplicity of pathological processes may induce many structural and functional outlines. The morphology, functional data, and the different stigma of a lesional state are as many elements to integrate in the space. The image presentation modes, based on scan sections or radiographie views, do not completely meet the requirements of diagnostic interpretation, therapeutic decision, or surgical operation. They require the physician to do sequential examinations of images and mental 3D reconstruction. ./.
NATO AS! Series, Vol. F 60 30 Imaging in Medicine Edited by K. H. Hôhnc et al. © Springcr-Verlag Berlin Heidelberg 1990
176
During the last fifteen years, these reasons have supported all the attempts developped toward 30 viewing, matching closely advances in medical imaging, computer technology, and computer graphics research. This area conforms with the constant concern for better viewing for better understanding and better understanding for better medicine. From the recent advances on 3D display reviewed in this paper, the challenge of tomorrow is going to be focussed on the use of these methods. An important feature of the medical imaging devices is the heterogeneity which exists between them concerning the nature of the information as well as their managing capabilities (communication and archiving). This separateness restreints the capabilities to numerically and accurately use together these data. Beside Picture Archiving and Communication Systems (PACS), it turns out that 3D imaging must issue solutions to display these data with representation modes and geometrical references independant to the source systems. The second challenge to make use of these methods is to develop effective application layers above them. Dedicated applications have actually more chance to put in practice 30 display methods since they handle better the complementarity existing between the display tools, the interactive tools and the medical practice and knowledge. 1.2 Overview of 3D Display Methods
At the present time, two main different ways to display 30 medical data can be defined. The first one can be called Surface Rendering and the second one Volume rendering. Surface Rendering was the first used method in 30 medical imaging. Within this family two different kinds of representation can be defined : "Polygon Oriented" and "Voxel Oriented". These methods have become widely used from the end of the '70's and into the '80's because it became possible to run them on the more widely available faster mainframe computers. Although, for the last few years, the Volume Rendering methods have become more popular with the design of specialized machines in image processing with faster CPU and larger memory. • Surface Rendering Methods. Within this family, the earliest method was the Polygon Oriented method, it appeared along the arrival of triangulation algorithms using planar contours [Keppel 1975], [Fuchs 1977]. These methods have been mostly applied to 30 representation of anatomical structures from parallel slices [Barillot 1988), example is shown on plate 3.
177
>rted all the attempts in medical imaging, This area conforms understanding and
l in this paper, the .f these methods. An 1eterogeneity which tion as well as their This separateness together these data. PACS), it turns out with representation )urce systems. The , develop effective 1ave actually more y handle better the nteractive tools and
medical data can be and the second one �thod in 3D medical ·resentation can be 1ese methods have the '80's because it le faster mainframe Rendering methods machines in image iest method was the :11 of triangulation 77). These methods cal structures from
A classical approach consists firstly from the binary sequence of the source data to extract a set of contours representing the surface. The tiling of this surface is done by joining the different points belonging to the contours with triangles in order to optimize a criterion (volume, area of triangles, length of segments, ...) within a planar graph. This method gives a surface data base formed by polygons which can be displayed with standard computer graphics display algorithms. Boissonnat [Boissonnat 1988] has recently proposed another method which is based on the Delaunay triangulation. This new approach carries out a solution to the difficult problem of the 3D connectivity of a set of contours [Barillot 1988]. Using a polygonal approach to represent surfaces, some works have also been done to display 3D structures apart from parallel slices original data set such as display of vessel network from angiograms [Barillot 1985a]. Later, some surface rendering techniques with a voxel oriented approach were developped [Herman 1979) [Artzy 1981] [Barillot 1985b] [Heffernan 1985] [Luo 1986]. These new techniques have improved the accuracy and the reliability of the 3D representation. For these methods, either binary volume or grey scale volume can be used. With both volume the data must be interpolated from the original sequence in order to obtain an homogeneous matrix of voxel along the three main axis. Within the volume (binary or not), a surface tracking algorithm is executed to extract the components of the surface (voxels or face of voxels) in order to build up a surface database. The display of this surface is done by rotating the surface elements along the point of view and processing visibility and shadowing by computing the orientation of the surface at each surface element, with a 3D gradient operator [Barillot 1985b] [Hohne 1986]. • Volume Rendering Methods. Volume display techniques have appeared more recently and have the ability to display either surfaces with shading or part of the volume with its grey level values or both together [Meagher 1982] [Schlusselberg 1986] [Hohne 1987] [Trousset 1987] [Herman 1988] [Robb 1989]. The main feature of these techniques is to display data directly from the grey scale volume. The selection of the data which will appear on the screen is done during the projection of the voxels as a function of different attributes such as grey level or gradient values (for surface segmentation), spatial coordinate (for volume cutting), volume set operation (union, intersection, difference of volume) or transparency for instance. The two most
178
representative methods "Ray Tracing" and "Octree Encoding" are further described in this paper. 2. Ray-Tracing for Volume Rendering of Medical Data One of the most efficient ways to implement a volume rendering method is to use a Ray-Tracing algorithm. Unlike Octree Encoding, no preprocess needs to be done in order to set up a hierarchical structure on it. Based on the methods developped in the early 80's [Roth 1982] [Kajiya 1983], ray-tracing applied to medical data involved several processes. First of all, the geometrical transformations align the data along the viewing direction. Then two more processes select the voxels to be displayed, i) the spatial segmentation process which performed a 3D clipping according to the actual volume of interest and ii) the active segmentation which consists to display surfaces from the raw volume according to a particular function which can be simply related to the voxel grey values met by a ray throughout this volume. 2.1 Geometrical Aspects
The position observation vector infinite, the view i viewing direction. ' solid angle (1t) repr This general r also for polygon 01 define the geometr: the source point of as a straight line cc To compute the pie measured by the re display, the ray's ir lighting model (in surfaces orientation As we can see camera has the sen (positive depth), th, space. This systerr. space. It may be c< axis and increment • Ray definition. screen is:
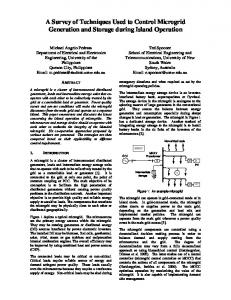
Figure 1:Camera model for ray-tracing with perspective view • Camera Model The most common camera model deals with a source point (called "Eye"), a focal point (where the eye is looking) and a matrix of pixels (the screen). The object to display (called scene) is in front of the camera within a truncated volume called the viewing pyramid (Figure 1). Therefore, from these parameters, a viewing direction is defined by the vector coming from the eye and going to the focus point (Vvw)·
So, for each re on the screen and t pixel and the eye p, view is often chose: P(xo, Yo,
• Geometrical Tra. systems are used ; coordinate system c With regards efficient to transf
179
coding" are further Data
tdering method is to preprocess needs to
Roth 1982] [Kajiya .1 processes. First of e viewing direction. ayed, i) the spatial ording to the actual consists to display 1ction which can be hout this volume. Yscreen
The position of the screen in front of the camera is defined by the observation vector (Vvw) and the focal length DJ, When the focal length is infinite, the view is considered parallel because all rays are parallel to the viewing direction. The screen features (size, orientation, focal length) define a solid angle (1t) representing the viewing pyramid. This general model is applicable not only for a ray-tracing display but also for polygon oriented display. A requirement of a ray-tracing model is to define the geometry of the rays cast through the scene. Therefore, to connect the source point of the scene, for each pixel of the screen, a ray (p) is defined as a straight line coming from the source point and passing through the pixel. To compute the picture, the pixel value is assigned according to an intensity measured by the ray throughout the scene. For instance, for shaded surface display, the ray's intensities are measured and stored according to the current lighting model (intensity and light source orientation, reflections, textures, surfaces orientations, ... ) where the rays intersects the scene. As we can see on Figure 1, the most common coordinate system for the camera has the screen in the (x-y) plane, the unclipped scene in the +z space (positive depth), the clipped scene and the source point (i.e. the eye) in the -z space. This system is commonly called screen coordinate system or screen space. It may be convenient to have the viewing vector congruent with the z axis and increment of depth along the positive part of the z axis. • Ray definition. screen is:
!Ctive view with a source point l a matrix of pixels ront of the camera sure 1). Therefore, the vector coming
A basic parametric equation of a ray (p) coming from the x,=xo+Dx·' = { p(t) Yt : Yo + Dy . t } z 1 -z 0 +Dz .t
(1)
So, for each ray, the value (x0, y0, z0) is given by the position of the pixel on the screen and the direction vector (D x, Dy , D z) by the vector between the pixel and the eye position. In order to speed up the display process the parallel view is often chosen, hence a ray passing through the pixel p(x0,y0) becomes: P(xo, Yo,
q = rx,y,z,l = rxoYo O l
+ [001 ). t = rxoYo t l
(2)
• Geometrical Transformations. Usually, two kinds of cartesian coordinate systems are used ; the scene coordinate system or scene space and the screen coordinate system or screen space (Figure 2). With regards to the amount of information to be treated, it is more efficient to transform the screen's position (hence the ray's equations)
180
according to the scene coordinate system (where the volume is defined), thus a "screen to scene" transformation is used. (Ray)
P{xo, Yo, tj =
where (M = ti - ti-1 Look-up tables 2.2 Spatial Segment
Figure 2: Coordinate systems used for the geometrical transformations Therefore, after transformation, the equation of a ray becomes: P(x o, Yo, t) = [ x;Y; z;] = [x oY o t ] • [R] + T (3) where '1 1'12r13 R =R = ) ['21r22r23] ( r31r32r33 is the rotation matrix according to figure 2. T = [ Tx Ty Tz] is the translation vector according to figure 2.
%· �
In order to simplify this equation, a point on the ray can be evaluated as a function of the point before it, on this ray ; the chain coding of the ray can then be expressed at the instant ti as : ' x '· 1)•r31 I; x t i-1 =(t·-t I· I Y'I j - y'I i·l
= (t.I - t.I· i) •r32
z'-z' =(tI··tI·· 1)•r33 Ii I j.J
(4)
So, now we can have the general equation of the ray at the instant ti within the scene coordinate system :
This stage consists have to be compute a ·bounding box wl selects the set of pi usually set to the du Another way structure to bound method is its abilit during the ray cast the screen in orde pixels about which Another advantage the volumetric data a pixel related to t value of the first vc This feature fi. of the da� set. Th: volume since a fe, describe one volurr alone or together a1 2.3 Active Segment.
This stage consists To perform this, c function is often re the volume, it cou: volume by a pre-se One of the m display a new obje,
1e is defined), thus a P{x o, Y o,
q=
{
181
P{xo,Yo,to) = [xoyozo] = [xoYoO]•[R] +
T)
P{xo, Yo, ti) = P(xo, Y o, t;.1) + [r31r32r33] • Lit
(s)
where (M = ti - ti-1 ) is the ray sample. Look-up tables can be used to implement these equations [Robb 1988). 2.2 Spatial Segmentation ,en
This stage consists to define the volume of interest (VO!) wherein the rays have to be computed. A very common way to perform this process is to define a bounding box which surrounds the VO! and by projection on the screen selects the set of pixels about which rays will be cast. The size of this box is usually set to the dimensions of the volumetric data set. Another way to define the volume of interest is to set up a polygonal structure to bound this volume [Robb 1988). A particular advantage of this method is its ability to define a more complicated shape of the VOL Hence, during the ray casting process, this polygonal structure is projected first on the screen in order to set up the 3D clipping region selecting the screen's pixels about which rays are cast and to measure the actual length of each ray. Another advantage of this approach is its ability to define cutting planes within the volumetric data set. Indeed, when a polygon or part of it clips the volume, a pixel related to this image region can easily be assigned by the grey level value of the first voxel met by a ray. This feature figures out a convenient tool to perform a "digital dissection" of the da� set. This yields to the definition of multiple VOI's from the same volume since a few amount of information (i.e. the polygonal structure) can describe one volume of interest. Hence, these different VOI's can be displayed alone or together according to their own display parameters.
. transformations becomes: (3)
cording to figure 2. gure 2. can be evaluated as ,ding of the ray can
2
2.3 Active Segmentation and Rendering.
(4)
3
ay at the instant ti
I
This stage consists to display particular surfaces from the volume of interest. To perform this, one function is assigned to each pixel of the screen, this function is often related to the voxel grey level values met by a ray throughout the volume, it could also be related to particular label values assigned to the volume by a pre-segmentation process. One of the most spectacular properties of this process is its ability to display a new object (i.e. a new surface) as easily and rapidly as to change the
182
viewpoint. Several approches can be used, they can be classified as reflection oriented display methods (like a photograph) or transmission oriented display methods (like a radiograph). • Reflection oriented display. These methods differed from each others by their actual segmentation process (binary or fuzzy) and their rendering (depth, deph gradient or gradient shading). The most common segmentation process is binary and consists to classify the object of interest by using a binary function of the voxel grey level values (e.g. a plain threshold) which selects the in- and the out-object. Thus when a ray goes throughout the volume, the active segmentation function returns a true value when this ray meets the first voxel with a grey level value above the threshold. Three main qualities of rendering can then be applied : • Depth shading : A pixel value is only related to the depth of the first voxel along the ray belonging to the VOI according to the current threshold. • Depth gradient shading : This rendering is just an enhancement of the previous method. A pseudo gradient is computed upon the screen's depth values to estimate the surface orientation which is used by the well-known lighting models (e.g. Gouraud or Phong's models). This appproach was first introduced by Frieder [Frieder 1985]. • Gradient shading : This rendering technique consists to estimate the surface orientation on each voxel detected on the surface by computing the gradient vector related to these voxel neighborhoods [Barillot 1985b] [Luo 1988]. From this normal vector estimation the same well-known lighting models can be used. • Fuzzy Segmentation : One of the major problems to display a surface from a 3D volume is to decide whether or not a given point (e.g. voxel) belongs to this surface. This binary decision often introduces artifacts, a common error is for instance the presence of holes within the display of a bony surface when the structure is rather composed by a low density bony structure (cartilage or thin bone surrounded by air for instance). Get rid off this unsteady decision means improve the segmentation process. A solution would use an image processing approach to enhance these weak structures in order to improve the binary decision segmentation. Nevertheless, that kind of technique is probably more useful for a surface rendering method upon which you know exactly the structure according to the user choice without pre-processing or pre-segmentation.
A new appro.= [Drebin 1988] [Le, cannot be simplifiec called fuzzy functio present, for another the surfac� is fully compositing and is render a semi-trans1 • Classificatio: classified the voxe fuzzy range. This c: to this fuzzy range) none-structure. As� the true-structure ( belongs to the none range will be class repartition between' the voxel v accordi1
where d1 and do are: P(vE S) is the
This classific Assuming that two value) should not · close to the border information (e.g. l av v can be compu gradient intensity 1
be used as the class
183
assified as reflection ;ion oriented display from each others by eir rendering (depth, :mentation process is .ng a binary function :h selects the in- and volume, the active meets the first voxel tualities of rendering he depth of the first current threshold. enhancement of the 1 the screen's depth by the well-known appproach was first �ists to estimate the :e by computing the ;arillot 1985b] [Luo vell-known lighting to display a surface 1 point ( e.g. voxel) roduces artifacts, a 1ii1. the display of a a low density bony ance). e the segmentation 1ch to enhance these sion segmentation. 1seful for a surf ace ure according to the
A new approach specifically applied to a volume rendering method [Drebin 1988) [Levoy 1988) consists to assume that the surface to display cannot be simplified as a binary density function. An alternative is to use a so called fuzzy function where for a range of grey level values the surface is not present, for another range the surface is partially present and for a third range the surfact is fully present. This merging of information is called volumetric compositing and is an approximation of the visibility calculations required to render a semi-transparent gel [Blinn 1982) [Duff 1985) (see plates la,b). • Classification : The implementation of this method consists firstly to classified the voxels according to a range of voxel grey level values called fuzzy range. This classification assigns to a fuzzy voxel (i.e. a voxel belonging to this fuzzy range) a parameter a function of its amount of true-structure and none-structure. Assuming that at the top of the fuzzy range, a voxel belongs to the true-structure (classification 1) and at the bottom of the same range, it belongs to the none-structure (classification 0) ; a voxel belonging to the fuzzy range will be classified according to its rank within these values (e.g. linear repartition between classification O and classification 1). The classification a of the voxel v according to its value(e.g. density) d can be expressed as: O i f P( v e S) = 0 (6)
where dJ and do are resp. the top and the bottom values of the fuzzy range. P(vES) is the probability for the voxel v to belong to the structure S. This classification can be improved by adding surface information. Assuming that two voxels with the same structure information (e.g. grey level value) should not have the same influence for the display whether there are close to the border or not, the classification can then be weighted by a surface information (e.g. gradient intensity). The gradient classification coefficient av v can be computed by replacing in (6) the grey level information d by the gradient intensity V. The combination of both coefficients (av = avd.av v) can be used as the classification value assigned to the voxel v.
184
• Rendering : The merging of the voxel luminescences and opacities is performed using a transparency model. For two surfaces (one semi transparent and one opaque) the resulting luminescence can be expresssed as : 1tot = 1rs •a + (I -a)•/opq p where /ts p and Iopq are the luminescences of both surfaces and a the opacity coefficient of the transparent surface. Assuming that a classification coefficient behaves like an opacity value, the volumetric compositing is just an extension of this transparency model. This compositing can be done from back to front as well as from front to back. Therefore for a pixel on (xo,yo) the resulting compositing C is: qx,.yd =
t
[1,,
a,( §(1-aJ)]
structure with on: on special purpos, 3.1 Basics
The basic concer through a treelil< obtained by a n decomposed into < z
c1i
where v z are the voxels involved in the compositing along the ray p(xo,yo), az their classification (i.e. opacity) values and /z their luminescences. This expresssion can be simplified by looking at the luminescence compositirg C before and after a particular voxel vz : C Z= c z +l • (1-az) + Iz . az • Transmission oriented display. These methods do not involved any surface indentification process. The rays go totally throughout the VOI and the pixel values are computed by using integration functions. Two different display methods are usually proposed: the brightest pixel display where the pixel value is the brightest grey level value along the ray (method often used to display MRA data sets) and the weighted summation display where the pixel value is an average of the voxel grey level values along the ray. 3. Octree Representation Many algorithms for octrees have been proposed. They are issued from and applied to a large number of engineering fields. Their interest comes from the ability of hierarchical structure to represent and manipulate uniform data regions as single entities. Easy and fast access to the data is so-provided together with a significant reduction of memory space [Reddy 1978] [Hunter 1978] [Jackins 1980] [Maegher 1980]. Volumetric operations as required in medical imaging are quite simple to design and the full use of recursive
Figure 3:Labels a until some a prior is reached. The o labels from O to 7 resulting octal tree respectively heterc value. A binary ol by Empty (outside further reduced). of the data within criterion can mak< polygons, it will b the region [Ayala l The informati depends on the ap:
185
cences and opacities is surfaces (one semi can be expresssed as :
oth surfaces and a the
s like an opacity value, tis transparency model. well as from front to 1positing C is:
structure with only arithmetic computations leads to efficient implementation on special purpose hardware. 3.1 Basics
The basic concept consists to model a cubical volume of 2°x2nx2n voxels through a treelike structure. The octree representation of a data base is obtained by a recursive subdivision process where the entire volume is decomposed into octants, these octants being divided themselves into suboctants z
(7)
Jositing along the ray Iz their luminescences.
� at the luminescence
)t involved any surface the VOI and the pixel Two different display y where the pixel value l often used to display ,here the pixel value is
y are issued from and 1terest comes from the 1ipulate uniform data e data is so-provided [Reddy 1978] [Hunter :rations as required in full use of recursive
Figure 3:Labels and binary object until some a priori defined properties are verified or until the resolution limit is reached. The octants, represented by nodes within the tree, are assigned labels from O to 7 (Figure 3). The root node depicts the full space array. The resulting octal tree is specified by intermediate nodes and leaf nodes containing respectively heterogeneous and homogeneous cubes according to the property value. A binary object is shown in Figure 3 where the node types are defined by Empty (outside the object), Full (inside the object) and Partial (node to be further reduced). The decomposition process is determined by the properties of the data within a cube. For multilevel database, such as CT Scanner, the criterion can make use of density values. In surface representation based on polygons, it will be related to the presence of planes, edges or vertices within the region [Ayala 1985]. The information to be stored in the nodes has also to be defined. It fully depends on the application purposes : density values, surface normal vectors,
186
links to the neighbours etc. This choice requires to find a good trade off between the amount of data stored (to avoid multiple processes on the same data) and the octree size. If we decide to store as less inf ormation as possible, the tree size will be minimum but more processing will be required (computation of gradients and neighbourhood search...) and computation times will increase. Otherwise, huge octree size leads to the non-optimal utilization of the computer memory resources (paging faults...).
P : Partial node (intermediate) E : Empty node (terminal) F : Full node (terminal)
Figure 4:0ctree encoding 3.2 Encoding and Conversion
Once the tree and the data associated to the nodes have been defined, a computer representation must be chosen : two main approaches exist using a tree or a list representation. A pointer-based approach is the most natural ; it is based on a recursive definition of the tree. Each node is composed by a p fields structure, eight of them contain pointers to the child-structures. The other fields are used to encode inf ormation concerning the father and the properties associated to the node. Two methods improving the encoding have been proposed : the first one consists to reduce the number of node-structures by coding several nodes within the same data structure (8 nodes [Jannin 1987), 64 nodes [Meagher 1987]. It is then possible to not represent Empty nodes (data outside of the chosen density window). The tree size becomes smaller but the node sizes become variable according to the amount of Empty children in a node. The other way is based on reducing the pointer size by using a specific memory allocation (relative addressing). Regardless of these improvements, pointers are very memory consuming, that explain why solutions without pointers have been carried out. Coded trees
[Cohen 1985], [Sa according to a giv take only into accc "location key" allo, methods induces s necessary informal through me previ01 allows tracking obj, eight octants has be [Jannin 1988]. Bee considered so imf decided to store dei also been associate realistic and accun gradient vectors are the gradient itself) process for each nc also carried out, hierarchical prope (random) .access to hardware (parallel called "One point1 children with these The proposed contains informati< object, type of nod nodes, if they are I part of it can be stc properties. A node may h:
-"Partial" : i partially) to tl field of the pa -"Empty" : 1 according to s is stored in the
\ 187
ind a good trade off rocesses on the same :ormation as possible, 1g will be required nd computation times on-optimal utilization
ntermediate) erminal) ninal)
ave been defined, a roaches exist using a he most natural ; it is is composed by a p :hild-structures. The g the father and the 1g the encoding have er of node-structures nodes [Jannin 1987), >resent Empty nodes becomes smaller but f Empty children in a e by using a specific memory consuming, ried out. Coded trees
[Cohen 1985), [Sandor 1985) are made by a list of all tree nodes arranged according to a given tree traversal mode. Linear octrees [Gargantini 1982) take only into account Full nodes. Each node is represented by a code called "location key" allowing its localization within the tree. This second category of methods induces significant reduction of the tree size by keeping only the necessary information but an access to a given node requires travelling all through tbe previous nodes in the list. Furthermore, this representation barely allows tracking objects throughout the tree. A classical decomposition mode in eight octants has been chosen due to algorithmic and implementation sin1plicity [Jannin 1988). Because the ability to display the "inside" of an object was considered so important with regards to the application purposes, it was decided to store density values in terminal nodes. Surface normal vectors have also been associated to these nodes because they are necessary to provide a realistic and accurate rendering of surfaces. Furthermore the computation of gradient vectors are very tin1e consuming (search of neighbours, calculation of the gradient itself) so it is performed only once during the octree construction process for each node belonging to the object surface. A pointer strategy was also carried out, allowing an optimal use of the octree recursive and hierarchical properties : easy travelling through the nodes, fast and easy (random) �ccess to the nodes, well-suited to an implementation on a dedicated hardware (parallel and multiprocessor architecture). The chosen structure called "One pointer by intermediate node" stores information on terminal children with these nodes. Therefore, the bottom level of the tree is destroyed. The proposed node structure is composed of nine fields ; a one byte field contains information characterizing the node itself (belonging to the surface object, type of node...), and eight fields containing pointers to the eight child nodes, if they are partial. Either all information concerning the child nodes or part of it can be stored at the location of a child pointer, according to the child properties. A node may have one of the following types : -"Partial" : it defines a non homogeneous octant belonging (at least partially) to the object. A pointer to its node structure is stored in the ith field of the parent node (for a child node "i"). -"ErrJ,pty" : the node represents a cube which is outside the object according to some segmentation criteria. A null value (filling characters) is stored in the ith field of the parent node.
188
- "Full" : these node types definie the voxels belonging to the surface, internal visible or non visible voxels, internal visible or non visible cubes. According to these types, the information attached to the nodes are density values and/or components of the surface normal vectors. Other improvements have been achieved : the normal vector encoded on two bytes allows the storage of the density on every nodes. For each node, maximum and minimum values of the current region can be stored, hence speeding l:lP the octree segmentation process [Amans 1986] [Antoine 1988]. The rules for building octrees depend on the formats of their input data such as object models (coming from constructive solid geometry or boundary representation) or silhouette images (reconstruction of an object from its projections) and so on [Chen 1988]. We are dealing in medical imaging with parallel serial sections.Construction algorithms have to be suited to the limited computer memory space : a slice by slice approach allows a progressive construction of the octree. A quadtree construction of each plane section and a progressive insertion of them within the octree can be used [Yau 1983]. Our octree conversion algorithm provides a direct construction : sets of four consecutive slices by using arrays where structure's addresses, which represent the nodes, are buffered until the eight brothers at a given level have been obtained. Among these four sections, the middle ones contain the voxels to be actually encoded and the lateral ones are just used to compute the local gradient involved by the segmentation process and the surface normal vector computation [Luo 1988]. Because an octree represents a cubic volume (2n*2n*2.n) and the number of slices is generally lower than the number of pixels within a plane section, an automatic filling procedure has to be carried out to generate the Empty nodes corresponding to the missing slices. 3.3 Display and Manipulation
The overall implemented scheme of the octree-based encoding makes use of a linear description to reduce the storage requirements. Conversely a pointer based representation is handled when rendering and analysis are performed. The display operations involve geometrical transformations to place the observer with regard to the object , hidden surface removal and surface shading computation. One solution consists to translate and rotate the octree in order to make the viewing direction Uoining the observer's point of view and
the point aimed in planes. The octree those which will nc viewer around the s front Full octants sequence to visit tl front to b11,ck seque1 has been painted, a The image plane c obtained by exami quadrants in the in defines the smalles1 the projection of a: half the sizes of coordinates (dx, b space. This overlay cover up the proj� then read. If the 1 stops. If none or pa by looking for the 16 nodes of the I computation of the The whole algoritll the octree.
189
1ging to the surface, , or non visible cubes. .ed to the nodes are nal vectors.
tal vector encoded on odes. For each node, can be stored, hence ] [Antoine 1988]. tts of their input data ;eometry or boundary f an object from its nedical imaging with ! suited to the limited allows a progressive :h plane section and a tsed [Yau 1983]. Our 1ction : sets of four :sses, which represent tven level have been ntain the voxels to be o compute the local iurface normal vector nts a cubic volume r than the number of lure has to be carried sing slices.
oding makes use of a ::::onversely a pointer 1lysis are performed. rntions to place the ·emoval and surface 1d rotate the octree in r's point of view and
the point aimed in the scene) perpendicular to one of the new octree generic planes. The octree must be recomputed, i.e. the positions of all nodes even those which will not be visible [Meagher 1982]. Another way is to move the viewer around the scene and to project the object onto the screen. Finding the front Full octants that are visible can be carried out through a specific sequence to visit the octree nodes. It is well known that on the average, the front to b"-ck sequence is more efficient because once a part of the image plane has been painted, any other nodes (subtrees) projected onto it can be ignored. The image plane can be represented by a quadtree so that the projection is obtained by examining the relative positions of a projected octant and the quadrants in the image plane [Meagher 1987]. The bounding box (Figure 5) defines the smallest rectangle parallel to the axes of the screen which encloses the projection of an octant. The length of the sides of the bounding box are half the sizes of the bounding box of its parent node. The geometrical coordinates (dx, Ix, dy, ly) of the bounding box are defined in an overlay space. This overlay is formed by four adjacent quadrants (fi) of equal size that cover up the projection of the considered octant. The state of the overlay is then read. If the four quadrants have been already painted, the procedure stops. If none or partial painting has been performed, the subdivision continues by looking for the child-overlay composed of four nodes selected between the 16 nodes of the parent overlay. These nodes are determined through the computation of the location of the left-higher comer of a child bounding box. The whole algorithm includes the special processing of the terminal nodes of the octree..
Bounding box
Figure S:Overlay technique.
190
Efficient capabilities to extract and analyze the information of clinical relevance can be easily implemented. Set operations (union, intersection, difference) between two objects are performed by a parallel tree traversal on both octrees by making simultaneous comparisons between nodes. Cutting plane requires the comparison of all vertices of the cubes corresponding to the octree nodes with the cutting plane. The nodes cut by the plane are decomposed and the process follows to their children. If a terminal Full node is cut by the plane, its virtual coordinates are used to continue the process. All these operations are executed node by node (region by region) and not voxel by voxel. The octree construction induces the loss of the neighbourhood notion in this representation. To find it again and to develop operations using the examination of the neighbourhood (segmentation, search for connected components...), some simple algorithms researching the neighbourhood of a node within the tree along a direction have been developped. They are based on the research of the first common ancestor of both node.s and a going down on the tree with the way obtained by the mirror of the way used to climb up the tree. Volume measurements can also be obtained by computing the number of nodes or the size of the represented cube, surface ones by the number of sides of cubes and their size. The density, mean value and centre of gravity measurements can be computed by using the density stored in the tree. 4. Discussion Most research efforts have been directed in the last two decades towards designing efficient methodologies for 3D display. Rather than attempting to survey all the techniques, we have focussed our own works on volume rendering. However, some pointers to the recent litterature have been provided which emphasize the variety of approaches [Fuchs 1989) [Chen 1989] [Pizer 1989] [Coatrieux 1989). This juxtaposition clearly evidences that there is not a.n unique way to deal with 3D medical imaging. Even if volume rendering can be considered as a more general display modality than surface rendering, the main issue is to define the most appropriate method according to the data acquisition modes and the medical relevance. For example, surface representation may remain of interest for shape conformation required in atlas matching. The fewer number of manipulated elements, the capability to introduce mechanical and mathematical properties during modelling yield
Pia
Plate Plates la,b: Volun Emphasis of t structure (bina The data base
Plate 2: Volume R Data base acq,
Plate 3: Surface re 3D modeling by a stereotac triangulation a
1formation of clinical (union, intersection, �allel tree traversal on m nodes. ertices of the cubes . The nodes cut by the �hildren. If a terminal ! used to continue the (region by region) and ces the loss of the again and to develop (segmentation, search 1ms researching the direction have been : common ancestor of >btained by the mirror 1rements can also be ze of the represented heir size. The density, omputed by using the
Plate la
Plate 2 two decades towards er than attempting to ·n works on volume itterature have been hs 1989] [Chen 1989] evidences that there is n if volume rendering ,an surface rendering, according to the data r example, surface ltion required in atlas ts, the capability to ring modelling yield
Plate lb
Plate 3
Plates la,b: Volume Rendering of a dog chest with a Ray-Tracing algorithm. Emphasis of the volumetric compositing approach to display the same structure (binary segmentation on (a) and fuzzy segmentation on (b)). The data base was provided by the BRU dept of Mayo Clinic. Plate 2: Volume Rendering of a human head with an Octree algoritlun. Data base acquired from CT with a 512x512x200 resolution. Plate 3: Surface rendering of a brain model by using polygons. 3D modeling of intra-cerebral structures from planar contours provided by a stereotactic atlas, the 3D data base was reconstructed by using a triangulation algoritlun '[Barillot 1988].
192
attractive solutions for fitting procedures and faster production of target objects [S�queira 1987]. Even if a manual segmentation has to be achieved (it is also a recurrent problem in volume rendering), the full interactivity that can be expected by using the current technology is an important advantage. So, open problems in sutface rendering must be addressed among which the ability to define the optimal distribution of points on surfaces and the correct reconstruction of complex objects from restructured point sets (see [Boissonnat 1988] for more details). Volume rendering techniques must also be improved to enhance the effectiveness of the display by a proper selection of fuzzy classification values (or appropriate choice of "colors" and "opacities" in [Levoy 1988] [Drebin 1988]. Most often, software packages have been proposed which severely increase the time lag required to produce an image and to modify the objects. Parallel processing hardware [Goldwasser 1987] [Kaufman1988] and VLSI design [O'Donnell 1988] have been considered . The octree encoding is particularJy suited for parallel computing. Two different architectures have been recently reported [Toumoulin 1989] and a hypercube array based on transputers [Jannin 1990]. Another field of research can be explored through the merging of techniques. It covers more or less complex situations. Octree encoding can be used for example to determine a precise bounding box of the 3D object and so providing faster travelling along the ray path. Combined displays of geometric objects with slices derived data bases as well as superimposition of computed data with morphological ones are required in a number of applications such as surgery simulations or radiotherapy planning. These comments point out the dual efforts to be carried out in 3D medical imaging. On one side, new methodological areas have to be addressed through the optimization of the most computer intensive steps while enhancing the efficiency of rendering. In addition, the clinical assessment of 3D representation will be widely accepted through the avaibility of user friendly applications. 5. Conclusion This short survey on 30 visualization techniques reveals that quite encouraging results have been provided in the last two decades. Emphasis has been given to volume rendering techniques, i.e. ray tracing and octree encoding, however surface representations are also of relevance. The future of 3D medical
imaging depends 01 involved in the path processing ressourc1 development of pre6. Acknowledgem The authors are ind Noach Richard and this research activi early vision of the 1 Special recognitior regarding to the de, 7. Refer�nces Amans J.L., Antoine fl numerical data usinJ (April 1986) Antoine M. : Les tecf volumes tridimensi< (1988) Artzy E., Frieder G., H Three-Dimensional pp.1-24, (1981) Ayala D., Brunet P., J division quadtrees a Barillot C., Gibaud B., Cerebral Blood Ve! (1985 a) Barillot C., Gibaud B., from CT Examinat (1985 b) Barillot C., Gibaud B Reviews in Biom. l Blinn J.F. : Light Refle Graphics, Vol.16(3 Boissonnat, J.D. : Sh: Image Proc. 44, 1-� Chen, H.H., Huang. 1 Vis Graph Image P Chen, L.S., Sontag, M their medical appli< Coatrieux, J.L., Jannir imagerie medicale Nimes, 19-21, (ma: Cohen, Y., Landy, M Anal Mach Intel, 7 Drebin R.A., Ca:rpen 22(4), pp.65-74,.(:
193
production of target ts to be achieved (it is interactivity that can )rtant advantage. So, .ong which the ability ces and the correct sets (see [Boissonnat )ved to enhance the ' classification values 4evoy 1988) [Drebin ::>sed which severely J modify the objects. man1988] and VLSI octree encoding is 1t architectures have �ube array based on 1gh the merging of tree encoding can be the 3D object and so Hsplays of geometric Josition of computed · applications such as ed out in 3D medical :>e addressed through .vhile enhancing the assessment of 3D ility of user friendly
1at quite encouraging sis has been given to encoding, however .ure of 3D medical
imaging depends on our ability to handle and to improve the overall stages involved in the patient management. They include the image acquisition, the processing ressources, the combination of data and methods as well as the development of pre- and post-operative planning tools. 6. Acknowledgements The authors are indebted to Luo Li Min, Jannin Pierre, Gibaud Bernard, Le Noach Richard and Toumoulin Christine for their valuable contributions to this research activity. They are grateful to Professor Scarabin J.M. for his early vision of the medical interest of three dimensional imaging techniques. Special recognition is also given to Dr. Richard A. Robb for its support regarding to the development of the ray-tracing algorithm. 7. Refer�nces Amans J.L., Antoine M., Darier P.: Processing and display of three dimensional arrays of numerical data using octree encoding. Proc. 2nd Intern. Image Syrop, Nice, pp. 823-830, (April 1986) Antoine M. : Les techniques algorithmiques du codage octree appliquees a l'analyse des volumes tridimensionnels de donnees numeriques. PHD Thesis, Universite de Grenoble, (1988) Artzy E., Frieder G., Herman G.T. : The Theory, Design, Implementation and Evaluation of a Three-Dimensional Surface Detection Algorithm. Comp. Graph. & Im. Proc., Vol.15, pp.1-24, (1981) Ayala D., Brunet P., Juan R., Navazo I. : Object representation by means of nonminimal division quadtrees and octrees. A.C.M. Trans on Graphics, 4, 1, pp. 41-59, (1985) Barillot C., Gibaud B., Scarabin J.M., Coatrieux J.L.: Three-Dimensional Reconstruction of Cerebral Blood Vessels. IEEE Computer Graphics & Applications, Vol.5(12), pp.13-19, (1985 a) Barillot C., Gibaud B., Luo L.M., Scarabin J.M. : 3-D Representation of Anatomic Structures from CT Examinations. Proc. SPIE Biostereometrics'85, Vol.302, pp.307-314, Cannes (1985 b) Barillot C., Gibaud B. et al. : Computer Graphics in Medicine: A Survey. CRC Critical Reviews in Biom. Eng., Vol.15(4), pp.269-307, (1988) Blinn J.F. : Light Reflection Function for Simulation of Clouds and Dusty Surfaces. Computer Graphics, Vol.16(3), pp.21-29, (1982) Boissonnat, J.D. : Shape reconstruction from planar cross-sections. Computer Graphics & Image Proc. 44, 1-29, (1988) Chen, H.H., Huang. T.S. : A survey of construction and manipulation of octrees. Comput. Vis Graph Image Proc, 43, 409-431, (1988) Chen, L.S., Sontag, M.A. : Representation, display and manipulation of 3D digital scenes and their medical applications, Comput Vis Graph Image Proc, 48, 190-216, (1989) Coatrieux, J.L., Jannin, P., Toumoulin, C., Lenoach, R. : Representation tridimensionnelle en imagerie medicale : bases theoriques, Journees Francophones d'Informatique Medicale, Nimes, 19-21, (mars 1990), to appear. Cohen, Y., Landy, M.S., Pavel, M. : Hierarchical coding of binary images. IEEE Trans Pat Anal Mach Intel, 7, 3, 284-298, (1985) Drebin R.A., Carpenter L., Hanrahan P. : Volume Rendering. Computer Graphics, Vol. 22(4), pp.65-74,.(1988)
194
Duff T. : Compositing 3-D, Rendered Images. Computer Graphics, Vol.19(3), 41-44, (1985) Frieder G., Gordon D., Reynolds R. : Back-To-Front Display of Voxel-based Objects. IEEE Comp. Graph. & Appl., Vol.18(3), pp.52-60, (1985) Fuchs H., Kedem Z.M., Uselton S.P. : Optimal Surface Reconstruction from Planar Contours. Comm of the ACM, Vol.20, pp.693-702, (1977) Fuchs, H., Levoy, M., Pizer, S.M. : Interactive visualization of 3D medical data. Computer 46-51 (1989) Gargantini, I.: Linear octrees for fast processing of three dimensional objects, Comput Graph Image Proc, 20, 356-374, (1982) Goldwasser, S.M., Reynolds, R.A. : Real-time display and manipulation of 3D medical objects: the voxel processor architecture, Comput Vis Graph Image Proc, 39, 1-27, (1987) Heffernan P.B.., Robb R.A. : A New Method for Shaded Surface Display of Biological and Medical µnages. IEEE Transactions on Medical Imaging, Vol.MI-4, pp.26-38,(1985) Herman G.'f., Liu H.K. 3-D Display of Human Organs from Computed Tomograms. Comp. Graph. & Im. Proc., Vol.9(1), (1979) Herman G.T. : Three-dimensional imaging on a CT or MR scanner. J. Computer Assist. Tomogr. 12, 450-458 (1988) Bohne K.H., Bernstein R.: Shading 3D Images from CT Using Grey-Level Gradients. IEEE Trans. OJ} Medical Imaging, Vol.5(1), pp.45-47,(1986) Bohne K.H., Riemer M., Tiede U. : Viewing Operation for 3-D Tomographic Grey Level Data. Proc. CAR'87, pp.599-609, Springer-Verlag Ed., (1987) Hunter, G.M.: Efficient computation and data structures for graphics, PHD Thesis, Dept Elect Comput Science, Princeton University, Princeton, NJ, (1978) Jackins, C., Tanimoto, S.L.: Oct-trees and their use in presenting three dimensional objects, Comput Graph Image Proc, 14, 249-270, (1980) Jannin, P., Gibaud, B., Barillot, C., Scarabin, J.M., Bouliou, A. : Octree encoding with volume and surface information in medical imaging. In: Proc. 9th IEEE EMBS Conference, Boston 1987 Jannin, P.: Modelisation, visualisation et manipulation de donnees volumiques par arbre octal en imagerie medicale, PHD Thesis, Universite de Rennes I, juillet 1988 Jannin, P., Prevost, G., Le Noach, R., Coatrieux, J.L. : Conception d'architectures specialisees pour des stations de travail interactives a base d'octree en imagerie medicale, Actes Forum des Jeunes Chercheurs, Paris, (mai 1990) Kajiya J.T. f Ray Tracing. Tutorial Notes, ACM SIGGRAPH'83, (1983) Kaufman, A., Bakalash, R.: Memory and processing architecture for 3D voxel based imagery, IEEE Coµiputer Graphics, 10-23, (1988) Kehtamavaz, N., Simar, L.R.,De Figuereido, R.J.: A syntactic/semantic technique for surface reconstruction from cross sectional contours. Comp. Graph. & Im. 42, 399-409 (1988) Keppel E. : Approximating Complex Surfaces by Triangulation of Contours Lines. IBM J. Res. Develop. 19, pp.2-11, (1975) Levoy M. : Display of Surfaces From Volume Data. IEEE Comp. Graph. & Appl., pp.2937,(1988) Luo, L.M. : Reconstruction tridimensionnelle en imagerie medicale a partir de coupes paralleles. Application en imagerie scanner X et RMN, PHD Thesis, Universite de Rennes I, 1986 Luo, L.M., Coatrieux, J.L. : Surface normal for 3D object display in cuberille environment, Proc 10 th IEEE EMBS Conference, New Orleans, 420-421, nov. 1988 Meagher, D. : Octree encoding : a new technique for the representation manipulation and display of arbitrary 3D objects, IPL-TR-80-111, Rensselaer Polytechnic Institute, Troy, NY, Oct 1980 Meagher D. : Geometric Modeling Using Octree Encoding. Comp. Graph. & Im. Proc., Vol.19(2), 129-147, (1982) Meagher, D. : The manipulation analysis and display of 3D medical objects using octree encoding techniques, Special Issue on Computer Graphics, J.M. Scarabin, J.L. Coatrieux Eds, Innov Technol Biol Med, 8, 1, 23-36, (1987)
O'Donne ll, M. : Appli• 1106-1114, (1988) Pizer, S.M., Fuchs, H. with minimal pre. def Reddy, D.R., Rubm, ,c Comput Sci Dept, C Robb R.A., Barillot C Conf. on Hybrid Im Robb R.A., Barillot C. on Medical Imaging Roth S.D. : Ray Castin 18(2), pp.109-144,. Sandor, J. : Octree da1 393-405, (1985) Schlusselberg D.S., S1 Image Volumes. Pr: Sequeira, J. : Model., heterogenes. Apph• PHD Thesis, Unive Toumoulin, C., Prevo! Proc 11th IEEE EM Trousset Y., Schmil Eurographics'87, Pl Yau, M.M., Srihari, S. Comm A.C.M., 26,
195
)1.19(3), 41-44, (1985) el-based Objects. IEEE struction from Planar
nedical data. Computer objects, Comput Graph
ulation of 3D medical :Proc, 39, 1-27, (1987) splay of Biological and pp.26-38,(1985) ed Tomograms. Comp.
I
:r. J. Computer Assist.
· Level Gradients. IEEE
mographic Grey Level
:'HD Thesis, Dept Elect
!e dimensional objects,
Octree encoding with EE EMBS Conference, Jmiques par arbre octal 88 �ption d'architectures en imagerie med.i.cale, 3)
) voxel based imagery, c technique for surface -2, 399-409 (1988) ontours Lines. IBM J. raph . & Appl., pp.29le a partir de coupes , Universite de Rennes �uberille environment, ·88 :ion manipulation and �chnic Institute, Troy, Graph. & Im. Proc., l objects using octree arabin, J.L. Coatrieux
O'Donnell, M. : Applications of VLSI circuits to medical imaging, Proceedings IEEE, 76, 1106-1114, (1988) Pizer, S.M., Fuchs, H., Levoy, M., Rosenman, J.G., Davis, R.E., Renner, J.B.: 3D display with minimal predefinition. Proc Computer Assisted Radiology 723-736 (1989) Reddy, D.R., Rubin, S. : Representation of three-dimensional objects, CMU-CS- 78-113, Comput Sci Dept, Carnegie-Mellon University, Pittsburgh, April 1978 Robb R.A., Barillot C. : Interactive 3-D Image Display and Analysis. Proc. of SPIE 18th Conf. on Hybrid Image and Signal Processing, pp.173-202, Orlando 1988 Robb R.A., Barillot C. : Interactive Display and Analysis of 3-D Medical Images. IEEE Trans. on Medical Imaging, Vol.8(3), pp.217-226, (1989) Roth S.D. : Ray Casting for Solid Modeling. Computer Graphics and Image Processing, Vol. 18(2), pp.109-144,.(1982) Sandor, J. : Octree data structures and perspectives imagery, Computer and Graphics, 9, 4, 393-405, (1985) Schlusselberg D.S., Smith W.K., Woodward D.J. : Three-Dimensional Display of Medical Image Volumes. Proc. of 7 th NCGA, Vol.III, pp.114-123, Anaheim 1986 Sequeira, J. : Modelisation interactive d'objets de forme complexe a partir de donnees heterogenes. Application a la representation geometrique des organes du corps humain, PHD Thesis, Universite de Besanyon, 1987 Toumoulin, C., Prevost, G., Knoplioch, J. : Interactive three dimensional image workstation, Proc 11th IEEE EMBS Conference, Seattle, 354-535, Nov 1989 Trousset Y., Schmitt F. : Active Ray-Tracing for 3D Medical Imaging. In: Proc. Eurographics'87, pp.139-149, Amsterdam, 1987 Yau, M.M., Srihari, S.N. : A hierarchical data structure for multidimensional digital images, Comm A.C.M., 26, 7, 504-515, (1983)