Jun 2, 2009 - easy web-based animation from CS 0 to advanced CS courses. In SIGCSE '03: ... animated algorithms: the Leonardo Web Builder. In AVI '06: ...
A Survey of Successful Evaluations of Program Visualization and Algorithm Animation Systems Jaime Urquiza-Fuentes and J.Ángel Velázquez-Iturbide ACM Transactions on Computing Education (TOCE), 9}(2). ACM Press: New York, NY, Article 9. DOI: http://doi.acm.org/10.1145/1538234.1538236
© ACM, 2009. This is the author's version of the work. It is posted here by permission of ACM for your personal use. Not for redistribution. The definitive version was published in ACM Transactions on Computing Education (TOCE), 9(2). ACM Press: New York, NY, Article 9, June 2009, EISSN:1946-6226, http://doi.acm.org/10.1145/1538234.1538236
A Survey of Successful Evaluations of Program Visualization and Algorithm Animation Systems∗ JAIME URQUIZA-FUENTES ´ ´ J. ANGEL VELAZQUEZ-ITURBIDE Universidad Rey Juan Carlos June 2, 2009
Abstract This article reviews successful educational experiences in using program and algorithm visualizations (PAVs). First, we survey a total of 18 PAV systems that were subject to 33 evaluations. We found that half of the systems have only been tested for usability, them being shallow inspections. The rest have been evaluated with respect to their educational effectiveness. Script-based systems seem to be well suited for the viewing, responding and changing engagement levels, while compiler-based systems do for the construction and presenting engagement levels. Finally, we analyze additional PAV features of successful evaluations and hypothesize that they are relevant.
1
Introduction
Intuition about the educational benefits of program and algorithm visualization (PAV) systems Stasko et al. (1993) has contributed to their proliferation. However, the pedagogical benefits of PAVs are not clear. The relevant literature contains a number of reasons that has prevented their universal use Naps et al. (2003). We find in the literature a number of evaluations that report different educational results. One of the most significant studies on PAV effectiveness Hundhausen et al. (2002) concluded that the way students use visualizations is more important than the visualizations themselves. Based on this finding, the engagement levels taxonomy Naps et al. (2003) provides a framework to classify the interaction between students and PAV systems. In this article, we analyze successful evaluations of PAVs and make several contributions. First, the study itself brings together a number of successful ∗ ACM, c 2009. This is the author’s version of the work. It is posted here by permission of ACM for your personal use. Not for redistribution. The definitive version was published in ACM Transactions on Computing Education (TOCE), 9 (2). ACM, New York, NY, USA, Article 9. http://doi.acm.org/10.1145/1538234.1538236
1
evaluations that are spread in the literature. Second, we try to extract the main features of successful evaluations. The main factor is the engagement level achieved at the evaluation. After analyzing the evaluations, the authors felt that educational improvements could also depend on system-specific features. As a consequence, this survey also studies the educational effect of such features. The rest of the article is organized as follows. In Section 2, we describe systems that have been evaluated successfully with respect to usability or educational effectiveness. Section 3 analyzes successful educational evaluations, grouped by the engagement levels where learning improvement was detected, and makes explicit additional features present in PAVs. Both sections conclude with a discussion subsection that summarizes our findings. Finally, we draw our conclusions and outline areas for future research.
2
A survey of successful PAV systems
There are two features that most PAV systems have in common. On the one hand, they are highly interactive systems. On the other hand, most existing PAV systems are intended for education. If the way students interact with PAV systems is the key factor of their success Hundhausen et al. (2002), it is relevant to evaluate both issues: usability and learning outcomes. This section surveys PAV systems that have been successfully evaluated. Information was extracted from system evaluations described in journals or conferences of computer science education or learning technologies. We classify PAV systems and then review PAV systems that only were evaluated for usability. Finally, we review PAV systems that were evaluated for educational impact.
2.1
Classification of evaluated systems
We use two criteria to classify a system: abstraction level and implementation approach. Notice that the aim of these criteria is to aid us in describing the systems in the article, not to propose a system taxonomy. The criterion of abstraction level is based on the software visualization taxonomy defined by Price et al. (1998)’s software visualization taxonomy: Algorithm visualizations (AV) The static or dynamic visualization of higherlevel abstractions which describe the software. Program visualizations (PV) The visualization of actual program code or data structures –low-level abstration– in either static or dynamic form. The implementation criterion allows us to differentiate three kinds of systems: Script-based systems The user first identifies the interesting events to display and then inserts calls to the visualization engine into the source code.
2
Afterwards, code execution produces a script that is rendered into a visualization. The complexity of calls varies in the different scripting languages. Interface systems These systems do not generate any visualization, they only interact with users. Current interface systems generate visualizations using script-based systems, so some of them are hybrid systems including both features. Compiler-based systems In these systems the user does not need to modify the code, as visualization actions are automatically inserted by the compiler or virtual machine at compile- or run-time. This simplifies user interaction but limits the user’s control over the PAVs themselves.
2.2
Successfully evaluated systems with respect to usability
As stated above, PAV systems are interactive systems, therefore usability is a key property of those systems. There exist a number of aspects to evaluate usability and a number of methodologies to carry out these evaluations Kulyk et al. (2007). Usability of PAV systems has been evaluated using any of the following methodologies: Informal evaluations In this kind of evaluations, the students are typically asked their opinion after using the system. Descriptions of these evaluations often lack details of the process, materials or methodology used, reporting their results as positive/negative values. Heuristic evaluations These evaluations are performed by an expert, checking basic interactive features and also features specific to visualization systems. Query techniques This kind of evaluations consist in asking students, using questionnaires, about their opinion on different aspects of the system. The environment and the tasks performed by students are partially controlled by evaluators. Observational studies These evaluations differ from query techniques in the way information is collected. In this case, the evaluators observe how students use the system and write down everything they consider important for the evaluation. Controlled experiments In this evaluation type, the environment, the students and the tasks performed are highly controlled by evaluators. In addition to the students’ opinion, controlled experiments can provide information about effectiveness, ease of use, efficiency and other interesting issues. We have found nine PAV systems, which are grouped by their implementation approach. For each system, we identify its corresponding abstraction 3
level –either AV or PV– and we describe the methodology used to evaluate its usability. Table 1 summarizes this information. 2.2.1
Script-based systems
We have identified three script-based systems reporting successful usability evaluations: Animal, Jawaa and LJV. Animal1 R¨oßling et al. (2000) is a powerful AV system that allows the user to control most of the details in the visualization using the scripting language AnimalScript. It allows generating narrative contents and stop-and-think questions with explicit feedback. Animal was subject to an expert evaluation R¨oßling & Naps (2002). The construction of animations is not easy because of the complexity of the scripting notation. Consequently, it provides different approaches to simplify animation construction, such as support for editing AnimalScript code R¨oßling & Ackermann (2007); R¨oßling & Schroeder (2009). Jawaa 2 Pierson & Rodger (1998) is another AV system with its own scripting language. It passed an informal evaluation Akingbade et al. (2003) with positive results in the animations generated and negative results in the construction process. The authors also report that they have constructed a graphical editor that allows inserting graphical objects without writing their corresponding script code. Although Jawaa was included in the above mentioned study by R¨oßling & Naps (2002) –an expert evaluation of Animal–, it was just for comparative purposes rather than a planned evaluation of Jawaa. Therefore, we have not considered this study as an expert evaluation of Jawaa. LJV 3 Hamer (2004) is an AV system for data structures in Java. Students place visualization calls where they want to visualize the current state of an object. The system uses type information during execution to automatically produce the visualization of an object. Visualizers are implemented for trees and lists. Although students have limited control over graphical representations, the construction approach is less complex than in other script-based systems. LJV passed an informal evaluation Hamer (2004). 2.2.2
Script-based + interface systems
We have found three script-based systems with their own built-in interface: Alvie, Leonardo and Swan. Alvie 4 Crescenzi & Nocentini (2007) is an AV system with an XML-based scripting language. It has a simple interface to view animations that has also been integrated with a textbook on algorithms. It was successfully evaluated with query techniques in three different scenarios: students viewing animations, students constructing their own animations, and students presenting animations to an audience. 1 http://www.algoanim.info/Animal2/ 2 http://www.cs.duke.edu/csed/jawaa2/ 3 Lightweight
Visualizer for Java, http://www.cs.auckland.ac.nz/∼j-hamer/LJV.html
4 http://www.algoritmica.org
4
Leonardo 5 Crescenzi et al. (2000) is actually an IDE for the C language, whose virtual machine supports reverse execution. It has visualization capabilities aimed at the algorithmic level using the logic language ALPHA as a scripting language. It was subject to informal evaluations for both viewing and constructing animations with the ALPHA language. The latest efforts were dedicated to develop an interface for web-based animation construction Bonifaci et al. (2006). Swan 6 Shaffer et al. (1996) is an AV system that allows including textual explanations and changing the contents of data structures during algorithm execution. It provides algorithms for drawing arrays, lists and graphs, thus facilitating animation construction. Usability was evaluated in a controlled experiment that reported the notation was easy to learn and animations were successfully built. 2.2.3
Compiler-based systems
We have found three compiler-based systems: MAVIS, SRec and the Teaching Machine. MAVIS 7 Koifman et al. (2008) is an AV system where graphical representations must be developed in Java by the users. It provides the user with a API to control different abstraction levels. The evaluation focused on programming algorithms and constructing animations. A single evaluation session was conducted, including observational study and query techniques. Positive opinions were obtained regarding usefulness and manipulation of abstraction levels. SRec 8 Vel´ azquez-Iturbide et al. (2008) is an AV system for recursion in Java. Recursion instrumentation is automatic since the system inserts calls to gather information of method entry or exit at compile-time. When the user launches an algorithm execution, a trail of method entries and exits is produced. At that moment, the user may play the animation with a wide range of visualization and animation controls. The system provides several synchronized views, including recursion trees. SRec has successfully passed a strict usability inspection process consisting of a heuristic evaluation, a query technique, an observational study and a controlled experiment. Results were very positive and were used to enhance the system. The Teaching Machine 9 Norvell & Bruce-Lockhart (2000) is a PV system that visualizes the symbol table, the heap with the contents of variables and pointers and other typical facilities, such as source code, the execution point, the stack and evaluation of expressions. It has passed an evaluation with query techniques Bruce-Lockhart et al. (2007). The authors have developed WebWriter ++ Bruce-Lockhart & Norvell (2006), which is an authoring tool for 5 http://www.dis.uniroma1.it/∼demetres/Leonardo/ 6 http://research.cs.vt.edu/algoviz/Swan/ 7 http://www.ee.technion.ac.il/∼ayellet/MAVIS-movies/ 8 http://www.lite.etsii.urjc.es/srec/ 9 http://www.engr.mun.ca/∼mpbl/content/research/teachingMachine.htm
5
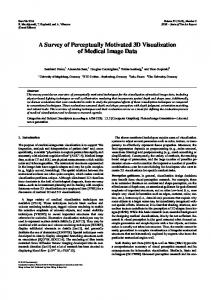
Figure 1: A general usability evaluation process, with the users and environment involved. web-based learning materials including textual contents and visualizations generated with the Teaching Machine. 2.2.4
Discussion
Usability evaluations should not be performed after the implementation of the system is complete, but they should be an integral part of the design and implementation process Kulyk et al. (2007). A general usability evaluation can consist of three phases (see Figure 1). First, early designs and prototypes are evaluated with heuristic inspections. Feedback of these evaluations is used to enhance the system. Second, the improved version of the system can be evaluated with query techniques, controlled experiments and observational studies. Again, the results of the evaluation assist in fixing errors and enhancing the system. Finally, observational and field studies allow evaluating the system in real use. Unfortunately, only one10 out of the nine considered systems (namely, SRec) has passed more than one phase in its usability evaluations. Informal evaluations were significantly used –three out of nine– but they neither provided useful information for developers or users different from the development team nor contributed to future improvements of the evaluated system.
2.3
Successfully evaluated systems with respect to learning outcomes
The main aim of PAV systems is to improve the learning of concepts visualized. In this subsection, we survey those PAV systems that have reported successful pedagogical evaluations. 10 Note
that the evaluation of MAVIS used two methodologies in the same session.
6
PAV system Animal Jawaa LJV Alvie LEONARDO Swan MAVIS SRec Teaching Machine
Abstraction/Implementation approach AV/Script AV/Script AV/Script AV/Script+Interface AV/Script+Interface AV/Script+Interface AV/Compiler AV/Compiler PV/Compiler
Usability evaluation methodology Heuristic Informal Informal Query Informal Controlled Observation, Query Heuristic, Observation, Query, Controlled Query
Table 1: Summary of usability evaluations. Hundhausen et al. (2002) stated that the effort devoted by students to visualization-related tasks is more important than the visual contents shown by PAVs. Going beyond passive viewing of PAVs, Naps et al. (2003) developed a taxonomy of different ways of interacting with PAVs. They called it the engagement levels taxonomy, suggesting a hierarchical structure where a higher engagement level leads to higher educational benefits. The following definitions of engagement levels are quotations extracted from Naps et al. (2003): Viewing This level can be considered the core form of engagement, (...) a learner can view an animation passively, but can also exercise control over the direction and pace of the animation, use different windows (each presenting a different view), or use accompanying textual or aural explanations. (...) The remaining four categories all include viewing. Responding The key activity in this category is answering questions concerning the visualization presented by the system. (...) In the responding form of engagement, the learner uses the visualization as a resource for answering questions. Changing It entails modifying the visualization. The most common example of such modification is allowing the learner to change the input of the algorithm under study in order to explore the algorithm’s behavior in different cases. Constructing In this form of engagement, learners construct their own visualizations of the algorithms under study. Hundhausen and Douglas [27] have identified two main ways in which learners may construct visualizations: direct generation and hand construction. (...) It is important to note that the constructing form of engagement does not necessarily entail coding the algorithm. Presenting It entails presenting a visualization to an audience for feedback and discussion. 7
We use this taxonomy to describe possible uses11 of each PAV system together with successful results reported in their evaluations. We have found nine systems of two types: script-based + interface systems and compiler-based systems. Table 2 summarizes this information. 2.3.1
Script-based + interface systems
We have identified three script-based + interface systems with successful pedagogical evaluations. ´ 12 Naps (2005) is an AV interface that allows including narrative JHAVE contents and stop-and-think questions to animations. Currently, it can be used with three scripting languages Naps & R¨oßling (2007): GAIGS-XML, Animal and JSamba. It has been evaluated at the responding engagement level Grissom et al. (2003), but it can also be used at the viewing and changing levels. The family of AV systems Polka/XTango/Samba/JSamba 13 Stasko (1992) is the most versatile up to day. They have been evaluated in all but one engagement level: viewing Lawrence (1993), responding Byrne et al. (1999), changing Lawrence (1993); Lawrence et al. (1994) and constructing Stasko (1997). Presenting is another possible use of these systems. A main contribution of these systems is a powerful scripting language that allows users to specify graphical representations of data structures –including textual contents– and animation effects. Finally, TRAKLA2 14 Malmi et al. (2004) is another AV interface, designed to visualize animations generated with Matrix Korhonen et al. (2004). Students interact with visualizations simulating the behavior of algorithms. Their visualizations are enhanced with additional explanations plus automatic assessment of students’ simulations. Students’ generated simulations seem to correspond to the construction engagement level. However, we have classified their evaluation at the responding engagement level Laakso et al. (2005) because the main aim of students is to correctly determine each step of the algorithm, rather than construct an expressive animation that illustrates the behavior of the algorithm. In other words, cognitive effort is dedicated to answer the implicit question what is the effect of the next step?, rather than designing an animation for better understanding of the algorithm. Other possible uses of this system lie at the viewing and changing engagement levels. 2.3.2
Compiler-based systems
The remaining six systems follow a compiler-based approach. Alice 15 Moskal et al. (2004) is an AV system for object-oriented programming. Algorithms are written in a specific pseudo-code and objects are cor11 where possible use means an unsuccessful reported use or an unreported use, in both cases immediately applicable. 12 http://jhave.org/ 13 http://www.cc.gatech.edu/gvu/softviz/algoanim/samba.html 14 http://www.cs.hut.fi/Research/TRAKLA2/ 15 http://www.alice.org/
8
respondingly visualized in a 3D virtual world. It has been evaluated at the changing engagement level, but animations may also be used at the viewing, constructing and presenting engagement levels. Alvis Live! 16 Hundhausen & Brown (2005) is an AV system, where algorithms written in the SALSA pseudo-code language are immediately visualized, i.e. at editing time. Its visualizations have a low-fidelity look, making use of the conventions students would informally use rather than what an expert would do. It allows dragging graphical objects, which are then transformed in their corresponding pseudo-code sentences. Alvis Live! has been evaluated at a constructing+presenting Hundhausen & Brown (2008) engagement level, but it can also be used at the viewing and changing engagement levels. Jeliot 17 Moreno et al. (2004) is a PV system designed to visualize basic features of the Java language in introductory programming courses. It allows students to immediately visualize their own programs. Recent efforts were dedicated to the integration with BlueJ and the automatic generation of stop-andthink questions Myller (2007). Jeliot can be used at all engagement levels, but it has only been evaluated at the changing engagement level Ben-Bassat et al. (2003). jGRASP 18 Hendrix et al. (2004) is actually a programming environment for Java with visualization capabilities. Its visualizations are powerful because jGRASP provides multiple views of source code, low-level objects and high-level visualizations. The latter have to be developed by teachers from a template provided by the system. These visualizations are called external visualizers and provide students with multiple views of the same object. jGRASP supports program visualization but has been evaluated as an AV system at the changing engagement level Cross et al. (2007); Jain et al. (2006). However, it can also be used at the viewing, constructing and presenting engagement levels. VIP 19 Virtanen et al. (2005) is a PV system that supports a subset of C++ without object-oriented features. It allows associating textual explanations to locations of the source code. The user can use non-standard conditions to generate animations, such as execution conditions (e.g. the first time a sentence is executed), or variable usage (e.g. input/output). It was evaluated at the changing engagement level Ahoniemi & Lahtinen (2007), but it can also be used at the viewing, constructing and presenting levels. Recent efforts are devoted to including program assessment results as contents. Finally, WinHIPE 20 Pareja-Flores et al. (2007) is a functional programming environment with visualization capabilities. It visualizes functional expressions, which contain both data structures –trees or lists– and language constructions; therefore, it is an AV system as well as a PV system. Visualizations generated by WinHIPE include textual explanations and are constructed using an effortless approach that has been evaluated for effectiveness and efficacy Vel´azquez16 http://eecs.wsu.edu/∼veupl/soft/alvis/index.htm 17 http://cs.joensuu.fi/∼jeliot/ 18 http://www.jgrasp.org 19 http://www.cs.tut.fi/∼vip/en/ 20 http://www.lite.etsii.urjc.es/winhipe/
9
PAV system JHAVE JSamba TRAKLA2 Alice Alvis Live! Jeliot JGrasp VIP WinHIPE
Abstraction/Implementation approach AV/Script+Interface AV/Script+Interface AV/Script+Interface AV/Compiler AV/Compiler PV/Compiler AV/Compiler PV/Compiler AV/PV/Compiler
Engagement V R Ch √ • • √ √ √ √ • • √ • • • √ • • √ • √ • √ •
levels C P √ • • • • √
• √
• • • • •
Table 2: Summary of educational evaluations. Columns grouped under the “Engagement levels” label correspond to the (V)iewing, (R)esponding, (Ch)anging, (C)onstructing and (P)resenting engagement levels. A bullet√• means that the system can be used at that engagement level, and a check means that the system has been successfully evaluated at that engagement level. Iturbide et al. (2008). WinHIPE was evaluated at two engagement levels: viewing Urquiza-Fuentes (2008) and constructing Urquiza-Fuentes (2008); UrquizaFuentes & Vel´ azquez-Iturbide (2007), but it can also be used at the changing and presenting levels. 2.3.3
Discussion
Hundhausen et al. (2002) suggested that highly engaging tasks (i.e. placed at the constructing or presenting engagement levels) can be beneficial for the learning process. Therefore, it can be worthwhile to compare both kinds of systems with respect to their coverage of different engagement levels, as shown in Table 2. At a first glance, compiler-based systems seem to support better higher levels of the engagement taxonomy. One plausible reason is that these systems foster students to focus on building expressive animations rather than on more mundane activities such as using a scripting API, compute locations or defining object movements. A similar conclusion was reached by Hundhausen (2002) when comparing the script-based+interface system SAMBA with a set of tools chosen by students. This conclusion is consistent with efforts aimed at simplifying the construction process in several script-based systems, e.g. the editing facilities for AnimalScript language R¨oßling & Ackermann (2007); R¨oßling & ´ web Schroeder (2009), or the materials for developers published at the JHAVE 21 site . On the other hand, script-based systems have strengths on their own. They were the most successful systems in percentage at the viewing engagement level: 33%(1/3) against 16.7%(1/6). Moreover, this is the only kind of systems that 21 http://jhave.org/developer/
10
obtained successful results at the responding engagement level. As Table 2 shows, Jeliot represents an attempt of a compiler-based system to cover this engagement level. Frequently, the border between PV and AV systems is blurred in an attempt of a system in a category to have advantages of the other category. We have seen three examples in subsection 2.2 of systems that try to combine highly expressive animations and less user effort: Swan Students have to code graphical representations, but they can use builtin algorithms for drawing graphs, lists and trees. LJV Students only have to identify locations in the source code where the state of objects are to be visualized and insert simple API calls. SRec The system locates methods and parameters to visualize recursion. Consequently, students do not have to change source code, but they may interactively select the methods or parameters to visualize to enhance comprehensibility. Notice that there is no technical restriction to use any specific scripting technology. In these three cases, graphical representations were generated with different scripting technologies –SAIL Shaffer et al. (1996) for Swan, GraphViz22 for LJV, and JGraph23 for SRec– but they could have been generated with the same technology. In any case, students need not know much about it. Looking information surveyed in Table 2, the hypothetical hierarchical structure of engagement levels –the more engagement, the better learning– is not clear. We could expect to find more successful experiments in the literature aimed at the higher engagement levels, given that they would provide higher educational benefits. In addition, some systems offer special animation features or have been evaluated in particular situations that may have contributed to their educational success. In the following section, we move from systems to individual experiments carried out with them. As a consequence, we make explicit the engagement level in every evaluation, but also the special features or particular situations present.
3
A survey of successful PAV educational evaluations
In this section, we focus on successful educational evaluations of PAVs. We change our terminology from “evaluation” to “experiment”, as one evaluated system may be subject to several experiments. Notice that evaluating PAVs is not the same as evaluating PAV systems, although both evaluations are obviously related. In addition to evaluations cited in the previous section, we have found five additional publications reporting PAV educational evaluations. 22 http://www.graphviz.org/ 23 http://www.jgraph.com/
11
However, they are not tied to a particular system, but they use ad-hoc visualizations Crosby & Stelovsky (1995); Kann et al. (1997); Hansen et al. (2000); H¨ ubscher-Younger & Narayanan (2003) or represent an auxiliary use of PAVs in other educational tools Kumar (2005). We have considered 24 experiments. Having a look at them, one suspects that just delivering visualizations is not enough to obtain educational improvements, as Hundhausen et al. (2002) stated. Successful experiments report a wide variety of visualization features: high quality contents Hansen et al. (2000), advanced manipulation interfaces Cross et al. (2007); Jain et al. (2006), or adding visualization sessions to regular classes Moskal et al. (2004). Our aim is to deepen in the effect that additional features have on educational improvement. After a first review of experiments, we identified four features to consider: Narrative contents and textual explanations These may assist students in understanding graphical depictions generated by a PAV system. In addition, when students build their own animations, adding narrative contents engage students in a reflection exercise that may enhance learning outcomes. Feedback on student’s actions When an animation is played, students may be asked to predict future steps of the algorithm. Feedback to their answers could reinforce right answers or correct wrong ones. As animations inherently provide feedback on the next step, we only take into account explicit feedback, for either right or wrong answers. Extra time using PAV Many tasks in typical learning environments cannot be replaced with animation-based tasks. Therefore, extra time is often needed to use animations. Advanced features Some systems deliver advanced contents showing different behaviors of the algorithm, advanced interfaces to manipulate visualizations, or advanced integration with an IDE. In our analysis of experiments, we have used the educational improvements reported and their engagement levels. With respect to educational improvements, they can be classified into knowledge acquisition, student’s performance in programming, or student’s attitude towards subjects or materials. With respect to engagement levels, we have identified two experimental designs: experiments studying improvements at one or two engagement levels, and comparative studies. In this section, we describe experiments grouped by the engagement level where the educational improvement was detected. Table 3 summarizes these experiments.
3.1
Viewing
The six experiments placed at this level detected educational improvements in terms of knowledge acquisition. Chapter 7 of Lawrence’s dissertation Lawrence 12
(1993) detected improvements when using PAVs with textual labels. Crosby & Stelovsky (1995) detected improvements when using multimedia materials made up of visualizations and narrative contents, comparing it with the no viewing level. Kann et al. (1997) made a comparative study among no viewing, viewing, constructing and viewing and constructing. They only detected significant improvements between viewing and no viewing students. It is the only viewing experiment without textual or narrative contents. Kehoe et al. (2001) studied the use of PAV in an environment that simulated homework. Thus, students used animations to complete assignments without time limit. Kumar’s experiment Kumar (2005) represents an auxiliary use of visualization. The main role of Kumar’s system is tutoring students, providing them with automatically generated problems. His experiment found that using visualizations within the feedback provided by the tutor improves knowledge acquisition. Finally, Urquiza-Fuentes (2008) investigates the effect of replacing a part of exercises sessions with program visualization sessions during a long term evaluation. The animations had additional textual explanations.
3.2
Responding
The three studies placed at this level compare responding with no viewing. The first two experiments detected improvements in knowledge acquisition and were supported by additional narrative contents. Although Byrne et al. (1999) used a plain algorithm animation, the instructor posed questions to students that had to be answered during the animation. Grissom et al. (2003) used a system that automatically integrated the questions within the animation. Finally, Laakso et al. (2005) went beyond simple questions, engaging students in simulation tasks. Here, students manipulate a data structure, simulating the behavior of a given algorithm and receiving explicit feedback about their simulations. They also used the viewing level, as students were allowed to see animations of the algorithm they had to simulate.
3.3
Changing
The first two experiments mixed the responding and changing levels, and compared them to viewing and no viewing. They are described in the same publication Hansen et al. (2000) –studies I, II, IV and V–. They use high-quality educational materials consisting of three different animations –conceptual/abstract, detailed and populated– of the same algorithm, questions and explicit feedback on their answers. Lawrence compared the effect of changing input data in animations with respect to the no viewing and viewing levels. In the comparative study with the no viewing level Lawrence et al. (1994), she found improvements in knowledge acquisition; the animations had narrative contents and students who worked with them had an additional lab session. She also compared the changing and 13
viewing levels Lawrence (1993) without additional features, again obtaining improvements in knowledge acquisition. Ben-Bassat et al. (2003) studied the use of a visualization tool for teaching Java to novices. They found that only average students improved their knowledge. Moskal et al. (2004) focused on novice students “at risk” of not succeeding in their first programing course. They detected improvements in knowledge acquisition. These students were enrolled in an extra course where they worked with an advanced tool to learn OO programming basics. Ahoniemi & Lahtinen (2007) compared the changing level with the no viewing level. They used animations with additional narrative contents. This experiment used homework assignments, so working time was not limited. In the last experiment Cross et al. (2007); Jain et al. (2006), the instructors provided students with an advanced tool integrated in a Java IDE, while students in the no viewing group used the same environment without visualization features. The students completed programming and debugging tasks with the environment.
3.4
Constructing
Stasko (1997) designed assignments where students had to construct their own animations. They also included some changing activities. He detected that students dedicated more time to study algorithms for which they had constructed animations. Urquiza-Fuentes & Vel´azquez-Iturbide (2007) made a short term comparative study with the viewing level. Students within the constructing group generated animations with textual explanations using an effortless approach, while the others just viewed the same kind of animations, previously generated by the instructors. They detected improvements in students’ attitude. Besides, constructing students were longer involved with the algorithm, improving their knowledge acquisition. Finally, Urquiza-Fuentes (2008) studied the effect of the same construction approach in a long term evaluation. He compared the constructing level with respect to the viewing and no viewing levels. He detected improvements in attitude on both comparisons; he also detected improvements in knowledge acquisition when compared to the no viewing level.
3.5
Presenting
The three experiments studying the presenting level include construction tasks with additional narrative contents. Two of them focused just on this mixture of tasks Hundhausen (2002); Hundhausen & Brown (2008), while the other compared it with the viewing level. Hundhausen (2002) compared constructing and presenting tasks using two different tools: a well-known algorithm visualization tool, and artifacts selected by the students, ranging from slides to crafts. This observational study detected improvements in attitude of students who used their own artifacts. Based on 14
these results, a tool to construct algorithm animations was developed and compared again with construction artifacts selected by students Hundhausen & Brown (2008). In this experiment, improvements in programming performance were detected on students who worked with the new tool. H¨ ubscher-Younger & Narayanan (2003) compared the presenting and constructing levels with the viewing level. They encouraged students –as a voluntary task– to generate animations and asked them to evaluate –as a compulsory task– those generated by the rest of the students. The construction utilities were chosen by the students. They detected improvements in knowledge acquisition of students who constructed the animations.
3.6
Discussion
This subsection analyzes the results obtained by the experiments previously mentioned. First, we give a global view. Then, we give recommendations for each engagement level regarding the visualization system and design of the experiment. Finally, we suggest possible changes between engagement levels, the related recommendations and the possible learning improvements. 3.6.1
A global view
Results show that learning can be enhanced with PAVs in several ways. Improvements in knowledge acquisition were detected in 75% (18/24) of the experiments. This improvement is found at any engagement level. Over 20% (5/24) of the experiments detected improvements in attitude towards either materials or subject matters. Finally, programming skills can also be improved, as was found in more than 8% (2/24) of the experiments. Focusing on engagement levels, there are two ends. Changing is the most frequently investigated level with 37.5%(9/24) of the experiments, while presenting is at the opposite with 12.5%(3/24). Responding is present in 20.8%(5/24) of the experiments, and both viewing and constructing are present in 27.2%(7/24) of the experiments. Not all the experiments compare two levels: 20.8%(5/24) of them explore improvements within a particular level. Within comparative experiments, 73.7%(14/19) of them studied effectiveness of PAVs with respect to no use; the rest –26.3%(5/19)– compared to the viewing engagement level. The use of narrative and textual contents is present in 75%(18/24) of the experiments. This means that they are an important factor to take into account when designing learning experiments with PAV. Explicit feedback, extra working time or advanced features, such as high quality contents or advanced interfaces, are present in more than 20% of the experiments.
15
Experiment Lawrence (1993) Ch.7 Crosby & Stelovsky (1995) Kann et al. (1997) Kehoe et al. (2001) Kumar (2005) (Feedback of tutoring system) Urquiza-Fuentes (2008) Byrne et al. (1999) Grissom et al. (2003) Laakso et al. (2005) Hansen et al. (2000) Studies I-II-IV Hansen et al. (2000) Study V Lawrence (1993) Ch.6 Lawrence et al. (1994) Ben-Bassat et al. (2003) Moskal et al. (2004) Ahoniemi & Lahtinen (2007) Cross et al. (2007); Jain et al. (2006) Stasko (1997) Urquiza-Fuentes & Vel´azquez-Iturbide (2007) Urquiza-Fuentes (2008) Urquiza-Fuentes (2008) Hundhausen (2002) H¨ ubscher-Younger & Narayanan (2003) Hundhausen & Brown (2008)
EI K K K K K K K K A K K K K K K A/K P A A/K A&K A A K P
EL (V) (V) ⇒ NV (V) ⇒ NV (V) ⇒ NV (V) ⇒ NV (V) ⇒ NV (R) ⇒ NV (R) ⇒ NV (R,V) ⇒ NV (CH,R) ⇒ NV (CH,R) ⇒ V (CH) ⇒ V (CH) ⇒ NV (CH) (CH) ⇒ NV (CH) ⇒ NV (CH) ⇒ NV (C,CH) (C) ⇒ V (C) ⇒ NV (C) ⇒ V (P,C) (P,C) ⇒ V (P,C)
N
T
A
⋆ ⋆ ⋆ ⋆ ⋆ ⋆ ⋆
⋆
⋆ ⋆ ⋆ ⋆ ⋆ ⋆ ⋆ ⋆ ⋆ ⋆ ⋆ ⋆ ⋆ ⋆ ⋆
Table 3: Summary of successful experiments grouped by engagement levels. The column labeled with EI encodes the kind of educational improvement, where K, A and P stand for knowledge acquisition, attitude and programming performance, respectively. If more than one kind of educational improvement is detected we use the “X&Y” notation if both are directly caused by the treatment, and the “X/Y” notation if it is not clear which one is directly caused by the treatment. The column labeled with EL indicates the engagement levels involved in the experiment. It also differentiates between comparative studies, encoded as “(X) ⇒ Y” where X obtained better results than Y, and non-comparative studies. The columns labeled with N, F and T indicate respectively if narratives, explicit feedback or extra time were used in the experiment. Finally, the column labeled A indicates advanced features, where C, I and V stand for contents, IDE interface and visualization interface.
16
F
C C
⋆ ⋆
V
⋆
V V V
I
V
3.6.2
Recommendations for designing visualization-based learning experiences
We must first note that this is not a meta-study like Hundhausen et al. (2002), since only successful evaluatinos are studied. As a consequence, we cannot give formal and scientific evidence of correlations among the different engagement levels and educational improvements. However, all of these experiments give empirical evidence on successful uses of different engagement levels. Consequently, we extract a number of recommendations for each engagement level. Just viewing animations can improve knowledge acquisition. Animations should have additional text or narrative contents. When students answer questions during an animation, they should also be provided with additional narrative or textual contents. Explicit feedback is also important (although it is not present in two of the experiments). The questions made in these experiments were predictive, so their answers were contained in subsequent steps of their animations. Allowing the students to change input data is a more active task. Here, narratives and textual contents seem to be less important (62.5%, 5 out of 8). This is probably due to the fact that researchers were more interested in cognitive work performed by students when choosing input data, than in enhancing the contents shown to the students. As it is an exploratory task, fixing a rigid time limit should be avoided. In addition, some advanced features may produce learning outcomes, for instance high-quality contents –such as different execution scenarios Hansen et al. (2000)–, integration with an IDE Moskal et al. (2004), or an interface to manipulate animations Cross et al. (2007); Jain et al. (2006). When students construct their own animations, the construction interface is very important. Six out of seven studies involving construction tasks provided the students with carefully designed interfaces, or allowed them to choose their own construction kits24 . Its corresponding construction process should be effortless. Encouraging students to produce their own textual or narrative contents is also positive. Most improvements have also been detected in attitude towards materials and subjects. Finally, students are typically asked to present animations constructed by themselves. Therefore, recommendations of the previous paragraph also are applicable. 3.6.3
Suggestions for moving through engagement levels
We can analyze experiments to determine what engagement levels were the most effective, and why. Most of the experiments reported on improvements when comparing with the no viewing or viewing engagement levels. We analyze them in detail. 24 Both represent a student-centered approach rather than a high-technology-centered approach.
17
Moving from the no viewing engagement level The no viewing level means that no PAVs are being used. Therefore, the simplest change consists in moving to the viewing level, where knowledge acquisition is improved. There exist a number of PAV collections, but if one wants to generate one’s own PAVs, narrative and textual contents should be included. Moving to the responding level is also possible due to PAV collections. This change can improve attitude and knowledge acquisition. When designing your own responding experiments, the use of narrative contents and explicit feedback is important. Attitude, knowledge acquisition and programming skills can be improved by moving to the changing level. Probably, it will demand more time from students, because this level is often used in homework assignments. Again, narrative contents and explicit feedback –just in case of using this level together with responding– are suggested. Building one’s own system requires non-trivial development effort to develop advanced features (such as high-quality contents, good integration with an IDE, or advanced programming or visualization interfaces). Finally, moving to the constructing level can improve attitude and knowledge acquisition. The construction process should be effortless, and narrative contents should also be added. Moving from the viewing engagement level This level typically provides poor interaction experiences. A simple change is moving to the changing level, where knowledge acquisition is improved. In addition to narrative contents and explicit feedback, high-quality contents have proved to be effective. Moving to the constructing level may improve attitude and, as a side effect, knowledge acquisition. The construction process should be effortless, and narrative contents should be integrated into the animations. It can be used with the presenting level, improving knowledge acquisition, but students should be free to choose their own construction kits.
4
Conclusions and future work
Engaging students with PAVs is a plausible way to make them effective educational tools. In this article, we have reviewed successful evaluations of either PAV systems or pedagogical experiences. Regarding the PAV systems evaluated, about half of them have only been subject to usability tests. Unfortunately, most of the published usability tests do not appear to be integrated in a standard feedback-based development cycle. Furthermore, 33% of them are informal evaluations with little contribution to future improvements of the evaluated system and useless information for users outside the development team. Usability is a requirement to accomplish in educational software due to the fact it is highly interactive, in particular in PAV systems. In addition, usability is an important factor to allow a system to
18
go beyond the undesired scenario of “a PAV system developed by ’me’ and only used by ’me’”. The other half of the systems have been subject to educational evaluations. We have found that in general script-based systems are more suitable for the viewing or responding levels. In effect, this kind of systems provides powerful scripting languages that produce visualizations with narrative contents and stop-and-think questions. Such scripting languages are expressive but also are complex, therefore their use to construct PAVs hardly produces learning improvements. Compiler-based systems are more suitable for the changing, construction and presenting engagement levels. This is because they liberate students from details of the scripting language and allow to focus their attention on the animation contents. There exist attempts from both approaches to reach a midpoint. On the one hand, scripting languages can be less complex (e.g. LJV requests students only to mark in source code the locations where the current state of an object must be visualized, and Swan provides an API with graph, lists and trees drawing algorithms, alleviating students from implementing such low-level details). Scripting notations could even have two versions, one for experts and the other for novices. On the other hand, compiler-based systems may provide facilities to change the look of visualizations or animations (e.g. SRec provides with a wide range of customization and interaction facilities), to include narrative contents (e.g. in WinHIPE), and to generate stop-and-think questions (e.g. in Jeliot). Regarding the pedagogical effectiveness of the engagement levels, this is not a meta-study, as we have not included unsuccessful experiments. Therefore, we can not claim that the features under study are statistically significant factors of educational improvement. However, we can give some recommendations, as many features were present in such experiments: narrative and textual contents, feedback to students’ answers, and a student-centered approach in the design of PAV construction kits. Future work will consider unsuccessful experiments and the research methodologies used. Hopefully, we will then be able to establish correlations between engagement levels, research methodologies, educational improvements, PAV systems and usability evaluations.
5
Acknowledgements
The authors thank the anonymous TOCE reviewers for their suggestions on how to improve the article, and specially Dr. R¨oßling for his help in producing its final version. This work is supported by project TIN2008-04103/TSI of the Spanish Ministry of Science and Innovation.
19
References Ahoniemi, T., & Lahtinen, E. (2007). Visualizations in preparing for programming exercise sessions. Electronic Notes in Theoretical Computer Science, 178 , 137–144. Akingbade, A., Finley, T., Jackson, D., Patel, P., & Rodger, S. (2003). JAWAA: easy web-based animation from CS 0 to advanced CS courses. In SIGCSE ’03: Proceedings of the 34th SIGCSE Technical Symposium on Computer Science Education, (pp. 162–166). New York, NY, USA: ACM Press. Ben-Bassat, R., Ben-Ari, M., & Uronen, P. (2003). The Jeliot 2000 program animation system. Computers & Education, 40 (1), 1–15. Bonifaci, V., Demetrescu, C., Finocchi, I., & Laura, L. (2006). Visual editing of animated algorithms: the Leonardo Web Builder. In AVI ’06: Proceedings of the Working Conference on Advanced Visual Interfaces, (pp. 476–479). New York, NY, USA: ACM Press. Bruce-Lockhart, M., Norvell, T., & Cotronis, Y. (2007). Program and algorithm visualization in engineering and physics. Electronic Notes in Theoretical Computer Science, 178 , 111–119. Bruce-Lockhart, M., & Norvell, T. S. (2006). Interactive embedded examples: a demonstration. In ITiCSE ’06: Proceedings of the 11th Annual Conference on Innovation and Technology in Computer Science Education, (pp. 357–357). New York, NY, USA: ACM Press. Byrne, M., Catrambone, R., & Stasko, J. (1999). Evaluating animations as student aids in learning computer algorithms. Computers & Education, 33 , 253–278. Crescenzi, P., Demetrescu, C., Finocchi, I., & Petreschi, R. (2000). Reversible execution and visualization of programs with Leonardo. Journal of Visual Languages and Computing, 11 (2), 125–150. Crescenzi, P., & Nocentini, C. (2007). Fully integrating algorithm visualization into a CS2 course: a two-year experience. In ITiCSE ’07: Proceedings of the 12th Annual Conference on Innovation and Technology in Computer Science Education, (pp. 296–300). New York, NY, USA: ACM Press. Crosby, M., & Stelovsky, J. (1995). From multimedia instruction to multimedia evaluation. Journal of Educational Multimedia and Hypermedia, 4 , 147–162. Cross, J., Hendrix, T., Jain, J., & Barowski, L. (2007). Dynamic object viewers for data structures. In SIGCSE ’07: Proceedings of the 38th SIGCSE Technical Symposium on Computer Science Education, (pp. 4–8). New York, NY, USA: ACM Press.
20
Grissom, S., McNally, M., & Naps, T. (2003). Algorithm visualization in CS education: comparing levels of student engagement. In SoftVis ’03: Proceedings of the 2003 ACM Symposium on Software Visualization, (pp. 87–94). New York, NY, USA: ACM Press. Hamer, J. (2004). A lightweight visualizer for Java. In Proceedings of the Third Program Visualization Workshop, (pp. 54–61). Coventry, UK: University of Warwick. Hansen, S., Narayanan, N., & Schrimpsher, D. (2000). Helping learners visualize and comprehend algorithms. Interactive Multimedia Electronic Journal of Computer-Enhanced Learning, 2 (1). Available at http://imej.wfu.edu/articles/2000/1/02/ (2008). Hendrix, T., Cross, J., & Barowski, L. (2004). An extensible framework for providing dynamic data structure visualizations in a lightweight IDE. In SIGCSE ’04: Proceedings of the 35th SIGCSE Technical Symposium on Computer Science Education, (pp. 387–391). New York, NY, USA: ACM Press. H¨ ubscher-Younger, T., & Narayanan, N. (2003). Dancing hamsters and marble statues: characterizing student visualizations of algorithms. In SoftVis ’03: Proceedings of the 2003 ACM Symposium on Software Visualization, (pp. 95–104). New York, NY, USA: ACM Press. Hundhausen, C. (2002). Integrating algorithm visualization technology into an undergraduate algorithms course: ethnographic studies of a social constructivist approach. Computers & Education, 39 (3), 237–260. Hundhausen, C., & Brown, J. (2005). What you see is what you code: a “radically-dynamic” algorithm visualization development model for novice learners. In VL/HCC ’05: Proceedings of the 2005 IEEE Symposium on Visual Languages and Human-Centric Computing, (pp. 163–170). Los Alamitos, CA, USA: IEEE Computer Society Press. Hundhausen, C., & Brown, J. (2008). Designing, visualizing, and discussing algorithms within a CS 1 studio experience: an empirical study. Computers & Education, 50 (1), 301–326. Hundhausen, C., Douglas, S., & Stasko, J. (2002). A meta-study of algorithm visualization effectiveness. Journal of Visual Languages and Computing, 13 (3), 259–290. Jain, J., Cross, J., Hendrix, T., & Barowski, L. (2006). Experimental evaluation of animated-verifying object viewers for Java. In SoftVis ’06: Proceedings of the 2006 ACM Symposium on Software Visualization, (pp. 27–36). New York, NY, USA: ACM Press. Kann, C., Lindeman, R., & Heller, R. (1997). Integrating algorithm animation into a learning environment. Computers & Education, 28 (4), 223–228. 21
Kehoe, C., Stasko, J., & Taylor, A. (2001). Rethinking the evaluation of algorithm animations as learning aids: an observational study. International Journal of Human-Computer Studies, 54 (2), 265–284. Koifman, I., Shimshoni, I., & Tal, A. (2008). MAVIS: A multi-level algorithm visualization system within a collaborative distance learning environment. Journal of Visual Languages and Computing, 19 (2), 182–202. Korhonen, A., Malmi, L., Silvasti, P., Karavirta, V., L¨onnberg, J., Nikander, J., Stlnacke, K., & Ihantola, P. (2004). Matrix - a framework for interactive software visualization. Tech. Rep. TKO-B 154/04, Laboratory of Information Processing Science, Department of Computer Science and Engineering, Helsinki University of Technology, Helsinki, Finland. Kulyk, O., Kosara, R., Urquiza-Fuentes, J., & I., W. (2007). Human-Centered Visualization Environments, chap. Human-Centered Aspects, (pp. 13–75). Springer-Verlag. Kumar, A. (2005). Results from the evaluation of the effectiveness of an online tutor on expression evaluation. In SIGCSE ’05: Proceedings of the 36th SIGCSE Technical Symposium on Computer Science Education, (pp. 216– 220). New York, NY, USA: ACM Press. Laakso, M.-J., Salakoski, T., Grandell, L., Qiu, X., Korhonen, A., & Malmi, L. (2005). Multi-perspective study of novice learners adopting the visual algorithm simulation exercise system TRAKLA2. Informatics in Education, 4 (1), 49–68. Lawrence, A. (1993). Empirical studies of the value of algorithm animation in algorithm understanding. Ph.D. thesis, Dep. of Computer Science, Georgia Institute of Technology. Lawrence, A., Badre, A., & Stasko, J. (1994). Empirically evaluating the use of animations to teach algorithms. In VL ’94: Proceedings of the 1994 IEEE Symposium on Visual Languages, (pp. 48–54). Los Alamitos, CA, USA: IEEE Computer Society Press. Malmi, L., Karavirta, V., Korhonen, A., Nikander, J., Sepp¨ al¨ a, O., & Silvasti, P. (2004). Visual algorithm simulation exercise system with automatic assessment: TRAKLA2. Informatics in Education, 3 (2), 267–288. Moreno, A., Myller, N., Sutinen, E., & Ben-Ari, M. (2004). Visualizing programs with Jeliot 3. In AVI ’04: Proceedings of the Working Conference on Advanced Visual Interfaces, (pp. 373–376). New York, NY, USA: ACM Press. Moskal, B., Lurie, D., & Cooper, S. (2004). Evaluating the effectiveness of a new instructional approach. In SIGCSE ’04: Proceedings of the 35th SIGCSE Technical Symposium on Computer Sceince Education, (pp. 75–79). New York, NY, USA: ACM Press. 22
Myller, N. (2007). Automatic generation of prediction questions during program visualization. Electronic Notes in Theoretical Computer Science, 178 , 43–49. Naps, T. (2005). JHAVE: supporting algorithm visualization. IEEE Computer Graphics and Applications, 25 , 49–55. Naps, T., Roessling, G., Almstrum, V., Dann, W., Fleischer, R., Hundhausen, C., Korhonen, A., Malmi, L., McNally, M., Rodger, S., & Vel´azquez-Iturbide, J. (2003). Exploring the role of visualization and engagement in computer science education. SIGCSE Bulletin, 35 (2), 131–152. ´ – more visualizers (and visualizations) Naps, T., & R¨oßling, G. (2007). JHAVE needed. Electronic Notes in Theoretical Computer Science, 178 , 33–41. Norvell, T., & Bruce-Lockhart, M. (2000). Taking the hood off the computer: Program animation with the Teaching Machine. In Proceedings of the Canadian Electrical and Computer Engineering Conference, (pp. 831–835). Pareja-Flores, C., Urquiza-Fuentes, J., & Vel´azquez-Iturbide, J. (2007). WinHIPE: an IDE for functional programming based on rewriting and visualization. SIGPLAN Notices, 42 (3), 14–23. Pierson, W., & Rodger, S. (1998). Web-based animation of data structures using JAWAA. In SIGCSE ’98: Proceedings of the 29th SIGCSE Technical Symposium on Computer Science Education, (pp. 267–271). New York, NY, USA: ACM Press. Price, B., Baecker, R., & Small, I. (1998). An introduction to software visualization. In J. Stasko, J. Domingue, M. Brown, & B. Price (Eds.) Software Visualization, (pp. 3–27). Cambridge, MA: MIT Press. R¨oßling, G., & Ackermann, T. (2007). A framework for generating AV content on-the-fly. Electronic Notes in Theoretical Computer Science, 178 , 23–31. R¨oßling, G., & Naps, T. (2002). A testbed for pedagogical requirements in algorithm visualizations. In ITiCSE ’02: Proceedings of the 7th Annual Conference on Innovation and Technology in Computer Science Education, (pp. 96–100). New York, NY, USA: ACM. R¨oßling, G., & Schroeder, P. (2009). Animalipse - an Eclipse plugin for AnimalScript. Electronic Notes in Theoretical Computer Science, 224 , 3–14. R¨oßling, G., Sch¨ uer, M., & Freisleben, B. (2000). The ANIMAL algorithm animation tool. In ITiCSE ’00: Proceedings of the 5th Annual Conference on Innovation and Technology in Computer Science Education, (pp. 37–40). New York, NY, USA: ACM Press. Shaffer, C., Heath, L., & Yang, J. (1996). Using the Swan data structure visualization system for computer science education. In SIGCSE ’96: Proceedings of the 27th SIGCSE Technical Symposium on Computer Science Education, (pp. 140–144). New York, NY, USA: ACM Press. 23
Stasko, J. (1992). Animating algorithms with XTANGO. SIGACT News, 23 (2), 67–71. Stasko, J. (1997). Using student-built algorithm animations as learning aids. In SIGCSE ’97: Proceedings of the 28th SIGCSE Technical Symposium on Computer Science Education, (pp. 25–29). New York, NY, USA: ACM Press. Stasko, J., Badre, A., & Lewis, C. (1993). Do algorithm animations assist learning?: an empirical study and analysis. In CHI ’93: Proceedings of the SIGCHI Conference on Human Factors in Computing Systems, (pp. 61–66). New York, NY, USA: ACM Press. Urquiza-Fuentes, J. (2008). Generaci´ on Semiautom´ atica de Animaciones de Programas Funcionales con Fines Educativos. Ph.D. thesis, Dept. de Lenguajes y Sistemas Inform´ aticos I, Universidad Rey Juan Carlos. Urquiza-Fuentes, J., & Vel´azquez-Iturbide, J. (2007). An evaluation of the effortless approach to build algorithm animations with WinHIPE. Electronic Notes in Theoretical Computer Science, 178 , 3–13. Vel´ azquez-Iturbide, J., Pareja-Flores, C., & Urquiza-Fuentes, J. (2008). An approach to effortless construction of program animations. Computers & Education, 50 (1), 179–192. Vel´ azquez-Iturbide, J., P´erez-Carrasco, A., & Urquiza-Fuentes, J. (2008). SRec: an animation system of recursion for algorithm courses. In ITiCSE ’08: Proceedings of the 13th Annual Conference on Innovation and Technology in Computer Science Education, (pp. 225–229). New York, NY, USA: ACM. Virtanen, A., Lahtinen, E., & J¨arvinen, H.-M. (2005). VIP, a visual interpreter for learning introductory programming with C++. In Proceedings of the Fifth Koli Calling Conference on Computer Science Education, (pp. 125–130).
24