users: for instance as of January 2011, Facebook counts more than 500 millions .... The task of identifying potential customers plays a key role in marketing research ... broad range of activities like: (i) to affiliate to groups, (ii) to declare to join ...
Finding similar users in Facebook Pasquale De Meo1, Emilio Ferrara2, Giacomo Fiumara1 1
Department of Physics, Informatics Section, University of Messina, Italy
2
Department of Mathematics, University of Messina, Italy
ABSTRACT Online social networks are rapidly asserting themselves as popular services on the Web. A central point is to determine whether two distinct users can be considered similar, a crucial concept with interesting consequences on the possibility to accomplish targeted actions like, for example, political and social aggrega tions or commercial promotions. In this chapter we propose an approach in order to estimate the similarity of two users based on the knowledge of social ties (i.e., common friends and groups of users) existing among users, and the analysis of activities (i.e., social events) in which users are involved. For each of these indicators, we draw a local measure of user similarity which takes into account only their joint behaviours. After this, we consider the whole network of relationships among users along with local values of similarities and combine them to obtain a global measure of similarity. Such a computation is carried out by applying the Katz coefficient, a popular parameter introduced in Social Science research. Finally, similarity values produced for each social activity are merged into a unique value of similarity by applying linear regression.
1 INTRODUCTION Online social networks like Facebook, My Space, YouTube or Linkedin are rapidly emerging as one of the most popular services on the Web. These systems are able to capture a significant portion of Web users: for instance as of January 2011, Facebook counts more than 500 millions active users and about 50% of active users log on to Facebook in any given day1. Facebook users are allowed to publish online profiles describing both demographic data (e.g., place and date of birth) as well as interests. In addition, users may be involved in a large number of social activities like getting in touch with other people and creating friendship relationships with them, create groups with
1
See http://www.facebook.com/press/info.php?statistics.
1
the goal of raising public awareness on political or social themes, sponsoring an event or declaring to par ticipate to it and so on. A central problem in this scenario is to determine whether two users can be considered similar. A tool capable of correctly identifying similar users is advantageous for many purposes. We can, in fact, identify people who share the same political and social ideas and suggest them to form groups in such a way to better promote and plead their causes. We can suggest new possible friendships to users in some way connected by common interests, activities, etc. We can find out in a social crowd, people who can possibly form groups representing a threat for the society because sharing extremist views in particular contexts, such as terrorism, criminal behaviours, etc. We could predict the connections and the interactions which are likely to occur in the near future among similar users [Liben-Nowell & Kleinberg, 2007] . From a commercial standpoint, the identification of groups of users tied by shared interests would be beneficial to promote and diffuse new technologies as well as to advertise commercial products [Kleinberg, 2008]. The problem of identifying the similarity among users has received a strong attention in many fields of Computer Science (thinks of Recommender Systems [Resnick & Varian, 1997] or User Modelling [Kobsa, 2001]) but it is still largely unexplored in the context of very large social networks like Facebook. We can put into evidence two research lines devoted to detect similarities between pairs of users. The first research line is based on social relationships (especially friendship relationships) existing among users in order to determine whether they are similar [Geyer, Dugan, Millen, Muller & Freyne, 2008, Spertus, Saham & Buyukkokten, 2005]. Similarity derives from two different and competing factors [Crandall, Cosley, Huttenlocher, Kleinberg & Suri, 2008]: social influence [Friedkin, 1998], according to which individuals adopt behaviors exhibited by those individuals they interact with, and homophily [Lazarsfeld & Merton, 1954, Mcpherson, Lovin & Cook, 2001], i.e., the tendency of individuals to create relationships with other individuals who are similar to them. Similarity can express along a broad range of dimensions like age, ethnicity, gender, religion and job. Extensive empirical research shows strong evidence of homo phily in real contexts [Currarini, Jackson & Pin, 2009]; for instance, a study on 12,067 people carried out between 1971 and 2003 indicated that a person has a high chance of being obese if her friends are obese too [Christakis & Fowler, 2007]. In online social networks like Facebook, friendship relationships are still a reliable indicator of similarity between two users but they are not enough. In fact, since the number of users of an online social network is typically huge, if we would select at random a pair of users, there would be a high chance they do not
2
know each other. Selected users would be automatically recognized as not similar. Such a conclusion may be wrong because the two users may share, for instance, the same religious or political convictions and, then, a form of similarity between them could be envisaged. A second category of approaches relies on the idea that, if two users participate/carry out to the same activities, then a form of similarity exists between them [de Gemmis, Lops, Semeraro & Basile, 2008, De Meo, Quattrone & Ursino, 2010]. In particular, information associated with user activities contributes to form a profile capable of describing her preferences and needs. The similarity between two users is then computed as the similarity of their profiles. However, as pointed out in [Golder & Huberman, 2006 ], in online social networks user profiles are generally poor and sparse and, then, the process of computing user similarities may be not accurate [De Meo, Quattrone & Ursino, 2010, Zanardi & Capra, 2008]. In this chapter we propose an hybrid approach, i.e., an approach that leverages both on the knowledge of social ties existing between users and the analysis of the activities in which they are involved. Our approach is structured in three stages:
•
We first propose a range of parameters to compute similarities among Facebook users. We consider various type of activities that a user can carry out: like becoming friends, declaring to join a group, declaring to participate to an event and so on. Given a particular activity like the activity of creating a friendship relationship, we consider the sets F(u1) and F(u2) consisting of friends of u1 and u2 on Facebook and compare them to determine the degree of similarity between u1 and u2. In order to make such a comparison we could use appropriate tools like the Jaccard similarity coefficient [Sokal & Sneath, 1963, Han & Kamber, 2006]. At the end of this stage, we are able to associate each pair of users with an array. Each of the components of the generated array represents the degree of similarity between u1 and u2 according to a specific user activity. As a consequence, our approach for computing similarity is multi-dimensional because we manage one value of similarity for each activity we consider.
•
The procedure outlined above to compute similarities makes only use of local knowledge, i.e., it considers only the joint behaviour of two users to decide to what extent they can be regarded as similar.
3
Local knowledge may produce rough and inaccurate similarity evaluations. To better clarify this concept, let us consider a simple example. In particular, let us focus only on friendship relationships and let us consider again the users u1 and u2 introduced above and assume they are University students enrolled in the same track but in different Universities. In such a case, a form of similarity between them can be envisaged even if they are not likely to share any friend and, then the Jaccard similarity coefficient of F(u1) and F(u2) is zero. This drawback can be solved by applying a more refined notion of similarity. In particular, for any given user activity, we propose to map the space of Facebook users onto a graph. Vertices in the graph represent users while edges specify that the two users are somewhat tied according to the specific actions we are considering: for instance, if our reference action is friendship, an edge between two nodes may specify that the corresponding users share at least a particular number of friends. In our reference graph, a path joining two nodes specifies that there exists an indirect chain of relationships between the end-points of the path itself and, then, any path carries in a contribution useful to compute user similarity. We propose to use the whole ensemble of paths running between two nodes to compute the similarity of the corresponding users. To this purpose, we use a popular parameter introduced in Social Science called Katz coefficient [Katz, 1953].
•
In the third stage we propose some strategies to merge all the similarity scores into a single and global value which is then used to determine the final degree of similarity among users.
The plan of the chapter is as follows: in Section 2 we cover the background about related problem providing a comparison of our approach with similar or related ones. In Section 3 we describe in the detail our approach for computing user similarities. In Section 4 we illustrate the experiments we carried out to val idate it and, finally, in Section 5 we draw our conclusions.
2 BACKGROUND AND RELATED WORK In the context of online social networks, the problem of detecting whether two users are similar has re ceived a limited attention until now. Approaches for computing user similarities fall into three main categories, namely: (i) Approaches relying on social relationships, (ii) Approaches based on the analysis of social activities and (iii) Approaches to identifying potential customers.
4
Our approach is hybrid, in the sense that it combines both the features of approaches relying on social re lationships and the features of approaches based on the analysis of social activities. In the following subsections we shall illustrate the main features of each category and, for each category, we highlight the main similarities and differences with our approach.
2.1 APPROACHES RELYING ON SOCIAL RELATIONSHIPS A first category of approaches is based on social relationships existing among users. In many cases, this information is instrumental in producing suggestions (e.g., friendship relationships or affiliation to new communities). In particular, the approach of [Spertus, Saham & Buyukkokten, 2005] analyzes the affiliation of users to multiple virtual communities and suggests them if it is worth or not joining new communities. To this purpose, their approach considers Orkut, a big social network, as reference scenario and experimentally compares the effectiveness of a range of techniques to compute user similarities (e.g., tf-idf coefficient or parameters coming from Information Theory). The AboutMe system [Geyer, Dugan, Millen, Muller & Freyne, 2008] is able to complete the profile a user u by examining the list of topics used by his acquaintances in a social network. Resulting profiles are more accurate and ultimately, they are relevant to enhance user participation in social activities. The approach of [Groh & Ehmig, 2007] suggests to use the friendship lists to identify resources relevant to them. In particular, this approach handles the friendship list of a user u and the ratings of the users of these lists assigned with an object o to predict the rating that u would assign to o. Approaches relying on social relationships are able to achieve a high level of accuracy in generating their suggestions (see [Geyer, Dugan, Millen, Muller & Freyne, 2008 ,Groh & Ehmig, 2007] for an experi mental analysis). In addition, these approaches are less plagued by problems like cold start. The effectiveness of these approaches, however, crucially depends on the number of social relationships created by users. In fact, if a user is involved in few friendship relationships, the information at disposal are poor and, then, the quality of suggestions will be inevitably poor. Our approach merges the analysis of social relationship with further type of information (for instance, the affiliation to groups or the participation to events). This kind of information is a precious and reliable in -
5
dicator to assess whether two users are similar or not even if they do not know directly: for instance, we can envisage a particular form of similarity between two users if they, driven by shared political or social motivations, decide to join an event even if no friendship relationship exists between them.
2.2 APPROACHES BASED ON THE ANALYSIS OF SOCIAL ACTIVITIES Approaches belonging to this category rely on the idea that if two users participate to the same activities, then a form of similarity exists between them. In particular, information associated with a user contributes to form a profile capable of describing her preferences and needs. The similarity between two users is then computed by taking into account the similarity of their profiles. In [de Gemmis, Lops, Semeraro & Basile, 2008] the authors consider the tags applied by users to classify resources and provide a generative probabilistic model to build their profile. [Pazzani & Billsus, 1997] use a number of machine learning techniques (like Bayesian classifiers or decision trees) to analyze Web pages accessed by the user and build her profile. In [De Meo, Quattrone & Ursino, 2010] the authors pro pose to analyze semantic relationships between tags applied by users to classify folksonomy resources and use these tags to enrich user profiles. Our approach, like those described in this section, considers the activities that the users of a social net work can carry out and it mainly focuses on the affiliation to groups or the participation to events. By contrast, approaches illustrated in this section, rely on activities like tagging [de Gemmis, Lops, Semeraro & Basile, 2008, De Meo, Quattrone & Ursino, 2010] or browsing [Pazzani & Billsus, 1997]. The analysis of user activities provides useful elements to generate accurate and complete profiles. On the contrary, in Web 2.0 scenario, the so-called power law phenomenon emerges [Golder & Huberman, 2006]. Due to the power law phenomenon, a large fraction of users is characterized by a low level of participation in community activities. In such a case, the information about a user is in general poor and the process of computing user similarities may incur in some inaccuracies. Our approach overcomes the drawbacks outlined above because it integrates information regarding user activities with information about social relationships created by a user.
2.3 APPROACHES TO IDENTIFY POTENTIAL CUSTOMERS The task of identifying potential customers plays a key role in marketing research and e-commerce [Ro mano, 2000; De Meo, Rosaci, Sarnè, Terracina & Ursino, 2003] . In fact, enterprises may identify customers with similar needs and consuming behaviours and group them (customer segmentation). Customer segmentation is useful to better point out customer demands and to plan suitable commercial strategies to
6
satisfy them. A product of interest to a given customer c can be advertised and proposed to all the other customers of the same group of c; on the long run, the identification of potential customers enables enterprises to attract and keep valuable customers (Romano, 2000). Our research efforts are strongly tied with those in the area of customer identification. In fact, the task of finding similar users is useful to augment the likelihood that a specific person is interested in a commer cial product given that such a product has been appreciated by other customers similar to her. In this section we briefly review the main techniques to identify potential customers and discuss how they are related to our research. Many of the existing approaches define a set of features able to describe the customer behaviour; for instance, relevant examples of features are the customer profitability (i.e., the difference between the revenues earned from and the costs associated with the customer relationship in a specified period) an the customer loyalty (i.e., the tendency of a customer to stay with a specific brand) (Wan, Xiaopeng, Liquan, 2010). The indices can be equally relevant or not; in the latest case, an importance matrix IM is defined. The generic entry IM[i,j] specifies the relative importance of the feature i against the feature j. Once data about customers have been gathered and mapped onto a vector features, a clustering algorithm is usually applied; customers belonging to the same clusters are recognized as similar. A popular option is to use the K-Means algorithm (Han & Kamber, 2006). In (Wan, Xiaopeng, Liquan, 2010), the authors showed that the usage of genetic algorithms can lead to a meaningful improvement in clustering accuracy; however, approaches based on genetic algorithms are computationally more expensive and an analysis of their scalability on large datasets is still missing. We address the reader to (Sotiropoulos, Tsihrintzis, Savvopoulos & Virvou, 2005) in which the authors experimentally compare the performance of three clustering algorithms (i.e., hierarchical clustering, fuzzy k-means and spectral clustering) on data about customers of an e-commerce Websites.
3 COMPUTING SIMILARITY SCORES BETWEEN USERS In this section we describe our approach for computing similarities among Facebook users. In the follow ing we shall denote as U = { u1, u2,…, un } the space of Facebook users and ux will indicate the generic user.
3.1 BASIC SIMILARITY MEASURES
7
As pointed out in the Introduction, in online social networks like Facebook, friendship relationships are a reliable indicator of similarity between two users but they can not be enough to produce satisfactory res ults. Friendship relationships can be augmented with other sources of knowledge in order to detect user simil arities in a more accurate fashion. Specifically, as for Facebook users, they are usually involved in a broad range of activities like: (i) to affiliate to groups, (ii) to declare to join events, (iii) to declare to be fan of a Web page, and so on. We propose to analyze some of these activities and use this knowledge to determine user similarities. More formally, each user activity in Facebook will be denoted as Atype where type specifies the kind of activity. For instance, possible activities are AF (indicating that two users become friends), AG (indicating that a user decides to join to a group), AE (specifying that a user has declared to participate to an event) and AP (specifying that a user has declared to be fan of a page). In the following we shall denote as Ai a generic user activity. For each activity Ai and for a given pair of users ux and uy we can define a similarity measure (called Ai -similarity) σAi (ux,uy) between ux and uy according to the activity Ai; it takes a pair of users ux and uy and, depending on the nature of Ai, it returns a numerical value representing the degree of similarity between ux and uy. Intuitively, σAi(.,.) must be symmetric, i.e., σAi (ux,uy) = σAi (uy,ux). Definitions 1, 2, 3 and 4 illustrate how to compute user similarity when the activities we consider are AF, AG, AE and AP. Definition 1.Let ux and uy be a pair of Facebook users. Let F(ux) (resp., F(uy)) be the set of friends of ux (resp., uy). The F-similarity between ux and uy is defined as:
σF(ux,uy)= J(F(ux),F(uy)) where J(.,.) is the Jaccard similarity coefficient between F(ux) and F(uy), i.e.: J(F(ux),F(uy)) =
∣ F ux ∩ F uy ∣ ∣F ux ∪ F uy ∣
The Jaccard similarity coefficient is symmetric and it returns values in [0,1]. In particular, the higher the value of J(F(ux),F(uy)) is, the more similar ux and uy are. In an analogous fashion we can consider different type of activities to define other similarity measures. This is encoded in Definition 2.
8
Definition 2 Let ux and uy be a pair of Facebook users. Let:
1. G (ux) (resp., G (uy)) be the set of groups to which ux (resp., uy) is affiliated to. 2. E (ux) (resp., E (uy)) be the set of events to which ux (resp., uy) has declared to participate. 3. P(ux) (resp., P(uy)) be the set of pages to which ux (resp., uy) has declared to be fan. The G-similarity, the E-similarity and the P-similarity between ux and uy are defined as:
1. σG(ux,uy)= J(G(ux),G(uy)) 2. σE(ux,uy)= J(E(ux),E(uy)) 3. σP(ux,uy)= J(P(ux),P(uy)) where J(.,.) is the Jaccard similarity coefficient.
3.2 SIMILARITIES BASED ON KATZ COEFFICIENT At the end of the previous step we were able to obtain information about user similarities by taking into account activities in which they were jointly involved. Such a knowledge, as shown in the Introduction, could not be enough in real cases. To overcome this drawback, we use some ideas successfully applied in the context of Social Network and Computer Science literature [Jeh & Widom, 2002, Leicht, Holme & Newman, 2006]. In particular, some approaches represent objects and their relationships as graphs and introduce the notion of regular equivalence [White & Reitz, 1983, Borgatti & Everett, 1992, Doreian, 1999], which is largely accepted in the literature to detect the similarity of a pair of objects. According to regular equivalence theory, two objects are recognized as similar if they are connected to objects which are similar themselves.
A popular example of regular equivalence is provided by the Katz coefficient [Katz, 1953]. In order to illustrate how the Katz coefficient works and how it can be adjusted to compute similarities among Facebook users, we need the following definition: Definition 5. Let U be the space of Facebook users, let Ai be a user activity and ϕAi a real parameter in [0,1]. The Ai - induced graph GAi = is an undirected graph such that: (i) there is a node nxAi ∈ NAi for each user ux ∈ U and (ii) there is an edge exyAi= linking nxAi and nyAi if σAi > ϕAi.
9
The graph GAi stores the whole set of relationships among Facebook users according to the user activity Ai. The parameter ϕAi is necessary to cut off weak forms of correlation between users. Intuitively, it plays the same role of minimum support in association rule learning in the sense that ϕAi allows to filter out relationships among users which are not statistically significant. For instance, if we would consider “friendship” as user activity, we would be able to build a graph GF which depicts friendship relationships among users and the nodes representing two users ux and uy will be linked if the number of friends that ux and uy share is large enough. To introduce the Katz coefficient, we first consider only friendship relationships; we shall extend later our ideas to other type of user activities. According to the definition of Katz coefficient, two users ux and uy are recognized as similar if there is a large number of users who, in their turn, are similar to both ux and uy; in particular, given a user ux, we consider the neighborhoods of ux , i.e., the set of friends of ux. For an arbitrary friend of ux, say uy, we consider his similarity with ux; we repeat this operation for all friends of ux and sum all similarity values. More concretely, let AF be the adjacency matrix of GF, i.e. the matrix such that AF[x,y] = 1 if there is an edge between the nodes representing ux and uy and 0 otherwise; the Katz similarity coefficient σFK(ux,uy) of ux and uy is proportional to:
σFK(ux,uy) ≈ Σ AF[x,i] σFK(ui,uj)
(1)
In addition, we consider a special case, known as self-similarity, in which users ux and uy may coincide. In such a case , we increase σFK(ux,uy) by adding a bonus. In particular, the bonus is proportional to δxy, being δxy the Kronecker symbol (i.e., δxy = 1 if ux and uy coincide and 0 otherwise) and this allows to complete Equation (1) as follows:
σFK(ux,uy) = α Σ AF[x,i] σFK(ui,uj) + (1- α )δxy
(2)
Here α is a weighting coefficient ranging in [0;1]. Equation (2) can be rewritten in a more interesting fashion by introducing matricial notation. In particular, let S be the similarity matrix, i.e., S[x,y] =
σFK(ux,uy) and let I be the identity matrix. With this notation, Equation (2) can be rewritten as : S = α AF S + (1- α )I
(3)
With some simple manipulations, Equation (3) is equivalent to: S - α AF S = (1- α )I
→ (I - α AF ) S = (1- α )I → S = (1- α )(I - α AF )-1I
(4)
Finally, the term (I - α AF )-1 can be developed by applying the so-called Neumann series [Stewart, 1998]: (I - α AF )-1 = I+α AF + α2 AF 2 + α3 AF 3 + α4 AF4 +......(5)
10
Equation (5) is quite interesting. In fact, the element AFi[x,y] represents the number of paths of length i joining nodes nx and ny in GF. As a consequence, the computation of the Katz coefficient of two nodes (and, then, of the corresponding users) requires to compute all paths, of any arbitrary length joining the two nodes. Each path carries in a contribution and the longer a path is, the weaker its contribution is. More formally, the Katz-similarity of ux and uy can be re-defined as follows: ∞
σ (ux,uy) = K F
∑ β l np nx,ny,l
(6)
l= 0
where β is a real parameter ranging in (0,1) and np(nx,ny,l) is a function returning the number of paths of length l running from nx to ny . Efficient techniques (e.g., iterative algorithms) have been proposed to quickly compute the Katz coeffi cient [Leicht, Holme & Newman, 2006]. In addition, experimental trials show that it usually provides more accurate results than simple Jaccard similarity coefficient. The procedure we outlined above can be extended to all other user activities we want to consider. As a fi nal result, a similarity measure between two users can be introduced for each activity we consider.
3.3 COMPUTING A GLOBAL SIMILARITY SCORE At the end of the previous stage we were able to associate each pair of users with n coefficients σA1K,
σA2K , …, σAnK, each of them representing the similarity between ux and uy according to the generic activity Ai. Each of these values represents a partial indicator of similarity between two users and they can be combined to obtain more accurate indications about the actual similarity of ux and uy. Therefore, we suggest to combine the values σA1K, σA2K , …, σAnK to produce a global similarity value. In its general form, the global similarity σ can be defined as a weighted mean of σA1K, σA2K , …, σAnK:
σ = α1 σA1K + α2σA2K + …+ αΚσAnK Here α1 , α2 , …, αΚ are weighting coefficients which specify the relative importance of each similarity value. We used two strategies to define these coefficients. In the former strategy, a user can decide, according to his personal needs, the values of weighting coeffi cients. Such an option is useful for expert users who can decide which factor influences in the most relevant fashion user similarity; for instance, in a specific application context, a user may decide that friend ship actions are more relevant than other actions in defining global similarity; these users can, therefore,
11
assign a large value to the weighting coefficient corresponding to the similarity value computed on the friendship graph and, at the same time, a low value for all remaining weighting coefficients. By contrast, the latter strategy targets novice users and, in general, it is suitable in all cases in which no similarity value appears to dominate other ones. In such a case, we suggest to learn a function f which takes σA1K, σA2K , …, σAnK as input and returns a number in [0,1] as output. The problem of determining f can be regarded as a binary classification problem. In this chapter we used linear regression to determine f [Bishop, 2006]. In particular, let σ = [σA1K, σA2K , …, σAnK] be an n-th dimensional array whose i-th component stores the i-th value of similarity σAiK, the function f can be written as: f(σ) = wTσ Here w = [ w1,w2, …,wn] is an n-th dimensional array of weights which must be determined and wT is the transpose of w. The weights w1,w2, …,wn are computed by applying the least square error principle. To this purpose, we assume that a set y’ of similarity values provided by a human expert (training set) is available and we determine the weights w in such a way as to minimize: ||y’- f(σ) || = || y’ - wTσ|| being ||. || the traditional Euclidean norm. Once we get the weights, we are able to compute the global sim ilarity score of two users. If the obtained score exceeds a threshold, we may conclude that two users are similar.
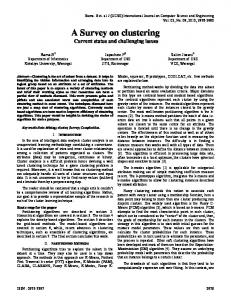
4 EXPERIMENTAL RESULTS 4.1 PROTOTYPE DESCRIPTION We built a Java prototype to experimentally validate the effectiveness of our system. The architecture of our system is graphically shown in Figure 1.
12
Fig. 1 Software architecture of our system.
Our system consists of three layers: •
Data Layer.
•
Processing Layer.
•
Interface Layer.
The Data Layer is in charge of crawling Facebook, extracting publicly available data and persistently store them. In particular, the Data Layer generates a Sesame repository2. Sesame is an open source frame2
http://www.openrdf.org/
13
work for storage, inferencing and querying of RDF data. The Sesame repository is queried by applying SPARQL; retrieved data are used to populate a MySQL database. The Data Layer has been implemented by using the public APIs offered by Facebook. Processing Layer interacts with Data Layer to extract data about Facebook users. In particular it first implements suitable Java methods to extract data about user contact list, affiliation to groups and so on. Extracted information are used to feed JESS engines, each of them capable of computing basic similarities illustrated in Section 3.1 as well as similarities based on the Katz coefficient described in Section 3.2. JESS 3 is a rule engine and scripting environment written entirely in Java. JESS allows to easily build software applications capable of “reasoning” by exploiting knowledge supplied in the form of declarative rules. Finally, the interface layer implements a Java GUI enabling human users to interact with our system in a user-friendly fashion.
4.2 EXPERIMENTAL VALIDATION: A CASE STUDY In our experiments we crawled a large portion of Facebook users and retrieved about 25,000 user profiles. For each user we extracted her list of friends, the list of groups she is affiliated to, the list of groups she joined in the past and, finally, the list of pages she declared to be fan. After this we extracted a sample of users referring to the same domain. In particular, we selected about 1800 users who were University students. Some statistics about selected users are reported in Table 1. Parameter Minimum / Average / Maximum Number of Friends Minimum / Average / Maximum Number of Groups Minimum / Average / Maximum Number of Events Minimum / Average / Maximum Number of Fan
Value 4 / 110 / 2,540 0 / 90 / 332 1 / 163 / 750 1 / 103 / 250
Table 1 Some statistics about the dataset used in our experiments
We considered the following four activities:
1. AF: friendship relationships. 2. AG: affiliation to groups. 3. AE: participation to events. 3
www.jessrules.com
14
4. AP: declarations to be fan of Web pages. For each of these actions we obtained four similarity values, i.e., σF, σG, σE and σP . As a preliminary test, we are interested in determining whether “positive” forms of associations exist between σF, σG, σE and σP. For instance, we are interested in checking whether users who share a large number of friends also decide to affiliate to the same groups and whether users who joined the same groups also declared to participate to the same events. Such an analysis is quite interesting; in fact, if a positive correlation would emerge, we could conclude that multiple indicators agree on establishing a form of similarity between users. We applied Ordinary Least Square (OLS) regression to analyze the correlation of σF, σG, σE and σP and, an detail, we computed the R2 coefficient. The corresponding results are shown in Table 2.
σF σG σE σP
σF 1 0.785 0.812 0.794
σG 0.785 1 0.826 0.818
σE 0.812 0.826 1 0.795
σP 0.794 0.818 0.795 1
Table 2 Values of R2 for σF, σG, σE and σP
Reported results indicate a positive correlation between σF, σG, σE and σP variables. Such a result agrees with some fact already known in sociology and, in particular, in the research field of affiliation networks [Wasserman & Faust,1994]. An affiliation network can be essentially regarded as bipartite graph such that a first group of nodes represents real users while the second group represents social events. For instance, an affiliation network may represent researchers (who play the role of users) and the conferences they attended (which play the role of social events). Affiliation networks are useful to disclose relationships between social network actors: for instance, if two researchers attended the same conferences, then we may hypothesize that a tie exists between them. Our analysis extends this intuition. In fact, data repor ted in Table 2 suggest us to augment the notion of social event and to give it a wider meaning; as a consequence, a tie between two users exists if they join the same groups, attend the same events or declare to be fan of the same Web page. If we would consider just one of these dimensions (e.g., if we would restrict our attention only to the participation to events), it could happen that the information at our disposal would be poor and, then, the process of deciding if two users are somewhat tied would be affected by in accuracies. The power of our method is to consider a range of social facts to compensate the lack of knowledge in one of them.
15
As for the assessment of user similarity, it requires the validation of human expert (who is in charge of providing the “ground truth”). Due to the need of manually labelled data, we considered only a small fragment of our dataset which is however sufficient to show the effectiveness of our approach. In particular, we focused on a real use case in which five real users are considered. The users were student enrolled in a Computer Science track. Due to privacy reasons, we shall denote them as A, B, C, D and E. Each student knew each other; in addition, in Table 3 we report the matrix of similarities between users reported by the expert. In particular, the entry at the i-th row and the j-th column reports a symbol “X” (resp, “o”) if the expert recognized the i-th and i-th users are (resp., are not) similar. The matrix is clearly symmetric and all elements on the main diagonal are marked with X because each user is recognized as similar to himself.
User / User A B C D E
A X X X o o
B X X X o o
C D X o X o X o o X o o
E o o o o X
Table 3 User-User similarity matrix provided by human expert
4.3 PERFORMANCE METRICS We defined two criteria in order to evaluate the performances of the system and to measure its reliability. Given a generic similarity measure σ 4, its performance can be assessed by means of two metrics:
•
Misclassification error E1: it counts the percentage of times two users are recognized as similar by our system while they are actually not similar according to the expert opinion.
•
Misclassification error E2: it counts the percentage of times two users are recognized as not similar by our system while they are actually according to the expert opinion.
Clearly, both E1 and E2 range in [0,1] and the lower they are the better a similarity measure works.
4
Here σ can denote both a basic similarity measure and a similarity measure relying on the Katz coefficient
16
4.4 PERFORMANCE ANALYSIS OF BASIC SIMILARITY MEASURE We computed basic similarities between each pair of users. The obtained results were normalized to the real interval [0,1]; if the normalized score exceeded a threshold, we classified the two users as similar. We first consider a default value for the threshold equal to 0.5 and, after this, we briefly show how its value impacted on system performance. In the first experiment we apply the basic similarity measures σF, σG, σE and σP introduced in Section 3.1. For each similarity measure σt with t ∈{F,G,E,P}, we fixed a threshold ϕ a pair of users exceeded ϕ
t
t . If the similarity score σt of
, we recognized the corresponding pair of users as similar. The value of
was initially set equal to 0.5 x (Mt + mt), being Mt (resp., mt) being the highest (resp., lowest) similt arity score returned by σt. The scores achieved by each measure are reported in Tables 4, 5, 6 and 7.
ϕ
User / User A B A 1 1 B 1 1 C 1 1 D 1 1 E 1 1
C D 1 1 1 1 1 1 1 1 1 1
E 1 1 1 1 1
Table 4 User-User similarity matrix provided by AF activity
User / User A B C D E
A 0.120 0.131 0.034 0.035
B 0.120 0.096 0.053 0.063
C 0.131 0.096 0.037 0.045
D 0.034 0.053 0.037 0.050
E 0.035 0.063 0.045 0.050 -
Table 5 User-User similarity matrix provided by AG activity
17
User / User A B C D E
A 0.182 0.182 0.014 0.020
B 0.182 0.113 0.054 0.058
C 0.182 0.113 0.015 0.015
D 0.014 0.054 0.015 0.105
E 0.020 0.058 0.015 0.105 -
Table 6 User-User similarity matrix provided by AE activity
User / User A B C D E
A B C D 0.051 0.075 0.075 0.051 0.058 0.014 0.075 0.058 0.014 0.075 0.014 0.014 0.006 0 0.015 0
E 0.006 0 0.015 0 -
Table 7 User-User similarity matrix provided by AP activity
From the analysis of these tables we can observe that:
1. The analysis of AF activity is not effective to compute similarities because all users are recognized as similar even if this is not actually true. This supports our initial claim about the fact that friendship relationships may not be enough to determine similarity.
2. As for AG activity, the similarity computation achieves the best performance. However, the similarity between B and E and B and D is quite large and close to the threshold we fixed to decide about user similarity. This demands a higher level of robustness in deciding about user similarit ies.
3. As for AE activity, users D and E are recognized as similar while the expert assumed they were not similar.
4. As for AP activity, we observe that similarity computation achieves results comparable with those of obtained in AG activity. However, the values it returns are quite low and close each other. As a further experiment, we investigate how the threshold we use to decide about user similarity influences the performance of our system. Due to space limitations we considered just the E activity because it
18
presented the worst performance. In Figure 2 we plot E1 and E2 when the threshold varied between 0.1 and 0.9.
Fig. 2 Impact of threshold on E1 and E2 (E activity)
Figure 2 shows that the choice of threshold has a high impact on system performance. In particular, for low values of threshold (which implies that a large number of similarities are recognized) E1 achieves its highest values (e.g., it equals 0.45 if the threshold equals 0.1). This means that our system tends to overestimate similarities. If the threshold increases, E1 decreases while E2 tend to be constant and equal to 0. When the threshold exceeds 0.5, E1 continues decreasing while E2 increases. In other words, if the threshold exceeds 0.5, our system gets more and more “restrictive” and the number of pairs of users recognized as similar decreases. On the one hand, this behaviour produces a decrease of E1 (because some false similarities are no longer detected) but, on the other hand, it yields an increase of E2 (because some pairs of users who are truly similar are not recognized as similar). We achieve a break-even point when the threshold is 0.7.
4.5 PERFORMANCE ANALYSIS OF KATZ COEFFICIENT As a second experiment we are interested in determining if the Katz coefficient is able to provide better performances than basic similarities. To make an objective comparison, we fixed a threshold value ran ging from 0.1 to 1 and, if the value of the Katz coefficient of two users exceeded this threshold, the users were recognized as similar.
19
In Figures 3, 4 and 5 we show the performance of the Katz coefficient when AG, AE and AP activities are considered. The analysis of these figures shows that, even in presence of small networks, the Katz coeffi cient is able to significantly outperform basic similarity measures (for instance, the E1 achieved by the Katz coefficient is up to 33% less than that achieved by basic similarity measures). In addition, both E1 and E2 are small until β is less than 0.5. This depends on the fact that for large values of β we would associate excessively large relevance to long paths. In addition, from Figures 3, 4 and 5, it emerges that if β is low, then E2 is larger than E1. In fact, if β is low, our system essentially relies on local information and it discards information coming from paths containing more than one edge. As a consequence, some pairs of users are recognized as not similar even if they are actually similar.
Fig. 3 Katz similarity for E1 and E2 (AG activity)
Fig. 4 Katz similarity for E1 and E2 (AE activity)
Fig. 5 Katz similarity for E1 and E2 (AP activity)
20
An opposite behaviour emerges if β is high: in such a case the contribution of long paths is relevant and some pairs of users are recognized by our system as similar even if they are actually not similar. As a consequence, we get the best trade-off between E1 and E2 when β ∈ [0.4,0.5].
4.6 ANALYSIS OF REGRESSION APPROACH A final experiment has been carried out to assess if our global similarity score produces better results than single similarity measures. To this purpose, we computed the value of E1 and E2 achieved by our system when the β parameter ranges from 0 to 1. The corresponding results are shown in Figure 6.
Fig. 6 E1 and E2 when global score is computed
From the analysis of this figure we can observe that the usage of a global score based on linear regression achieves results which are better than those achieved by each single action. In fact, the misclassification error E1 is almost close to 0, i.e., users who are recognized as similar by our system are always similar according to user opinion. In addition, our system is also robust because variations in β parameter do not affect the value of E1. As for E2, it ranges from 0.1 to 0.6 and the worst value achieved by E2 when the global score is computed is about 25% lower than the worst value achieved by each single action. In such a case, weights used to compute global score are able to partially correct errors produced by each single activity. Finally, when β ≈ 0.2, our system achieves the best performances in terms of both E1 and E2.
4.7 DISCUSSION OF EXPERIMENTAL RESULTS 21
In this section we briefly summarize the main findings of our experimental trials. In particular, •
The usage of a unique criterium (e.g. friendship) to compute user similarity may lead to wrong conclusions. To this purpose the usage of multiple criteria proved to be effective in correcting potential biases induced by a unique criterium.
•
The usage of the Katz coefficient leads to a more accurate computation of similarity degree in comparison with the Jaccard coefficient. In fact, the Jaccard coefficient considers only the neighborhood of two users and compare them to define a similarity score. The Katz coefficient, by contrast, considers all potential paths linking two users to determine their similarity degree.
•
The performance of the Katz coefficient depends on the value of the β parameter. In particular, low values of β imply that we neglect the contributions carried in by long paths joining two users; by contrast, high values of β imply that long paths have a high impact in similarity computation. Experiments show that the best trade-off is achieved when β is around 0.4-0.5.
•
The combination of multiple similarity scores by means of regression was able to yield accurate results. In other words, there are some similarity criteria which lead to an overestimation of the similarity degree; by contrast, there are other criteria which tend to underestimate the similarity degree. Linear regression is able to compensate these two effects and yields a more accurate computation of similarity.
5 CONCLUSIONS In this chapter we presented a novel approach to the problem of measuring the similarity among Face book users. Our approach handles a variety of interactions carried out by users (e.g., the friends they share, the events they declared to participate, the groups they decided to join and so on). For each of these activities we analyzed joint user behaviours and, by applying the Jaccard similarity coefficient, we computed a similarity value. After this, we suggested to map the space of Facebook users onto multiple weighted graphs and each graph corresponds to one of the social activity we considered: for instance, we built a graph to represent friendship relationship, a graph to model the co-participation to events and so on. We used each of these graphs to compute the level of similarity between two users. To this purpose, we applied the Katz coefficient, a popular parameter introduced in Social Science. Finally, the similarity values we obtained are merged by applying linear regression to generate a unique similarity score. In the future we plan to extend our research by designing mechanisms capable of using similarities among users in order to suggest to a user other users with whom he can profitably interact or to discover to which a user can affiliate. A further research direction consists of extending the range of social activities
22
currently considered in our approach. For instance, we could handle the textual comments the users post and apply on them text mining techniques (like, for instance, techniques developed in the context of opinion or sentiment mining). This would be a precious tool to better detect user preferences and needs and, by aggregating these data on a large scale, we would be able to detect new trends. A final application scenario is to harness the power of social networks (and, in particular, of Facebook) to create novel ap plications in a range of domains like e-recruitment [De Meo, Quattrone, Terracina & Ursino, 2007] or elearning [De Meo, Garro, Terracina & Ursino, 2003]. For instance, in the case of e-recruitment, we could search the space of social network users to find the best candidates for a given position or, alternatively, to form teams working on a specific project. Analogously, in the case of e-learning, we could sift through a social network to find users with the same educational needs/goals or background and we could form well matched and homogeneous virtual classrooms in such a way as to enhance the outcomes of learning processes. Acknowledgements The authors would heartily thank Santo Curreri for his invaluable contribution in implementing the prototype presented in this chapter.
REFERENCES Borgatti, S.P. & Everett, M.G. (1992). Notions of Position in Social Network Analysis. Sociological Methodology, 22(1):1-35. Bishop, C.M. (2006). Pattern Recognition and Machine Learning (Information Science and Statistics). Springer-Verlag New York, Inc. Christakis, N. A. & Fowler, J.H., (2007). The Spread of Obesity in a Large Social Network over 32 Years. New England Journal of Medicine, 357(4):370-379. Crandall. D, Cosley D., Huttenlocher D., Kleinberg J. & Suri S. (2008), Feedback effects between similarity and social influence in online communities. In Proc. of the ACM SIGKDD international conference on Knowledge discovery and Data Mining (SIGKDD '08), pages 160-168, Las Vegas, NV, USA, ACM Press. Currarini, S., Jackson, M. & Pin, P. (2009). An Economic Model of Friendship: Homophily, Minorities and Segregation. Econometrica, 77(4):1003-1045. de Gemmis, M., Lops, P., Semeraro, G. & Basile, P. (2008). Integrating tags in a semantic content-based recommender. In Proc. of the ACM conference on Recommender Systems (RecSys '08), pages 163-170. ACM Press.
23
De Meo, P., Garro, A., Terracina, G. & Ursino, D. (2003). X-Learn: an XML-based, multi-agent system for supporting “user-device” adaptive e-learning. In Proc. of the International Conference on Ontologies, Databases and Applications of Semantics (ODBASE 2003), pages 739-756, Taormina, Italy. Lecture Notes in Computer Science, Springer. De Meo, P., Rosaci, D., Sarnè, G., Terracina, G. & Ursino, D. (2003). An XML-Based Adaptive Multiagent System for Handling E-commerce Activities. Proc. of the International Conference on Web Services (ICWS-Europe 2003), pages 152-166, Erfurt, Germany. De Meo, P., Quattrone, G., Terracina, G. & Ursino, D. (2007). An XML-based Multi-Agent System for Supporting Online Recruitment Services. IEEE Transactions on Systems, Man ad Cybernetics - Part A, 37(4):467-480, 2007. De Meo, P., Quattrone, G. & Ursino, D. (2010). A query expansion and user profile enrichment approach to improve the performance of recommender systems operating on a folksonomy. Journal of User Modelling and User Adapted Interactions, 20(1):41-86. Doreian, P. (1999). An intuitive introduction to blockmodeling with examples. Bulletin de Methodologie Sociologique, 61(1):5-34. Friedkin, N. (1998), A Structural Theory of Social Influence. Cambridge University Press. Geyer, W., Dugan, C., Millen, D.R., Muller, M. &. Freyne, J. (2008). Recommending topics for selfdescriptions in online user profiles. In Proc. of the ACM conference on Recommender Systems (RecSys '08), pages 59-66, Lausanne, Switzerland. Golder, S.A. & Huberman, B.A. (2006). Usage patterns of collaborative tagging systems. Journal of Information Science, 32(2):198-208. Groh, G. & Ehmig, C. (2007). Recommendations in taste related domains: collaborative filtering vs. social filtering. In Proc. of the International ACM conference on Supporting Group Work (GROUP '07), pages 127-136 Han, J. & Kamber, M. (2006). Data Mining: Concepts and Techniques - Second Edition. Morgan Kaufmann Publishers. Jeh, G. and Widom, J. (2002). SimRank: a measure of structural-context similarity. In Proc. of the ACM SIGKDD International Conference on Knowledge Discovery and Data Mining (SIGKDD'02), pages 538543, Edmonton, Alberta, Canada. Katz, L. (1953). A new status index derived from sociometric analysis. Psychometrika, 18(1):39-43. Kleinberg, J. (2008). The convergence of social and technological networks. Communications of the ACM, 51(11):66-72
24
Kobsa, A. (2001). Generic user modeling systems. User Modeling and User-Adapted Interaction, 11:4963, 2001. Lazarsfeld, P., and R. K. Merton. (1954). Friendship as a Social Process: A Substantive and Methodological Analysis. In Freedom and Control in Modern Society, Morroe Berger, Theodore Abel, and Charles H. Page, eds. New York: Van Nostrand, 18–66 Leicht, E.A., Holme, P. & Newman, M.E.J. (2006). Vertex similarity in networks. Physical Review Part E, 73(2):026120. Liben-Nowell, D. & Kleinberg, J. (2007). The link-prediction problem for social networks. Journal of the American Society for Information Science and Technology, 58(7):1019-1031. Mcpherson, M., Lovin, S. L. & Cook, J. M. (2001). Birds of a Feather: Homophily in Social Networks. Annual Review of Sociology, 27(1):415-444. Pazzani, M. & Billsus, D. (1997). Learning and Revising User Profiles: The Identification of Interesting Web Sites. Machine Learning, 27(3):313-331. Resnick, P. & Varian, H.R. (1997). Recommender systems. Communications of the ACM, 40(3):56-58. Sokal, R.R. & Sneath, P.H.A. (1963). Principles of numerical taxonomy. W. H. Freeman and Co., San Francisco, CA. Spertus, E., Sahami, M. & Buyukkokten, O. (2005). Evaluating similarity measures: a large-scale study in the orkut social network. In Proc. of the ACM SIGKDD international conference on Knowledge discovery in data mining (KDD '05), pages 678-684. ACM Press. Stewart, G.W. (1998). Matrix Algorithms: Basic Decompositions (Volume 1). Society for Industrial Mathematics. Wasserman, S. & Faust, K. (1994). Social Network Analysis: Methods and Applications. Cambridge University Press. White, D.R. & Reitz, K.P. (1983). Graph and semigroup homomorphisms on networks of relations. Social Networks, 5(2):193-234. Zanardi, V. & Capra L. (2008). Social Ranking: Uncovering Relevant Content Using Tag-based Recommender Systems. In Proc. of the International Conference on Recommender Systems (RecSys 2008), pages 51-58, Lausanne, Switzerland. ACM Press.
KEY TERMS & DEFINITIONS Facebook: A social networking Web site launched in February 2004. Facebook users can add people as friends and send them messages, and update their personal profiles to notify friends about themselves.
25
Homophily: The tendency of individuals to associate and create personal relationships with similar individuals. Graph: A data structure used to model a set S of objects and relationships occurring between pairs of objects belonging to S.
Jaccard Coefficient: A parameter used for comparing the similarity and diversity of sample sets. Given two sets A and B, Jaccard coefficient is defined as the size of the intersection of A and B divided by the size of their union. Katz Coefficient: A coefficient, introduced in sociology, to assess the degree of closeness of two nodes in a social network. Linear Regression: A statistical approach to modeling the relationship between a variable y and several variables x1, x2, …, xn. Social network: A structure consisting of individuals (or organizations) called “nodes” or “actors” which are connected by one or more specific types of relationships like friendships.
26