Hindawi Publishing Corporation Spectroscopy: An International Journal Volume 27 (2012), Issue 5-6, Pages 265–272 doi:10.1155/2012/374039
Phosphorus Compartmentalization on the Cellular Level of Douglas Fir Root as Affected by Mn Toxicity: A Synchrotron-Based FTIR Approach Tanja Duˇci´c,1 J¨urgen Thieme,2 and Andrea Polle3 1
Hasylab, DESY, Notkestrasse 85, 22607 Hamburg, Germany NSLS-II, Brookhaven National Laboratory, Upton, NY 11973, USA 3 Department for Forest Botany and Tree Physiology, B¨usgenweg 2, 37077 G¨ottingen, Germany 2
Correspondence should be addressed to Tanja Duˇci´c,
[email protected] Copyright © 2012 Tanja Duˇci´c et al. This is an open access article distributed under the Creative Commons Attribution License, which permits unrestricted use, distribution, and reproduction in any medium, provided the original work is properly cited. Abstract. We investigated distribution of phosphorus under manganese toxicity in different tissues of 10 µm thin-root cross-section of Douglas fir (DF) (Pseudotsuga menziesii) seedlings by using synchrotron-based Fourier transform infrared microscopy (SR-FTIR) as a chemically sensitive imaging method. Manganese is an essential micronutrient in all organisms but may become toxic when present in excess. We found previously that DF variety glauca (DFG) and variety menziesii (DFM) differed in phosphorus uptake, subcellular localization, transport and tissue allocation, as an effect of manganese toxicity. To address the role of P in seedling tolerance under Mn toxicity, we determined P allocation in different root tissues. In DFG, but not in DFV, the P concentration was kept at a constant level even under Mn toxicity. Earlier X-ray microanalysis showed Mn accumulation in epidermal and cortical cells of both varieties after Mn treatment, suggesting that the root endodermis was a barrier for Mn to protect the vascular system and shoot from high Mn, with possible role of P ameliorations. Here, we discuss the potential role of P in Mn compartmentalization and toxicity tolerance in two different varieties. Keywords: Synchrotron-based FTIR, plant tissue, phosphorus, manganese toxicity
1. Introduction Manganese (Mn) is an essential nutrient element necessary for activation of a wide range of enzymes. To fulfil its metabolic functions, Mn is only required at low concentrations. Plant availability of Mn depends on soil properties, mostly pH, and on root exudates for Mn chelation or reduction. In general, excess Mn causes disorders of normal plant metabolism. Therefore, Mn-homeostasis on the cellular level is strictly regulated [1]. Two main varieties of Douglas fir (Pseudotsuga menziesii) var. menziesii (DFM) and P. menziesii var. glauca (DFG) differ in Mn sensitivity, that is, DFG but not DFM showed symptoms of Mn toxicity, when exposed to excess Mn [2, 3].
266
Spectroscopy: An International Journal
Our previous results revealed different transport and translocation properties of Mn into different subcellular compartments for the two varieties of Douglas fir [1, 3]. The Mn-resistant variety DFM showed Mn retention in the root system and entrapment of Mn in electron-dense precipitates (“black bodies”), containing extremely high Mn concentrations, together with Ca and P [2]. In contrast to the DFM, the Mn-susceptible variety transported a higher fraction aboveground to photosynthetically active tissues [3]. Beside these differences, DFG and DFM also vary in P accumulation within the plant tissues. Phosphorus-limited DFM, but not DFG, seedlings were less Mn-susceptible [2]. This suggests that P plays an important role in mediating Mn tolerance. However, the tissue distribution of phosphorus in response to Mn stress is not known. To address P localization in roots tissues under conditions of Mn stress, we performed the synchrotron-based FTIR analyses on thin-root cross-section. Synchrotron-based FTIR spectromicroscopy is a useful tool for imaging the organic compounds in different cells, without any staining/labeling or cutting artifacts, as shown before [4–6]. The contrast of this imaging technique is based on the local density of vibrational states characteristic for functional molecular groups [7]. Synchrotron radiation is certainly the most useful source for IR, as it is a “white” source with a flat broadband distribution over the entire infrared spectral range (from far-IR to near-IR) [8]. The high brightness compared to conventional laboratory sources [8, 9] opens up the opportunity to combine the highest spectral resolution with a spatial resolution at the diffraction limit [7, 8]. 2. Material and Methods 2.1. Sample Preparation Plants were grown hydroponically in standard medium, containing two different Mn concentrations in Mn2+ form (as described in [2]). In short, 2-weeks-old seedlings were exposed for two additional weeks to 5 μM Mn (control) or 5 mM Mn (Mn2 SO4 ). After 2 weeks, plants were sampled for analyses. Roots tips, from intact seedlings, were rapidly frozen in a tissue freeze medium (Leica 020108926, Jung, Germany) loaded in 5 mm-long gelatin capsules and cooled with liquid nitrogen to −196◦ C. Frozen blocks 5 mm behind the root tip were directly cut with a cryomicrotome (Reichert-Jung, Model 2800 Frigocut N). Ten μm cross-sections were mounted on the MirrIR low-e microscope slides for reflective infrared studies without interfering absorption in the range from 4000 to 400 cm−1 (Kevley Technologies, USA), freeze-dried at −70◦ C for two days, and adjusted to room temperature by increasing the temperature slowly up to 20◦ C during the next two days. The specimens were stored in a desiccator over silica gel at room temperature. 2.2. Synchrotron-Based FTIR Analysis The FTIR measurements were carried out at the FTIR spectromicroscopy station of ID21 at European Synchrotron Radiation Facility (ESRF) synchrotron facility. The IR spectromicroscopic maps were collected in reflection mode using an Infrared microscope (Thermo Nicolet Nexus) coupled to a FTIR spectrometer (Thermo Nicolet Continuum). The IR microscope is equipped with a motorized sample stage and a liquid nitrogen cooled mercury cadmium telluride (MCT) detector. Most of the analysis and maps were collected with a pixel size of 5 × 5 μm2 and step size of 2 μm, and each spectrum was acquired with 64 accumulations at 4 cm−1 spectral resolution.
Spectroscopy: An International Journal
267
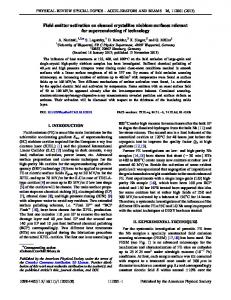
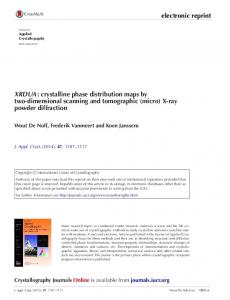
3. Results Areas of 300 μm × 300 μm were mapped in DFG and DFM root tissues with full high resolution, and spectra were recorded for each pixel by the SR-FTIR spectromicroscope. Data was collected on a freezedried sample in reflection mode, at the settings described above. 2D images can then be generated for all relevant FTIR absorption lines by representing the spectral characteristics of region of interest, such as fingerprint peak areas of the molecular groups on a colour scale. The phosphate and/or phosphine oxide (Pi) groups in the spectra show strong bands at around 1100 cm−1 . Two bands may be associated with the asymmetric and symmetric PO−2 stretching bands at 1236 and 1086 cm−1 , respectively, the first with CH2 scissor vibration or the CH3 asymmetric bend vibration [10]. On the other hand, FTIR bands around 1100–1000 cm−1 in some plants contributed also by alcoholic and polysaccharide compounds present in the tissues [11]. Figures 1(A), 1(a), 1(D) and 1(d) shows the 2D and 3D images of control and Mn-exposed DFM root cross-sections, generated for phosphate and phosphine oxide groups (a strong band at 1100 cm−1 associated with P–O bonds of phosphate), respectively. The scanning regions of interest (ROI) were chosen to include the central cylinder, endodermis, cortex, and epidermis to acquire the spectromicroscopic maps, based on the inline (coaxial) visible light optical microscope Figures 1(B) and 1(b). Cumulative FTIR absorption spectra of a 10 μm cross-sections of root tip of a control and a Mn-treated DFM plant are shown in Figures 1(C) and 1(c), respectively. Mn-treated plants showed P accumulation in the cortical, endodermal, and central cylinder cells, besides the epidermis as in control plants. The band at 1270 cm−1 , which has been assigned to guaiacyl lignin [12] was also dominant in spectra of both Mn- and un-treated plants. Lignin bands at 1265 cm−1 and 1311 cm−1 are very pronounced since lignin content in wood is around 20% [13]. Towards higher wavenumbers, the next pronounced features in the spectra are the amide I and amide II absorption bands, exhibiting peaks at 1656 and 1550 cm−1 , respectively, corresponding to vibrations of the protein backbone [8]. The integrated peak intensity of the amide bands can serve as a measure for the local protein concentration. The peaks indicative of proteins are superimposed by cellulose since there are very close to the cellulose peak at 1635 cm−1 [5]. Figure 2 shows the Pi groups 2D and 3D images generated from FTIR absorption lines, for control and Mn-treated DFG plants (A, a, D, and d, resp.). The scanning regions of interest (i.e., central cylinder, endodermis, cortex, and epidermis as for DFM analysis (Figure 1)) are based on the inline visible light optical microscope (Figures 2(B) and 2(b)). Cumulative FTIR absorption spectra of a 10 μm crosssections of root tip of control and treated plant DFG plant show very similar P distribution in the entire root tissues, that is, Mn stress did not affect P compartmentalization (Figures 2(C) and 2(c)).
4. Discussion Synchrotron-based FTIR microscopy study of thin cross-section of root tissues of DF is presented in this study. The emphasis was on phosphorus mapping by using FTIR spectromicroscopy. Up to now, only a few in situ studies of elemental distributions in DF samples have been performed, mainly by electron microscopy-based X-ray microanalysis (EDX) [2, 14]. While electron microscopy requires
268
Spectroscopy: An International Journal 2.3
2.3
Position (micrometers)
11100
12750 12700 12650 12600
11050
11000
10950
0 9400 9450 9500 9550 9600 Position (micrometers)
0 22150 22200 22250 Position (micrometers)
(A)
(a)
12900 11200
12850
11150 Position (micrometers)
Position (micrometers)
12800 12750 12700 12650 12600
11100 11050 11000 10950 10900
12550
22300
22250
22200
Position (micrometers)
22150
22100
9600
9550
9500
9450
9400
10850
Position (micrometers) (B)
(b)
2 1.5 1 0.5 3800 3600 3400 3200 3000 2800 2600 2400 2200 2000 1800 1600 1400 1200 1000
Abs
0.6 0.4 0.2 0 3800 3600 3400 3200 3000 2800 2600 2400 2200 2000 1800 1600 1400 1200 1000
Abs
Position (micrometers)
12800
(cm−1 )
(cm−1 )
(C)
(c)
Figure 1: Continued.
Spectroscopy: An International Journal
269
1 0.4
2 1.6 1
(D)
rs)
22160 itio
11000
(m icr
Pos
n (m
22200 22260
icro
10860
met
sit io n
12620
11100 11060
Po
112720 12700 1270 12640
(m Po ic sit ro io m n et er s)
8400 8460 8500 (m Positi icro on 8560 me 8600 ters )
om ete
1.6
log (1/R)
log (1/R)
2
ers)
(d)
Figure 1: ((A), (a)) Synchrotron-based FTIR microscopy of 10 μm-thick freeze-dried roots cross-section of Douglas fir var. menziesii of control and 5 mM Mn-treated plants, respectively. The scanned regions of interest for the spectromicroscopy maps were chosen from online visible microscopic pictures (marked with the red rectangle in (B), (b)). An area was mapped with full high-resolution spectra in each pixel. 2D ((A), (a)) and 3D ((D), (d)) images were generated for the absorption line of phosphorus group (P=O, phosphate and phosphine oxide) at 1100 cm−1 . The cumulative FTIR absorption spectra of freeze-dried roots sections as recorded in reflection mode by the SR-FTIR spectromicroscope of ID21 at ESRF are shown in (C) and (c).
invasive sample preparation, typically including fixation before thin slicing of the sample, FTIR can provide spectra without risk of changing the cell organization by chemical fixation. FTIR spectromicroscopy clearly revealed Pi peaks in the roots of DFM (Figure 1) and DFG (Figure 2). This distribution correlates well with Mn compartmentalization after synchrotron-based Xray fluorescence analysis (data not shown). FTIR analysis, which shows Pi-compounds maps in entire cross-sections of roots, provides a better overview of the total P locations (Figures 1 and 2). After Mn stress, phosphorus redistribution towards central cylinder was found in DFM (Figure 1), but not in the susceptible variety DFG (Figure 2). DFG seedlings kept a uniform distribution of P across all root tissues, in control as well as in Mn-treated plants. The redistribution of P after Mn stress, which was only observed in roots of DFM, has likely enhanced the Mn tolerance of this variety since P relocation in the tissues probably binds the surplus Mn, and in this way protects the vascular system and shoot from Mn toxicity. Notably FTIR spectromicroscopy infers information on protein secondary structure by averaging locally over all proteins in the excitation volume. The spatial distribution of the proteins at 1635 cm−1 , which is distinctly different from that one of lipids, is superimposed on the cellulose peak (Figures 1(C), 1(c), 2(C), and 2(c)). The observed positions of the amide band peaks were predominantly due to beta-sheet conformations, and they differ in DFM and DFG as well as in response to Mn treatment. Differences are also observed at the following wavenumbers: at 1245 cm−1 , where they originate from C–O–H asymmetric deformation vibration of hemicellulose and cellulose [5], then at 1420 cm−1 , which is associated with C–H bends from asymmetric CH3 group of cellulose, lipids and polysaccharides, as well as at 1740 cm−1 , from C=O stretching alkyl group of esterified pectins and lipids. The symmetric
270
Spectroscopy: An International Journal 1.8 2.4 Position (micrometers)
Position (micrometers)
16500 16450 16400 16350 16300 16250
2700 2650 2600 2550 2500 0 1100
−5950
−6000
−6050
−6100
−6150
−6200
−6250
0 1200 1300 Position (micrometers)
1400
Position (micrometers) (a)
Position (micrometers)
16650 16600 16550 16500 16450 16400 16350 16300 16250 16200 16150 16100
2750 2700 2650 2600 2550 2500 2450 1000
−6350 −6300 −6250 −6200 −6150 −6100 −6050 −6000 −5950 −5900 −5850
Position (micrometers)
(A)
1100 1200 1300 1400 Position (micrometers)
Position (micrometers) (b)
1.8 P 1.6 1.4 1.2 1
Abs
2 1.5 3800 3600 3400 3200 3000 2800 2600 2400 2200 2000 1800 1600 1400 1200 1000
1
3800 3600 3400 3200 3000 2800 2600 2400 2200 2000 1800 1600 1400 1200 1000
Abs
(B)
(cm−1 )
(cm−1 )
(C)
(c)
Figure 2: Continued.
Spectroscopy: An International Journal
271
log(1/R)
2
1 0.6
0 −8260 −8200 −8160 −8100 (m Posi icr tio −8060 om n −8000 ete rs) (D)
18600 18400 18200
(m Pos icr iti om on ete rs)
log(1/R)
1.6
1.6
1 0.4 1060 1100 1160 1200 P (m os 1260 icr itio 1300 om n 1360 ete rs)
2700 2660 2600 on s) 2560 iti ter 2500 Pos me o icr (m (d)
Figure 2: ((A), (a)) Synchrotron-based FTIR microscopy of 10 μm-thick freeze-dried roots cross-section of Douglas fir var. glauca of control and 5 mM Mn-treated plants, respectively. The scanned regions of interest for the spectromicroscopy maps were chosen from online visible microscopic pictures (marked with the red rectangle in (B), (b)). An area was mapped with full high-resolution spectra in each pixel. 2D ((A), (a)) and 3D ((D), (d)) images were generated for the absorption line of phosphorus group (P=O, phosphate and phosphine oxide) at 1100 cm−1 . The cumulative FTIR absorption spectra of freeze-dried roots sections as recorded in reflection mode by the SR-FTIR spectromicroscope of ID21 at ESRF are shown in (C) and (c).
and asymmetric CH2 stretching of lipid bands at 2850 and at 2925 cm−1 , respectively [5] also changes after Mn treatment in DFM and DFG, which is underlying the complex changes of all biomolecules on the cellular level in both varieties under Mn stress. Acknowledgments The authors thank to Dr. Margaret Rak for FTIR microscopy introduction and critical reading of the paper, Dr. Andrea Olbrich for helpful suggestions during the sample preparation and Christine Kettner for the plants growing. The European Synchrotron Radiation Facility (ESRF) in Grenoble is acknowledged for beam time allocation and excellent working conditions. References [1] T. Duˇci´c and A. Polle, “Transport and detoxification of manganese and copper in plants,” Brazilian Journal of Plant Physiology, vol. 17, no. 1, pp. 103–112, 2005. [2] T. Duˇci´c and A. Polle, “Manganese toxicity in two varieties of Douglas fir (Pseudotsuga menziesii var. viridis and glauca) seedlings as affected by phosphorus supply,” Functional Plant Biology, vol. 34, no. 1, pp. 31–40, 2007. [3] T. Duˇci´c, L. Leinemann, R. Finkeldey, and A. Polle, “Uptake and translocation of manganese in seedlings of two varieties of Douglas fir (Pseudotsuga menziesii var. viridis and glauca),” New Phytologist, vol. 170, no. 1, pp. 11–20, 2006.
272
Spectroscopy: An International Journal
[4] L. P. Choo, D. L. Wetzel, W. C. Halliday, M. Jackson, S. M. LeVine, and H. H. Mantsch, “In situ characterization of β -amyloid in Alzheimer’s diseased tissue by synchrotron Fourier transform infrared microspectroscopy,” Biophysical Journal, vol. 71, no. 4, pp. 1672–1679, 1996. [5] K. M. Dokken and L. C. Davis, “Infrared imaging of sunflower and maize root anatomy,” Journal of Agricultural and Food Chemistry, vol. 55, no. 26, pp. 10517–10530, 2007. [6] T. Duˇci´c, S. Quintes, K. A. Nave et al., “Structure and composition of myelinated axons: a multimodal synchrotron spectro-microscopy study,” Journal of Structural Biology, vol. 173, no. 2, pp. 202–212, 2011. [7] M. Diem, M. Romeo, C. Matth¨aus, M. Miljkovic, L. Miller, and P. Lasch, “Comparison of Fourier transform infrared (FTIR) spectra of individual cells acquired using synchrotron and conventional sources,” Infrared Physics and Technology, vol. 45, no. 5-6, pp. 331–338, 2004. [8] P. Dumas and M. J. Tobin, “A bright source for infrared microspectroscopy: synchrotron radiation,” Spectroscopy Europe, vol. 15, no. 6, pp. 17–23, 2003. [9] W. D. Duncan and G. P. Williams, “Infrared synchrotron radiation from electron storage rings,” Applied Optics, vol. 22, no. 18, pp. 2914–2923, 1983. [10] M. Szczerbowska-Boruchowska, P. Dumas, M. Z. Kastyak et al., “Biomolecular investigation of human substantia nigra in Parkinson’s disease by synchrotron radiation Fourier transform infrared microspectroscopy,” Archives of Biochemistry and Biophysics, vol. 459, no. 2, pp. 241–248, 2007. [11] Z. He, J. Mao, C. W. Honeycutt, T. Ohno, J. F. Hunt, and B. J. Cade-Menun, “Characterization of plant-derived water extractable organic matter by multiple spectroscopic techniques,” Biology and Fertility of Soils, vol. 45, no. 6, pp. 609–616, 2009. [12] D. Fengel and G. Wegener, Wood, Chemistry and Ultrastructure and Reactions, Kassel, Ramagen, Germany, 2003. [13] R. Rana, R. Langenfeld-Heyser, R. Finkeldey, and A. Polle, “FTIR spectroscopy, chemical and histochemical characterisation of wood and lignin of five tropical timber wood species of the family of Dipterocarpaceae,” Wood Science and Technology, vol. 44, no. 2, pp. 225–242, 2010. [14] T. Duˇci´c, D. Berthold, R. Langenfeld-Heyser, F. Beese, and A. Polle, “Mycorrhizal communities in relation to biomass production and nutrient use efficiency in two varieties of Douglas fir (Pseudotsuga menziesii var. menziesii and var. glauca) in different forest soils,” Soil Biology and Biochemistry, vol. 41, no. 4, pp. 742–753, 2009.


![arXiv:0810.3813v1 [physics.atm-clus] 21 Oct 2008 - pubdb - Desy](https://m.moam.info/img/260x300/arxiv08103813v1-physicsatm-clus-21-oct-2008-pubdb-_5c3a0e6b097c47e4218b469d.jpg)


![arXiv:1210.8393v1 [math.QA] 31 Oct 2012 - desy pubdb](https://m.moam.info/img/260x300/arxiv12108393v1-mathqa-31-oct-2012-desy-pubdb_5c940b28097c47a57c8b465c.jpg)