â Siemens VDO Automotive AG ... assistance in an intelligent automotive cockpit environment. The .... one of the two classes âobjectâ (yi ⥠0) and ânon-objectâ.
A System for Traffic Sign Detection, Tracking, and Recognition Using Color, Shape, and Motion Information Claus Bahlmann∗ , Ying Zhu∗ , Visvanathan Ramesh∗ ∗ Siemens
Corporate Research, Inc. 755 College Road East Princeton, NJ 08540, USA {claus.bahlmann,yingzhu,visvanathan.ramesh}@siemens.com
Abstract— This paper describes a computer vision based system for real-time robust traffic sign detection, tracking, and recognition. Such a framework is of major interest for driver assistance in an intelligent automotive cockpit environment. The proposed approach consists of two components. First, signs are detected using a set of Haar wavelet features obtained from AdaBoost training. Compared to previously published approaches, our solution offers a generic, joint modeling of color and shape information without the need of tuning free parameters. Once detected, objects are efficiently tracked within a temporal information propagation framework. Second, classification is performed using Bayesian generative modeling. Making use of the tracking information, hypotheses are fused over multiple frames. Experiments show high detection and recognition accuracy and a frame rate of approximately 10 frames per second on a standard PC.
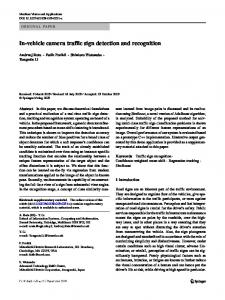
I. I NTRODUCTION In traffic environments, signs regulate traffic, warn the driver, and command or prohibit certain actions. A real-time and robust automatic traffic sign recognition can support and disburden the driver, and thus, significantly increase driving safety and comfort. For instance, it can remind the driver of the current speed limit, prevent him from performing inappropriate actions such as entering a one-way street, passing another car in a no passing zone, unwanted speeding, etc. Further, it can be integrated into an adaptive cruise control (ACC) for a less stressful driving. In a more global context, it can contribute to the scene understanding of traffic context (e.g., if the car is driving in a city or on a freeway). In this contribution, we describe a real-time system for vision based traffic sign detection and recognition. We focus on an important and practically relevant subset of (German) traffic signs, namely speed-signs and no-passing-signs, and their corresponding end-signs, respectively. A few sign examples from our dataset are shown in Figure 1. The problem of traffic sign recognition has some beneficial characteristics. First, the design of traffic signs is unique, thus, object variations are small. Further, sign colors often contrast very well against the environment. Moreover, signs are rigidly
Martin Pellkofer† , Thorsten Koehler† † Siemens
VDO Automotive AG Osterhofener Str. 19, Business Park 93055 Regensburg, Germany {martin.pellkofer,thorsten.koehler}@siemens.com
Figure 1: Examples of traffic signs. Note that data are available in color. positioned relative to the environment (contrary to vehicles), and are often set up in clear sight to the driver. Nevertheless, a number of challenges remain for a successful recognition. First, weather and lighting conditions vary significantly in traffic environments, diminishing the advantage of the above claimed object uniqueness. Additionally, as the camera is moving, additional image distortions, such as, motion blur and abrupt contrast changes, occur frequently. Further, the sign installation and surface material can physically change over time, influenced by accidents and weather, hence resulting in rotated signs and degenerated colors. Finally, the constraints given by the area of application require inexpensive systems (i.e., low-quality sensor, slow hardware), high accuracy and real-time computation. II. R ELATED WORK Related work can be found in machine learning, general object detection and intelligent vehicle literature. A. Machine learning and object detection In recent years, the performance of many object detection applications has received a boost by the “Viola-Jones” detector [11], an approach that discriminates object from non-object image patches with help of machine learning techniques. Its main idea is to generate an over-complete set of (up to 100000) efficiently computable Haar wavelet features, combine them with simple threshold classifiers, and utilize AdaBoost [9] to select and weight the most discriminative subset of wavelet features and threshold classifiers. Supported by an efficient wavelet feature computation with help of the so-called integral image and a cascaded classifier setup, those systems were
shown to be able to solve many practical problems in realtime [12, 14].
The vast majority of published traffic sign recognition approaches utilizes at least two steps, one aiming at detection, the other one at classification, that is, the task of mapping the detected sign image into its semantic category. Regarding the detection problem, several different approaches have been proposed. Among those, a few rely solely on gray-scale data. Gavrila [5] employs a template based approach in combination with a distance transform. Barnes and Zelinsky [1] utilize a measure of “radial symmetry” and apply it as a pre-segmentation within their framework. Since radial symmetry corresponds to a simplified (i.e., fast) circular Hough transform, it is particularly applicable for detecting possible occurrences of circular signs. A hypothesis verification is integrated within the classification. The authors report very fast processing with this method. The majority of recently published sign detection approaches make use of color information [2, 3, 6, 7, 10, 13]. They share a common two-step strategy. First, a presegmentation is employed by a thresholding operation on the individual author’s favorite color representation. Some authors perform this directly in RGB space, others apply linear or nonlinear transformations of it. Subsequently, a final detection decision is obtained from shape based features, applied only to the pre-segmented regions. Researchers use, for instance, corner [3] or edge [13] features, genetic algorithms [2], or template matching [10]. An active vision strategy is pursued by Miura et al. [6], where a second camera is used to get a high resolution image of the pre-segmented region. The drawback of this sequential appliance of color and shape detection is as follows. Regions that have falsely been rejected by the color segmentation, cannot be recovered in the further processing. A joint modeling of color and shape can overcome this problem. Additionally, color segmentation requires the fixation of thresholds, mostly obtained from a time consuming and error prone manual tuning. A joint treatment of color and shape has been proposed by Fang et al. [4]. The authors compute a feature map of the entire image frame, based on color and gradient information, while incorporating a geometry model of signs. Still, their approach requires a manual threshold tuning, and it is reported to be computationally rather expensive. For the classification task, most systems utilize techniques from the inventory of well studied classification schemes, such as, template matching [1, 6], multi-layer perceptrons [3, 10], radial basis function networks [5], Laplace kernel classifiers [7], etc. A few approaches employ a temporal fusion of frame based detections to obtain a more robust overall detection [8]. This, however, requires some sort of tracking framework. The contribution of this paper in the context of the above reviewed literature is two-fold. It describes (i) an integrated approach for color and shape modeling for general object
(a,b) h
B. Traffic sign recognition
w
Figure 3: Example of a Haar wavelet.
detection applications, without the need of manually tuning thresholds, and, based on this, (ii) a system for a robust and real-time traffic sign detection and recognition. III. T RAFFIC S IGN R ECOGNITION S YSTEM A RCHITECTURE The proposed sign recognition system is founded on a combination of two components. This includes (i) a detection and tracking framework, based on AdaBoost, color sensitive Haar wavelet features, and a temporal information propagation, and (ii) a Bayesian classification with temporal hypothesis fusion. The architecture of this system is illustrated in Figure 2, and its details are given in the following. A. AdaBoost detection and tracking with joint color and shape modeling The detection is addressed by a patch based approach, which is motivated by the work of Viola and Jones [11]. Their approach assigns an image patch xi (taken as a vector) into one of the two classes “object” (yi ≥ 0) and “non-object” (yi < 0) by evaluating ! T X yi = sign αt sign (hft , xi i − θt ) , (1) t=1
with h·, ·i the inner product. The filter masks ft (taken as a vector) usually describe an over-complete set of Haar wavelet filters, which are generated by varying particular geometric parameters, such as, their relative position (a, b), width w and height h (see Figure 3 for an example). An optimal subset of those wavelets, as well as the weights αt and classifier thresholds θt are obtained from the AdaBoost training algorithm [9]. Details are given in the above mentioned references. Novel contribution of the proposed approach is a joint color and shape modeling within the AdaBoost framework, as will be described as follows. For the application of traffic sign recognition, color represents valuable information, as most of the object color is not observed in typical background patterns (e.g., trees, houses, asphalt, etc.). In fact, AdaBoost provides a simple but very effective leverage for this issue, when it is interpreted as a feature selection: Previously, AdaBoost has been used to select (and weight) a set of wavelet features, parameterized by their geometric properties, such as, position (a, b), width w, or height h. Those
Detection & Tracking ... t
t+1
t
t+1 Normalization
...
t+1 t ... Classification
Figure 2: Architecture for the proposed traffic sign recognition system: An algorithm based on AdaBoost and color sensitive Haar wavelet features detects appearances of signs at each frame t. Once detected, objects are tracked, and individual detections from frames (t − t0 , . . . , t) are temporally fused for a robust overall detection. In the figure, this is indicated by the crosslinked arrows. Following, the sign is circularly masked and normalized with respect to position, scale and brightness. Finally, classification is performed based on the Bayesian paradigm, including another temporal hypotheses fusion.
wavelets have been typically applied to patches of gray-scale images. In situations, where color instead of gray-scale information is available, no general guidance exists for choosing, which color representation should be used, or how they could be optimally combined within a linear or nonlinear color transformation. This not only applies to AdaBoost, but is a general matter of disagreement among researchers. At this point, one contribution of this paper applies: If we regard the color representation to be operated on as a free wavelet parameter, side by side to a, b, w, and h, we can achieve a fully automatic color selection within the AdaBoost framework. The variety of the color representations to be integrated are not limited to R, G, and B. We can incorporate prior domain knowledge by adopting linear or non-linear color transformations. One beneficial property of this modeling is that these transformations are only “proposals” to the AdaBoost training. In principle, each combination in color and geometric space can be proposed. The AdaBoost framework is designed to select the most effective and disregard ineffective ones. The variety of the “proposals” is solely limited by the computational and memory resources. For our particular application of traffic sign detection, we propose the following seven color representations: 1) the plain channels R, G, and B, 2) the normalized channels r = R/S, g = G/S, and b = B/S with S = R + G + B, and 3) the gray-scale channel S/3. A result of the AdaBoost training for the traffic signs (the setup will be described in Section IV) is illustrated in Figure 4 by means of the top six (i.e., maximum weighted) wavelets. In other words, those six wavelets correspond to the feature
Figure 4: Top six Haar wavelets of a sign detector from left to right. The pixels below the white areas are weighted by +1, the black area by −1. The here illustrated filter masks are parameterized by their width w, the height h, and relative coordinates a and b. The background “coloring” indicates the color channel the individual features are computed on, in this example corresponding to r, R, G, r, S/3, g.
extractors most significant for the present application. One conclusion is very notable for this example. The most valuable information is selected from the color representations, in this case, r, R, and G, corresponding to the frequently observed red ring in the positive and trees in the negative sample set. This underlines the usefulness of color in the present application. We conclude this section about the detection with a few remarks. As the pursued patch based detection is not scale invariant, different detectors are trained for a number of discrete scales. After detection, an estimate of detected sign parameters (i.e., position (a0 , b0 ) and scale r0 ) can be obtained from the maxima in the response map of respective detectors. Once detected, a sign is tracked using a simple motion model and temporal information propagation. For a more robust detection, we fuse the results of the individual frame based detections to a combined score. More details are given by Zhu et al. [14] in the context of vehicle detection. B. Normalization Based on the estimated sign parameters from the detection, (a0 , b0 , r0 ), the following normalization steps are pursued (cf.
also Figure 2): 1) A circular region with diameter 2r0 is extracted from the sign patch. 2) The image is converted to gray-scale, its brightness is normalized by histogram equalization. 3) The resulting image is scaled to a normalized resolution, in order to be compatible to the classifier. C. Classifier design The classification framework is based on the generative paradigm, employing unimodal Gaussian probability densities. Prior to the probabilistic modeling, a feature transformation is performed, using standard linear discriminant analysis (LDA). In this respect, a feature vector x ∈ R25 of the sign pattern comprises the first 25 most discriminative basis vectors of the LDA. 1) Training: For each class l ∈ {1, . . . , L}, a probability density function p (x|l) is estimated based on a unimodal multivariate Gaussian p (x|l) = Nµ(l) ,Σ(l) (x) , x
(2)
l
�
�
(l) d x(t) , µ(l) x , Σx
��
The priors P (l) can be taken uniformly, or could be chosen to reflect known information about the traffic environment (e.g., city or freeway situation). IV. E XPERIMENTS AND R ESULTS We have performed extensive benchmarking on the above described system, based on 30 minutes of traffic sign video material. The frame resolution in the videos is 384 × 288, typical signs appear in 10–55 pixels diameter. The scenario in the videos includes urban, highway, and freeway traffic, taken during both day and night time. Weather conditions are cloudy and sunny. It should be stated that the data is very difficult as most of the signs appear only in small resolution, that is, smaller than 20 pixels diameter.
x
thus the entire � classifier � is determined by L pairs of mean and (l) (l) covariance µx , Σx . 2) Classification: Given a feature vector x(t) from the test sequence at frame t, a maximum likelihood (ML) approach implies a classification decision ˆl, which is defined by ��o n � � ˆl = argmin d x(t) , µ(l) , Σ(l) (3) x x
and
Probabilistic confidence measures for the classification are provided by means of the posterior probability for each class l′ , � � � p x(t) |l′ P (l′ ) ′ (t) � =P p l |x . (8) (t) l p x |l P (l)
� � �� = − ln p x(t) |l
(4)
The classification performance can further be improved by taking into account �the temporal dependencies. Given a feature � sequence X(t0 ) = x(1) , . . . , x(t0 ) , obtained from the above depicted tracking, the classifier decision can be combined from the observations so far seen. Assuming the statistical independence of x(1) , . . . , x(t0 ) , a combined classification distance is given by ! t0 � � �� � � Y (t0 ) (l) (l) (t) d X , µx , Σx = − ln p x |l t=1
t0 �� � � X (l) (5) d x(t) , µ(l) = x , Σx t=1
From a practical point of view, it can be worthwhile to weight the impact of the individual frames differently, that is, t0 �� � � �� � � X (t) (l) (l) (l) (6) . π d x , µ , Σ = d X(t0 ) , µ(l) , Σ t x x x x t=1
In our preliminary experiments we have chosen πt = at0 −t
(7)
with a < 1. This is motivated from the fact that the traffic signs get bigger in later frames, resulting in a more accurate frame based classification.
A. Individual detection and classification performance In a first experimental setup, we separately evaluate the detection and classification modules, as described in Sections III-A and III-C, respectively. For this, we labeled approximately 4000 positive (out of 23 sign classes) and 4000 negative samples out of the videos. The amount of positive training samples per class varies from 30 to 600. Detectors have been trained on five discrete scales, corresponding to a sign diameter of 14, 20, 28, 40, and 54 pixels. The test data set comprises approximately 1700 positives and 40000 negatives, and is disjoint to the training set. A summary of the results is given in Table I. 1) Detection: The system described above has been evaluated to 1.4 % false negative rate (DFNR, i.e., miss detections) and 0.03 % false positive rate (DFPR, i.e., false alarms). These rates are the mean values of experiments for the five different scales. An interesting question concerns the impact of the proposed color modeling. In this respect, we performed the corresponding experiment, as described above, using only the plain gray-scale color representation (i.e., using only the gray-scale channel S/3). There, a false negative rate 1.6 % was achieved, similar to the color based detection. However, the false positive rate increased to 0.3 %, which is one magnitude higher. This result can be interpreted as a clear indicator for the usefulness of color in traffic sign detection. 2) Classification: For the evaluation of the classification method we used the same disjoint (positive) data sets as described above, scaled to a normalized resolution. Within this framework, the classification error rate (CER) has been evaluated to 6%. Most classification errors result from confusions between similar classes (e.g., “speed limit 60” vs. “speed limit 80”, “speed limit 100” vs. “speed limit 120”) and from low resolution test samples.
Proposed System Proposed System only gray-scale
DFNR 1.4 %
DFPR 0.03 %
1.6 %
0.3 %
CER 6%
SRER 15 %
Table I: Summary of the detection false negative rate (DFNR), false positive rate (DFPR), classification error rate (CER), and the system recognition error rate (SRER). We compare the proposed system (upper row) with a variation of it, where detection is solely based on gray-scale data (lower row). The DFNR are comparable, however, the color based approach leads to 10 times less DFPR. The CER in a patch based classification is 6 % for the proposed system. While the first three error rates are measured from isolated patches and on predefined object scales, the SRER evaluates the whole system performance in the context of entire video sequences including tracking and temporal fusion.
B. Overall system performance In a second evaluation setup, we tested the performance of the entire detection, tracking, and recognition system, as described in Section III. For the notation of “system recognition error rate” (SRER), we count the fraction of traffic signs, that have been misclassified at their last detected appearance in the entire image sequence, or have been missed in the detection. With this convention, we measured 15 % SRER on a video test set disjoint to the training videos, allowing only very few false positive detections (approximately 1 every 600 frames). Notably, the SRER is higher than the combined error of the 1.4 % DFNR and 6 % CER from the individual detection and classification evaluation. An explanation of this fact lies in the discrete nature of the detection scales. In the system evaluation of the previous section, the object size in the test set matches the size the detector is particularly trained for. In the video based performance evaluation, as discussed in this section, object sizes appear on a continuous range. In cases where object size and classifier size differ, the detector needs to extrapolate, leading to a less accurate performance. Figure 5 illustrates examples of correctly and incorrectly recognized signs in various traffic environments. The run time of the entire system is approximately 10 frames per second on a 2.8 GHz Intel Xeon processor. In the context of Equation (1), at most T = 200 Haar wavelets need to be evaluated for the here described results. As we use a cascading-like architecture [11], much less wavelets are computed in average. V. C ONCLUSION We have described a traffic sign detection, tracking, and recognition system, focusing on 23 classes of German speedsigns and no-passing-signs. In an intelligent automotive cockpit environment, such a system could serve as a speed limit reminder for the driver. The system integrates color, shape, and motion information. It is built on two components, that is, a detection and tracking framework, based on AdaBoost and
Haar wavelet features, and a classifier, based on a Gaussian probability density modeling. The main contribution of this paper is a joint modeling of color and shape within the AdaBoost framework. Beside the benefit of the integrated modeling, this approach has the additional advantage that no free parameters have to be tuned manually. The proposed modeling is a generic concept and can find its application in many additional detection problems that are based on color data. In addition, the detection and classification have been augmented by temporal information fusion. By this modeling, the robustness of the recognition system could further be improved. Experiments have shown an accurate sign detection and classification performance with near real-time processing. Further, the impact of the proposed color modeling has been demonstrated in a comparative study. In future work, we want to tackle a number of challenges for further improvement in computational speed and the recognition accuracy. In this respect, we are planning to address the following issues: The incorporation of scene and motion modeling, in combination with projective geometry, can both reduce the computational cost and detection errors. Experiments have shown inferior performance for the detection and classification of objects, the size of which is not exactly covered by one of the detectors. In this sense, we plan to study a fusion in scale space, where detector responses are combined from different scales in a systematic way. R EFERENCES [1] N. Barnes and A. Zelinsky. Real-time radial symmetry for speed sign detection. In IEEE Intelligent Vehicles Symposium (IV), pages 566–571, Parma, Italy, 2004. [2] A. de la Escalera, J. M. Armingol, and M. Mata. Traffic sign recognition and analysis for intelligent vehicles. Image and Vision Computing, 21:247–258, 2003. [3] A. de la Escalera and L. Moreno. Road traffic sign detection and classification. IEEE Trans. Indust. Electronics, 44:848–859, 1997. [4] C.-Y. Fang, S.-W. Chen, and C.-S. Fuh. Road-sign detection and tracking. IEEE Trans. Vehicular Technology, 52(5):1329–1341, Sept. 2003. [5] D. M. Gavrila. Traffic sign recognition revisited. In Mustererkennung (DAGM), Bonn, Germany, 1999. Springer Verlag. [6] J. Miura, T. Kanda, and Y. Shirai. An active vision system for real-time traffic sign recognition. In Proc. IEEE Conf. on Intelligent Transportation Systems (ITS), pages 52–57, Dearborn, MI, 2000. [7] P. Paclik, J. Novovicova, P. Somol, and P. Pudil. Road sign classification using Laplace kernel classifier. Pattern Recognition Lett., 21(13–14):1165–1173, 2000. [8] G. Piccioli, E. D. Micheli, and M. Campani. A robust method for road sign detection and recognition. In Computer Vision—ECCV, pages 495–500. Springer Verlag, 1994.
(a) Correct recognition, urban environment
(b) Correct recognition, freeway environment including variable signs
(c) Correct recognition, night time
(d) A miss detection
Figure 5: Examples of correctly recognized ((a)–(c)) and miss detected (d) traffic signs in different environments. In the image, a detected sign is marked with a red square and some textual information (confidence, object ID, class label) below. The classifier response is shown by the classes icon below the image. The numbers below the signs correspond to the classification confidence. [9] R. E. Schapire. A brief introduction to boosting. In Proc. of the 16th Int. Joint Conf. on Artificial Intell., 1999. [10] J. Torresen, J. W. Bakke, and L. Sekania. Efficient recognition of speed limit signs. In Proc. IEEE Conf. on Intelligent Transportation Systems (ITS), Washington, DC, 2004. [11] P. Viola and M. J. Jones. Robust real-time object detection. Technical Report CRL 2001/01, Cambridge Research Laboratory, 2001. [12] B. Xie, D. Comaniciu, V. Ramesh, T. Boult, and M. Simon. Component fusion for face detection in the presence of heteroscedastic noise. In 25th Pattern Recog-
nition Symposium of the German Association for Pattern Recognition (DAGM), Magdeburg, Germany, 2003. Springer Verlag. [13] M. M. Zadeh, T. Kasvand, and C. Y. Suen. Localization and recognition of traffic signs for automated vehicle control systems. In Proc. SPIE Vol. 3207, Intelligent Transportation Systems, pages 272–282, 1998. [14] Y. Zhu, D. Comaniciu, M. Pellkofer, and T. Koehler. An integrated framework of vision-based vehicle detection with knowledge fusion. In IEEE Intelligent Vehicles Symposium (IV), Las Vegas, NV, 2005.