A Systematic Framework for Battery Performance Estimation Considering Model and Parameter Uncertainties Rong Jing1, Zhimin Xi2, Xiao Guang Yang3, and Ed Decker4 1,2
University of Michigan - Dearborn, Dearborn, MI, 48128, USA
[email protected] [email protected] 3,4
Ford Motor Company, Dearborn, MI, 48121, USA
[email protected] [email protected]
ABSTRACT Up to date, model and parameter uncertainties are generally overlooked by majority of researchers in the field of battery diagnostics and prognostics. As a consequence, accuracy of the battery performance estimation is dominated by the model fidelity and may vary from cell-to-cell. This paper proposes a systematic framework to quantify battery model and parameter uncertainties for more effective battery performance estimation. Such a framework is generally applicable for estimating various battery performances of interest (e.g. state of charge (SOC), capacity, and power capability). Case studies for battery SOC estimation are conducted to demonstrate the effectiveness of the proposed framework. 1. INTRODUCTION Hybrid electric vehicles (HEVs), plug-in hybrid electric vehicles (PHEVs) and electric vehicles (EVs) are gaining popularity in automotive industry. Lithium-ion (Li-ion) battery is the most promising power source for HEVs/PHEVs/EVs due to its light weight, high energy density, and relatively low self-discharge compared to Ni-cad and NiMH batteries. Battery performances of interest, such as state of charge (SOC), capacity and power capability, have been extensively studied due to their importance in real HEVs/PHEVs/EVs applications (Santhanagopalan & White, 2008; He et al., 2012; He et al., 2012). Battery SOC, similar to the remaining gas in the gasoline vehicles, is of particular interest and should be exactly known at any operating time. Unfortunately, the percentage of the charge remaining in the battery, namely the battery SOC, is not a directly measurable quantity and thus should be accurately estimated instead. Rong Jing et al. This is an open-access article distributed under the terms of the Creative Commons Attribution 3.0 United States License, which permits unrestricted use, distribution, and reproduction in any medium, provided the original author and source are credited.
Coulomb counting is the most widely employed method for tracking the SOC provided that the initial SOC is known (Ng et al., 2008). Otherwise, Kalman filter (KF), extended Kalman filter (EKF), and unscented Kalman filter (UKF) (He et al., 2013; Zhang and Pisu, 2014) are typical methods for fast SOC estimation based on various equivalent circuit models of the Li-ion battery (Plett, 2004b). Other methods in machine learning have been recently explored in the SOC estimation and/or degradation parameter (e.g., capacity) estimation (Santhanagopalan and White, 2010; Lee et al., 2011; Andre et al., 2012; Hu et al., 2012; Jun et al., 2012; Orchard et al., 2012; He et al., 2013; Waag and Sauer, 2013; Wang et al., 2013; Xiong et al., 2014; Hu et al., 2014a&b). Five types of uncertainty play a key role for reliable estimation of the battery performances of interest and they can be classified as: i) measurement uncertainty, ii) algorithm uncertainty, iii) environmental uncertainty, iv) model parameter uncertainty, and v) model uncertainty. Measurement uncertainty includes current and voltage measurement error and has been well considered by most researchers. For example, a sensor noise term is typically included in the KF (Han et al., 2009). Algorithm uncertainty focuses on accuracy of numerical algorithms for estimating the battery hidden state. This field of research evolves gradually and typical algorithms include KF, EKF, particle filter (PF), etc. For example, Li et al. conducted a comparative study of SOC estimation using Luenberger observer, EKF, sigma point KF (SPKF), and sequential Monte Carlo filter (i.e., the PF) (Li et al., 2013; Li et al., 2014). Environmental uncertainty especially the temperature uncertainty has a great influence on battery SOC and state of health (SOH) estimation and has been recently addressed by researchers (Chen et al., 2013; Xing et al., 2014). Model parameter uncertainty is the realization of the physical uncertainty on a specific battery model (e.g., equivalent circuit model and electrochemical model), where the physical
International Journal of Prognostics and Health Management, ISSN 2153-2648, 2014 009
INTERNATIONAL JOURNAL OF PROGNOSTICS AND HEALTH MANAGEMENT
uncertainty is mainly caused by the manufacturing tolerance resulting in the cell-to-cell variability. These types of uncertainty were noticed and discussed in recent work for battery SOC estimation (Truchot et al., 2014; Xing et al., 2014). However, there is a lack of systematic approach to characterize the model parameter uncertainty. Model uncertainty, representing the bias of the battery model compared to the true physical system, may always exist because no battery model can truly represent the battery system without any error under various battery operating conditions. For example, an electrochemical battery model typically indicates a higher fidelity level compared to the equivalent circuit model, but its model uncertainty or bias still exists. Since the battery performance estimation is conducted on the basis of the assumed ‘perfect’ battery model, any level of model uncertainty will cause biased battery performance estimation regardless of the specific numeric algorithms. Up to date, model parameter uncertainty and model uncertainty are generally overlooked by majority of researchers in the field of battery diagnostics and prognostics. Contribution of this paper is to propose a systematic framework to quantify battery model and parameter uncertainties for more effective battery performance estimation. Such a framework is generally applicable for estimating various battery performances of interest (e.g. SOC, capacity, and power capability). The structure of the rest of the paper is organized as follows. Section 2 illustrates model and parameter uncertainties of the battery model. Section 3 presents the framework with associated methodologies to quantify the battery model and parameter uncertainties. Case study is presented in Section 4 for demonstration of the proposed framework. Finally, conclusion is made in Section 5.
as low fidelity models with less accuracy but very high computational efficiency. Thus, majority of the battery management system (BMS) employs the equivalent circuit model for battery SOC and SOH diagnosis and prognostics. A discrete time state-space model (see Eq, (1)) is typically used to estimate battery hidden states (e.g. SOC and capacity) using the KF/EFK on the basis of the equivalent circuit model.
x k+1=f (x k ,u k )+w k y k =g (x k ,u k )+v k
where xk is the state vector at the kth step; uk means the input vector (e.g. current); wk is the process noise; yk is the output vector (e.g. terminal voltage); vk is the measurement noise of the output vector; f(·) is the state transition function; and g(·) is the equivalent circuit model that relates the output vector with the input and hidden state vectors. 2.2 Model Uncertainty When battery models are truly representing the real physical systems, the output vector predicted from the model would be exactly the same as the test results under various battery operating conditions. It is worth noting that above statement is valid when satisfying three conditions: i) no model parameter uncertainty, ii) no numerical algorithm uncertainty, and iii) no test error. However, models are generally built on the basis of many assumptions and simplifications and therefore model uncertainty may always exist because there is probably no ideal model which can predict the real physical system without any model bias. Eq. (2) shows one specific state-space model used for the SOC estimation (Plett, 2004a).
xk +1 = xk − ηTik / C n + wk yk = OCV ( xk ) − ik R + hk + vk
2. MODEL AND PARAMETER UNCERTAINTIES This section first presents a brief review of Li-ion battery models, and then illustrates model and parameter uncertainties in the following two subsections, respectively. 2.1 Battery Model Battery model can be classified into two groups: electrochemical models and equivalent circuit models. Electrochemical models are physics-based models where a set of governing non-linear differential equations are used to predict the battery internal state variable which can be further related to the typical battery performances of interest. They are generally treated as high fidelity models requiring high computational effort and thus are not desirable in real time battery SOC and state of health (SOH) diagnosis and prognostics. Equivalent circuit models are simplified physics-based models where a capacitor (or a voltage source) and resistors are used to represent the diffusion process and internal impedance of the battery cell, respectively. Compared to the electrochemical models, they can be viewed
(1)
(2)
where ݔାଵ is the SOC at the (k+1)th step; ߟܶ݅ is the coulomb accumulation for given charging/discharging efficiency (η), current ( ݅ ) and time accumulation T; ܥ is the nominal capacity. The second equation is the equivalent circuit model which builds the functional relationship for terminal voltage yk, open circuit voltage (OCV), internal impedance R and voltage change hk due to the hysteresis effect. A one-state hysteresis model is further expressed in Eq. (3). ℎ = exp ቀ− ቚ exp ቀ− ቚ
ఎ ೖషభ ఊ∆௧
ఎ ೖషభ ఊ∆௧
ቚቁቁ ܯ
ቚቁ ℎିଵ + ቀ1 − (3)
where ߛ is a positive value which tunes the rate of decay; and M is a polarization coefficient. For one specific battery cell, model uncertainty is the deterministic difference between the predicted terminal voltage yk and the true terminal voltage, which indicates the
INTERNATIONAL JOURNAL OF PROGNOSTICS AND HEALTH MANAGEMENT
model inadequacy for representing the actual functional relationship under various battery operating conditions. In general, parameter uncertainty, which will be illustrated in the next subsection, is coupled with the model uncertainty and should be taken into account when characterizing the model uncertainty. Thus, model uncertainty becomes the stochastic difference between the predicted terminal voltage yk and the true terminal voltage. For the equivalent circuit model considered above, a corrected model after introducing the model uncertainty can be defined in Eq. (4).
yk = OCV( xk ) − ik R + hk + δ (ik , xk,Ck ) + vk
(4)
where δ(·) is the model uncertainty function which is also referred as model bias in model validation community. Development of an effective model uncertainty characterization approach can improve model prediction accuracy in the intended uses of the model (Youn et al., 2011; Zhan et al., 2012; Xi et al., 2013a&b). Such process is especially useful to improve accuracy of a low fidelity model (e.g. equivalent circuit models with high computational efficiency) comparable to a high fidelity model (e.g. electrochemical models with low computational efficiency) so that diagnosis and prognostics of battery SOC and SOH can be conducted more effectively. 2.3 Parameter Uncertainty A common mistake in battery SOC and SOH diagnosis and prognosis is ignorance of the fact that the battery used in laboratory test is different with others in real operation due to various sources of uncertainties (e.g. physical uncertainty) even if they are the same type and come from the same manufacturer. Physical uncertainty can be viewed as the cellto-cell variability due to manufacturing tolerance. Correspondingly, parameter uncertainty is the realization of the physical uncertainty in the specific battery models. According to the battery model defined in Eq. (3) and Eq. (4), model parameters (e.g. internal impedance R, decay factor ߛ, polarization coefficient M, etc.) contain uncertainty due to the cell-to-cell variability and thus should be appropriately quantified. Otherwise, the battery performance estimation may be accurate for one cell under perfect calibration condition, but not so accurate for other cells. Accuracy variability depends upon two factors: i) significance of the parameter uncertainty and ii) sensitivity of the accuracy with respect to the parameter uncertainty. 2.4 Remarks on Model and Parameter Uncertainty In model calibration, the objective is to maximize the agreement between the model prediction and the test data. A
common approach for simplification is to disregard the model uncertainty by maximizing the agreement between the original model prediction and the test data through calibration of unknown model parameters. It is apparent that the calibrated model parameters may not be the true values. This is acceptable in model calibration because models are treated more pragmatically to increase their predictive power for one or several specified battery cells. However, if the objective is to improve the model prediction accuracy for the population of the battery cells under various operating conditions, it is risky to directly use model calibration technique because the model prediction could be inaccurate out of the calibration domain due to incorrect calibration of the model parameters and ignorance of the model uncertainty. 3. PROPOSED FRAMEWORK PERFORMANCE ESTIMATION
FOR
BATTERY
The proposed systematic framework is shown in Fig. 1 with consideration of the model and parameter uncertainties for more effective battery performance estimation. There are two major benefits using the proposed framework: i) consideration of the cell-to-cell variability and ii) accuracy improvement of the initial battery model. Basically, this framework enables user to select a low fidelity battery model with high computational efficiency without sacrificing accuracy because a corrected battery model with high accuracy can be later obtained through characterizing the model uncertainty. Furthermore, battery SOC or SOH diagnosis becomes probabilistic instead of deterministic so that confidence of the estimation is available. Following subsections elaborate each step of the framework. 3.1 Determination of Initial Battery Model The initial battery model ideally should include major input factors that affect the output performances. For example, OCV, SOC, charge/discharge current, hysteresis and temperature are important inputs for predicting the terminal voltage and thus should be considered in the empirical model. The purpose is to have a good base model with reasonable accuracy so that model uncertainty can be more effectively quantified to improve the model prediction accuracy. Otherwise, more noise factors would be included in the quantified model uncertainty such that the corrected model prediction would include much wider confidence intervals to account for the ignorance of the important factor. In this study, the equivalent circuit model in Eq. (2) and Eq. (3) is used without considering the temperature effect. Thus, testing is conducted in the room temperature to eliminate the noise factor from various temperature levels for the battery performance estimation.
INTERNATIONAL JOURNAL OF PROGNOSTICS AND HEALTH MANAGEMENT
Determine initial battery model
Quantify model parameter uncertainty
Quantify model uncertainty
Corrected battery model
Select numerical algorithm
Uncertainty quantification
Battery SOC & SOH estimation
Figure 1. Flowchart of the proposed framework for battery performance estimation
3.2 Quantification of Parameter Uncertainty A certain number of battery cells should be employed to account for the cell-to-cell variability based on the parameter uncertainty. The issue of data sufficiency needs to be addressed in this step. For example, defined pulse power capability tests of five battery cells result in five sets of model parameters after calibration of each cell individually. Thus, five random realizations are available for quantifying the uncertainty of the model parameter. Typically, random parameters can be classified into two groups: i) irreducible random parameter and ii) reducible random parameter. The irreducible random parameters are characterized using probability density functions (PDFs) with sufficient information. The reducible random parameters are derived from the lack of information for describing the uncertainty. For example, parameters, i.e., the mean and the variance of the PDF, or even distribution types are uncertain unless sufficient information is collected (Wang et al., 2009). This study considers parameter uncertainty as irreducible random parameter and use maximum likelihood estimation (MLE) to select the optimal distribution for each model parameter. The statistics of the random parameter is represented by the statistical parameter Θ of a candidate distribution. For example, in the case of a normal distribution, the parameter is defined as Θ={µθ, σθ}, which includes the mean and standard deviation. Thus, Θ is the calibration parameter and needs to be identified. The statistical model calibration using the MLE is formulated as Maximize L(Vi | Θ) =
N
∑ log [ f (v 10
ij
|Θ
)]
A GP is a stochastic process whose realizations (e.g. model bias) consist of random values associated with every point in a range of input domains (e.g. battery charge/discharge current and SOC) such that each random variable has a normal distribution. Moreover, every finite collection of those random variables has a multivariate normal distribution. One can write δ ~ GP (µ, Σ), meaning the random function δ, i.e. model uncertainty, is distributed as a GP with mean function µ and covariance function Σ. When the input vector is two- or multi-dimensional, a GP might be also known as a Gaussian random field. Interested readers should refer to the reference (Rasmussen and Williams, 2006) for details about the GP modeling. 3.4 Correction of Initial Battery Model
(5)
j =1
where L(·) is the likelihood function; f(·) is the PDF of the random parameter Vi for a given Θ; i means the ith model parameter; and N is the number of available the data for the calibration. A candidate distribution pool, including Normal, Lognormal, Weibull, Beta, Gamma, and Uniform, is defined and the optimal distribution is determined by the maximum likelihood value among candidate distributions. 3.3 Quantification of Model Uncertainty
The objective for quantifying model uncertainty is to improve the model prediction accuracy by adding the identified model uncertainty to the original model as shown in Eq. (4). This paper proposes a two step approach for quantifying the model uncertainty as a Gaussian process (GP). Step 1: calibrate the model bias of several battery cells under typical charge/discharge profile. Step 2: perform GP modeling to account for the variability of the model bias from several battery cells. The first step is straightforward and a deterministic model bias can be calculated as the difference between the measured and predicted performance of interests for individual cell. Variability of the model bias or model uncertainty can be observed after calibrating the model bias for multiple cells and hence can be modeled as a GP.
The corrected battery model is shown in Eq. (6) by adding the identified model uncertainty, i.e., δ (ik, xk, Ck), to the initial battery model. Furthermore, model parameter uncertainty should have been characterized to account for the cell-to-cell variability. The corrected model is a statistically validated model and is thus expected to produce more accurate and robust battery performance estimation. It is worth noting that such correction applies for aging battery cell as well if the characterized model uncertainty considers degraded battery cells (e.g., capacity degradation of Ck). xk +1 = xk − ηTik / Cn + wk yk = OCV ( xk ) − ik R + hk + δ (ik , xk , Ck ) + vk
(6)
INTERNATIONAL JOURNAL OF PROGNOSTICS AND HEALTH MANAGEMENT
15
4 10 3.5 3 2.5 0 0
10000
20000
30000
40000
50000
-5
1.5 1
The objective is to estimate the battery performance in a statistical manner using the validated battery model and the selected numerical algorithm. All sources of uncertainties are considered in model parameters and identified model uncertainty/bias. Essentially, the battery performance estimation of xk becomes an Uncertainty Quantification (UQ) process to quantify the distribution of the performance xk subject to the input uncertainties from the model parameter, model uncertainty, numerical algorithm error, and the measurement and process noise.
-10 0.5 Test_Time(s) -15
0
a.
Capacity test
100
4.5
80
4
60
3.5 3
20 2.5 0 0
20000
40000
60000
1.5
-40
1
-60
0.5
-80 Test_Time(s)
-100
b.
0
HPPC test
12
4.5 4
10 3.5
Current(A)
This section presents a case study to demonstrate the effectiveness of the proposed framework for battery SOC estimation.
2
-20
3 2.5
6 2 4
1.5 1
2 0.5
4.1 Background EIG C020 battery cells were used in this case study with the nominal capacity of 20Ah. Four training battery cells were connected parallel to four channels of the battery cycler (Arbin BT2000). All experiments, including static capacity test, hybrid pulse power characterization (HPPC) test, OCV-
Voltage(V)
Current(A)
40
8
4. CASE STUDY
600002
Voltage(V)
5
3.6 Uncertainty Quantification
A common challenge in UQ is a multi-dimensional integration to quantify probabilistic nature of system responses. Neither analytical multi-dimensional integration nor direct numerical integration is possible for large-scale engineering applications. Other than those approaches, existing approximate methods for UQ can be categorized into five groups (Youn et al., 2008): i) sampling method, ii) expansion method, iii) the most probable point (MPP)-based method, iv) response surface approximate method, and v) approximate integration method. This study uses the sampling method, i.e. the Monte Carlo simulation (MCS), for UQ.
4.5
0 0
20000
c.
40000
0 60000 80000 100000 120000 140000 Test_Time(s)
OCV-SOC charging test
Voltage(V)
KF has been widely used in many applications to estimate the hidden state for linear state-space models. As an extension, EKF applies for non-linear state-space model using the linear approximation at each estimation step. Other KF related approaches are also reported such as adaptive KF, unscented KF, etc. All KF related approaches assume linearity of the state space model with Gaussian noise, which could cause estimation error for the non-linear model with non-Gaussian noise. In that scenario, Particle Filter (PF) (Orchard & Vachtsevanos, 2009) is more appropriate to approximate the state PDF using the Bayesian approach. However, PF is much more computational expensive than EKF. This study employs the EKF for demonstration of the proposed framework due to its reasonable accuracy and efficiency. It is worth noting that inappropriate selection of numerical algorithms could cause numerical estimation error.
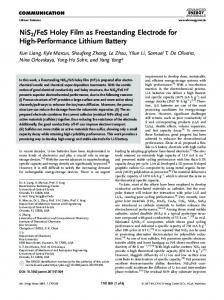
SOC test and federal urban drive schedule (FUDS) test, were conducted at the room temperature (25 oC) and detailed in Fig. 2. Capacity test results are shown in Table 1 with the mean (µ) and standard deviation (σ) equal to 19.82 Ah and 0.06 Ah, respectively. Coulomb efficiency of EIG C020 is very high and stable and thus was considered as 100%. In this study, the sample average capacity (=19.82 Ah) was treated as the nominal capacity for the SOC estimation. OCV-SOC curve was obtained at every 10% SOC as shown in Fig. 3.
Current(A)
3.5 Selection of Numerical Algorithm
INTERNATIONAL JOURNAL OF PROGNOSTICS AND HEALTH MANAGEMENT
0 0
20000
40000
60000
80000
100000
discharge impedance R-, iii) polarization coefficient M, and iv) decay factor γ. HPPC test was conducted with 10-second discharge-pulse and 10-second charge-pulse at each 10% depth-of-charge (DOD) increment, and the data were used to calibrate above four battery parameters.
4.5 120000 4
-2 3.5 3 2.5 -6 2
Voltage(V)
Current(A)
-4
1.5
-8
1 -10 0.5 Test_Time(s) -12
0
d.
OCV-SOC discharging test
60
4.5
1-004 Current(A) 1-004 Voltage(V)
40
4 3.5
20
0
2000
4000
6000
8000
10000
120002.5
-20 2
Voltage(V)
Current(A)
3 0
-40 1.5 -60
1
-80
0.5 Test_Time(s)
-100
0
e. FUDS test Figure 2. Current and voltage profiles of battery testing
Table 2. Uncertainty quantification of model parameters SOC 100% 90% 80% 70% 60% 50% 40% 30% 20% 10%
R+ 4.61% 2.11% 2.02% 6.06% 2.02% 3.92% 3.77% 3.58% 1.83% 7.90%
R4.26% 4.68% 1.99% 8.21% 4.85% 3.98% 1.94% 4.66% 5.31% 13.97%
γ 45.37% 29.54% 44.61% 18.76% 14.49% 10.73% 24.39% 18.43% 23.34% 101.90%
Mean and standard deviation of each parameter are calculated at every 10% SOC. Furthermore, the ratios between means and standard deviations were computed as shown in Table 2. For example, the standard deviation (STD) of charging impedance R+ at 70% SOC is 6.06% of its mean value. Typically, we should not ignore the parameter uncertainty if the STD is more than 1% of its mean value. Hence, four model parameters were characterized as random parameters and they were assumed to follow GP over the SOC range. Mean and 99% confidence interval (CI) of four parameters are shown in Fig. 4.
Table1. Static capacity test #1 Capacity (Ah) 19.90
#2 19.84
#3 19.79
µ
#4 19.74
σ
19.82
0.06
4.2 4.1
OCV(V)
4 3.9 3.8 3.7
a.
R+
b.
R-
3.6 3.5 3.4 0
20
40 60 SOC (%)
80
100
Figure 3. OCV-SOC curve 4.2 Results Analysis 4.2.1 Parameter Uncertainty Quantification Four battery cells were used to study the uncertainty of four model parameters including: i) charging impedance R+, ii)
M 33.95% 13.72% 41.78% 24.86% 13.80% 9.60% 20.58% 18.52% 17.63% 71.14%
INTERNATIONAL JOURNAL OF PROGNOSTICS AND HEALTH MANAGEMENT
c.
M
Figure 6. Mean of the model uncertainty for the FUDS test 4.2.3 SOC Estimation
d. γ Figure 4. Mean and 99% CI of four battery parameters
Accuracy of the terminal voltage was first evaluated using Eqs (2) and (6) on the basis of initial battery model and corrected model with consideration of the model uncertainty, respectively. Figure 7 shows the comparison of two cases for battery cell #5 under one FUDS cycle test, where dashed and solid lines are measured and estimated terminal voltage, respectively. Furthermore, root mean square (RMS) was computed for two cases as 0.0251 and 0.0144, meaning that the corrected model of Eq. (6) significantly reduced the RMS error (~43%) for estimating the terminal voltage.
4.2.2 Model Uncertainty Quantification FUDS data of four battery cells were used as training data to quantify the model uncertainty as a random process. Figure 5 presents the model bias of battery cell #1 under the FUDS test as a function of charge/discharge rate and SOC. Four similar model bias were obtained in total from four training battery cells and they were further employed to construct the GP for modeling the model uncertainty. Mean of the model uncertainty was obtained from the GP and was plot as a function of time for the FUDS test as shown in Fig. 6. a.
Figure 5. Model bias of cell #1
without model uncertainty
b. with model uncertainty Figure 7. Comparison of terminal voltage for cell #5 under the FUDS test
INTERNATIONAL JOURNAL OF PROGNOSTICS AND HEALTH MANAGEMENT
state of the battery degrades. Hence, these uncertainties Accuracy of the SOC estimation was further compared for should be carefully considered in order to design reliable battery cell #5 and #6 using the initial battery model and the battery diagnostics and prognostics systems. corrected model with identified model uncertainty from four training data sets. Both cells were firstly fully charged to 100% SOC and then followed by four FUDS cycles with about 10 minutes rest period in between till the SOC reached 10%. Reference SOC was calculated using the coulomb counting. Initial estimation of the SOC was set as 90% and the EKF was employed as the numerical algorithm. Figure 8 clearly shows that SOC estimation is much more accurate using the corrected battery model by considering the model uncertainty.
Figure 9. 95% CI of SOC estimation Under the FUDS test considering the parameter and model uncertainty 5. CONCLUSION
a.
Battery cell #5
b. Battery cell #6 Figure 8. Percentage of SOC estimation error for battery cell #5 and #6 under the FUDS test It is impossible to precisely calibrate model parameter and model bias for each battery cell for a fleet of battery applications. Therefore, UQ of the battery performance estimation is important by considering the parameter and model uncertainties. In this example, MCS was employed to calculate the 95% CI of the SOC estimation under the FUDS test as shown in Fig. 9, where the dashed line indicates one SOC realization from the cell #5. The results indicate that variability of the SOC estimation could reach up to 3% for the same type of battery under the same discharge/charge profile due to the manufacturing tolerance. It is worth nothing that such variability most likely would increase as the health
A systematic framework was proposed to quantify battery model and parameter uncertainties for more effective battery performance estimation. Quantification of the battery parameter uncertainty captures the cell-to-cell variability due to the manufacturing tolerance so that battery performance estimation could be accurate for a fleet of batteries instead of individual cell. Characterization of the battery model uncertainty enables user to correct an originally low fidelity battery model so that a high fidelity model could be obtained for more accurate battery performance estimation while keeping high computational efficiency. One case study of the battery SOC estimation demonstrated the effectiveness of the proposed framework. Further work is to systematically address all uncertainty sources and their coupling effects in battery management systems in real HEV/PHEV/EV applications.
ACKNOWLEDGEMENT Research was supported by Ford Motor Company.
REFERENCES Andre, D., Nuhic, A., Guth, T.S., and Sauer, D.U., (2012), Comparative study of a structured neural network and an extended Kalman filter for state of health deternimation of lithium-ion batteries in hybrid electric vehicles. Engineering Applications of Artificial Intelligence, v26, n 3, p951-961. Chen, Z., Mi, C.C., Fu, Y., Xu, J., Gong, X., (2013), Online battery state of health estimation based on Genetic Algorithm for electric and hybrid vehicle applications, Journal of Power Sources, v240, p184-192.
INTERNATIONAL JOURNAL OF PROGNOSTICS AND HEALTH MANAGEMENT
Han, J., Kim, D., Sunwoo, M., (2009), State-of-charge estimation of lead-acid batteries using an adaptive extended Kalman filter, Journal of Power Sources, v188 (2), p606-612. He, H., Xiong, R., Guo, H., and Li, S. (2012), Comparision study on the battery models used for the energy management of batteries in electric vehicles. Energy Conversion and Management, v64, p113-121. He, W., Williard, N., Chen, C., and Pecht, M., (2012), State of charge estimation for electric vehicle batteries under an adaptive filtering framework. Prognostics & System Health Management Conference, Beijing, China, 2012. He W., Williard N., Chen C., and Pecht M., (2013), State of Charge Estimation for Electric Vehicle Batteries using Unscented Kalman Filtering, Microelectronics Reliability, v53, n6, p840–847. He Y., Liu X.T., Zhang C.B., Chen Z.H., 2013, A new model for State-of-Charge (SOC) estimation for high-power Liion batteries. Applied Energy, v101, p808–814. Hu C., Youn B.D., and Chung J., (2012), A multiscale framework with extended Kalman filter for lithium-ion battery SOC and capacity estimation. Applied Energy, v92, p694–704. Hu C., Jain G., Tamirisa P., and Gorka T., (2014a), Method for Estimating Capacity and Predicting Remaining Useful Life of Lithium-Ion Battery, Applied Energy, v126, p182–189. Hu C., Jain G., Zhang P., Schmidt C., Gomadam P., and Gorka T., (2014b), Data-Driven Approach Based on Particle Swarm Optimization and K-Nearest Neighbor Regression for Estimating Capacity of Lithium-Ion Battery, Applied Energy, v129, p49–55. Jun, M., Smith, K., Wood, E., and Smart, M., (2012), Battery Capacity Estimation of Low-Earth Orbit Satellite Application, International Journal of Prognostics and Health Management, v3(2), pages: 9. Lee S., Kim J., Lee J., and Cho B.H., (2011), Discrimination of Li-ion batteries based on Hamming network using discharging–charging voltage pattern recognition for improved state-of-charge estimation. Journal of Power Sources, v196, n4, p2227–2240. Li, J., Klee Barillas, J., Guenther, C., Danzer, M.A., (2013), A comparative study of state of charge estimation algorithms for LiFePO4 batteries used in electric vehicles, Journal of Power Sources, v230, p244-250. Li, J., Klee Barillas, J., Guenther, C., Danzer, M.A., (2014), Sequential Monte Carlo filter for state estimation of LiFePO4 batteries based on an online updated model, Journal of Power Sources, v247, p156-162. Ng, K.S., Moo, C.S., Chen, Y.P., and Hsieh, Y.C., (2008), Enhanced coulomb counting method for estimating state-of-charge and state-of-health of lithium-ion batteries. Applied Energy, v86, p1506-1511. Orchard, M.E., and Vachtsevanos, G.J., (2009), A particlefiltering approach for on-line fault diagnosis and failure
prognosis. Transctions of the Institute of Measurement and Control, v31, n3/4, p221-246. Orchard, M.E., Cerda, M., Olivares, B., and Silva, J.F., (2012), Sequential Monte Carlo methods for Discharge Time Prognosis in Lithium-Ion Batteries, International Journal of Prognostics and Health Management, v3(2), pages: 12. Plett, G.L., (2004a), Extended Kalman filtering for battery management systems of LiPB-based HEV battery packs Part 2. Modeling and identification. Journal of Power Sources, v134, n2, p262-276. Plett, G.L., (2004b), Extended Kalman filtering for battery management systems of LiPB-based HEV battery packs Part 3. State and parameter estimation. Journal of Power Sources, v134, n 2, p277–292. Rasmussen, C.E. and Williams, C.K.I., (2006), Gaussian processes for machine learning, the MIT Press. Santhanagopalan, S., and White, R.E., (2008), State of charge estimation for electrical vehicle batteries. IEEE, 17th International Conference on Control Applications, Part of 2008 IEEE Multi-conference on System and Control, San Antonio, Texas, USA, September 3-5, 2008. Santhanagopalan S., and White R.E., (2010), State of charge estimation using an unscented filter for high power lithium ion cells. International Journal of Energy Research, v34, n2, p152–163. Truchot, C., Dubarry, M., Liaw, B.Y., (2014), State-ofcharge estimation and uncertainty for lithium-ion battery strings, Applied Energy, v119, p218-227. Waag W., and Sauer D.U., (2013), Adaptive estimation of the electromotive force of the lithium-ion battery after current interruption for an accurate state-of-charge and capacity determination, Applied Energy, v111, p416– 427. Wang D., Miao Q., and Pecht M., (2013), Prognostics of lithium-ion batteries based on relevance vectors and a conditional three-parameter capacity degradation model, Journal of Power Sources, v239, p253–264. Wang, P., Youn, B.D., Xi, Z., and Kloess A., (2009), Bayesian reliability analysis with evolving, insufficient, and subjective data sets. Journal of Mechanical Design, v131(11), 111008 (11 pages). Xi, Z., Fu, Y., and Yang, R.J., (2013a), Model bias characterization in the design space under uncertainty, International Journal of Performability Engineering, v9(4), p433-444. Xi, Z., Fu, Y., and Yang, R.J, (2013b), An Ensemble Approach for Model Bias Prediction, SAE Int. J. Mater. Manf., v6 (3), p532-539. Xing, Y., He, W., Pecht, M., Tsui, K.L., (2014), State of charge estimation of lithium-ion batteries using the open-circuit voltage at various ambient temperatures, Applied Energy v113, p106-115. Xiong R., Sun F., Chen Z., and He H., (2014), A data-driven multi-scale extended Kalman filtering based parameter and state estimation approach of lithium-ion polymer
INTERNATIONAL JOURNAL OF PROGNOSTICS AND HEALTH MANAGEMENT
battery in electric vehicles, Applied Energy, v113, p463– 476. Youn, B.D., Xi, Z., and Wang, P., (2008), Eigenvector Dimension-Reduction (EDR) method for sensitivity-free probability analysis. Structural and Multidisciplinary Optimization, v37, p13-28. Youn, B.D., Jung, B.C., Xi, Z., Kim, S.B., and Lee, W.R., (2011), A hierarchical framework for statistical model calibration in engineering product development, Computer Methods in Applied Mechanics Engineering, v200, p1421-1431. Zhan, Z., Fu, Y., Yang, R., Xi, Z., and Shi, L., (2012), A Bayesian Inference based Model Interpolation and Extrapolation, SAE International Journal of Materials and Manufacturing, v5, p357-364. Zhang, X., and Pisu, P., (2014), An Unscented Kalman Filter based on-line Diagnostic approach for PEM fuel cell Flooding, International Journal of Prognostics and Health Management, v5(1), pages: 18.
BIOGRAPHIES Rong Jing is a graduate student in the Department of Industrial and Manufacturing Systems Engineering at University of Michigan – Dearborn. She received her B.S. degree in Industrial Engineering from Xi’an Jiaotong University in 2012. She is the one-time winner of the Best Paper Award from ASME – Design Automation Conference in 2013. Her research interests are diagnostics, prognostics and health management. Zhimin Xi is an Assistant Professor in the Department of Industrial and Manufacturing Systems Engineering at University of Michigan – Dearborn. He received his B.S. and M.S. degree in Mechanical Engineering from Beijing University of Science and Technology in 2001 and 2004, respectively. He received his Ph.D. in Reliability Engineering from University of Maryland – College Park in 2010. He has over 30 publications in prestigious journals and international conferences. He is the two-time winners of the Best Paper Award from ASME – Design Automation Conference in 2008 and 2013, respectively. His research interests are reliability engineering, prognostics and health management, and energy storage device. Xiao Guang Yang received his Ph.D. from Zhejiang University in 1995, and then worked at University of Hawaii and Penn State Univ. In 2005, Dr. Yang joined Ford for HEV programs. He is a Technical Expert and Supervisor in the Energy Storage and Materials Research Department. He currently focuses on battery modeling, benchmark, and hybrid vehicle battery system simulation and validation. He is a member of USABC (Advanced Battery Consortium Technical Committee). He has 50 journal publications, 7
Ford Technical Reports, 3 US patents and 3 US patent applications. Ed Decker is a battery cell integration and product development engineer for the Ford Motor Company. He has two degrees from the University of California (Biology and Chemical Engineering). He has worked in battery development since 1984 and spent 16 years working on batteries for the consumer electronic market. He joined Ford Motor Company in 2010 and is currently working on developing batteries for BEV and PHEV applications.