Revista Ingenierías Universidad de Medellín
A systematic review of data quality issues in knowledge discovery tasks David Camilo Corrales* Agapito Ledezma** Juan Carlos Corrales*** Recibido: 29/07/2015 • Aceptado: 11/12/2015
Abstract Large volume of data is growing because the organizations are continuously capturing the collective amount of data for better decision-making process. The most fundamental challenge is to explore the large volumes of data and extract useful knowledge for future actions through knowledge discovery tasks, nevertheless many data has poor quality. We presented a systematic review of the data quality issues in knowledge discovery tasks and a case study applied to agricultural disease named coffee rust. Key words: heterogeneity, outliers, noise, inconsistency, incompleteness, amount of data, redundancy, timeliness
*
Informatics Engineering, Master in Telematics Engineering, Ph.D. scholarship holder of Colciencias in Telematics Engineering at University of Cauca, Colombia. Address. Calle 5 No. 4 - 70. Popayán, Colombia. Tel. +57 (8) 209800 Ext. 2129. E-mail.
[email protected]. Ph.D. student of Science and Informatics Technologies at Carlos III of Madrid University, Spain. Address. Avenida de la Universidad 30, 28911, Leganés, Spain. Tel. +34 916249110.
**
Associate Professor in the Department of Computer Science at Carlos III of Madrid University. B.S. from Universidad Latinoamericana de Ciencia y Tecnología. Ph.D. in Computer Science from Carlos III University, Spain. Address. Avenida de la Universidad 30, 28911, Leganés, Spain. Tel. +34 916249110. E-mail. ledezma@ inf.uc3m.es
***
Doctor of Philosophy in Sciences, Speciality Computer Science, and Full Professor and Leader of the Telematics Engineering Group at University of Cauca, Colombia. Address. Calle 5 No. 4 - 70. Popayán, Colombia. Tel. +57 (8) 209800 Ext. 2129. E-mail.
[email protected]
Revista Ingenierías Universidad de Medellín, vol. 15, No. 28 pp. 125-150 ISSN 1692 - 3324 - enero-junio de 2016/324 p. Medellín, Colombia
126
David Camilo Corrales - Agapito Ledezma - Juan Carlos Corrales
Una revisión sistemática de problemas de calidad en los datos en tareas de descubrimiento de conocimiento Resumen Hay un gran crecimiento en el volumen de datos porque las organizaciones capturan permanentemente la cantidad colectiva de datos para lograr un mejor proceso de toma de decisiones. El desafío mas fundamental es la exploración de los grandes volúmenes de datos y la extracción de conocimiento útil para futuras acciones por medio de tareas para el descubrimiento del conocimiento; sin embargo, muchos datos presentan mala calidad. Presentamos una revisión sistemática de los asuntos de calidad de datos en las áreas del descubrimiento de conocimiento y un estudio de caso aplicado a la enfermedad agrícola conocida como la roya del café. Palabras clave: heterogeneidad, valores atípicos, ruido, inconsistencia, valores perdidos, cantidad de datos, redundancia, oportunidad.
Revista Ingenierías Universidad de Medellín
A systematic review of data quality issues in knowledge discovery tasks
127
INTRODUCTION Data explosion is an inevitable trend as the world is interconnected more now than ever. It is obvious that we are living a data deluge era, evidenced by the sheer volume of data from a variety of sources and its growing rate of generation. For instance, an International Data Corporation (IDC) report [1] predicts that, from 2005 to 2020, the global data volume will grow by a factor of 300, from 130 exabytes to 40,000 exabytes, representing a double growth every two years [2]. The most fundamental challenge is to explore the large volumes of data and extract useful knowledge for future actions through knowledge discovery tasks as classification, clustering, etc. [3, 4], however many data lack of quality. It has been agreed that poor data quality will impact the quality of results of analyses in knowledge discovery tasks and that it will therefore impact on decisions made on the basis of these results [5, 6]. In this paper we present a systematic review for data quality issues in knowledge discovery tasks as: heterogeneity, outliers, noise, inconsistency, incompleteness, amount of data, redundancy and timeliness which are defined in [7, 8] and a case study in agricultural diseases: the coffee rust. This paper is organized as follows. Section II describes the data quality issues and the systematic review. The case study in the coffee rust is depicted in Section III and Section IV concludes this paper.
1. DATA QUALITY ISSUES IN KNOWLEDGE DISCOVERY TASKS This section gathers the main related works that address issues in data quality. The studies presented different approaches to solve issues in data quality such as: heterogeneity, outliers, noise, inconsistency, incompleteness, amount of data, redundancy and timeliness [7, 8]. We conduct a systematic review based on methodology [9], for each data quality issues, drawn from 4 informational sources: IEEE Xplore, Science Direct, Springer Link and Google. Table 1 shows the papers found: Table 1. Papers to solve data quality issues Data Quality Issues
Papers per source IEEE Xplore
Science Direct
Springer Link
Google
Heterogeneity
11
3
1
18
Outliers
28
10
7
2
Noise
15
2
2
0
Inconsistency
9
5
0
2
Revista Ingenierías Universidad de Medellín, vol. 15, No. 28 pp. 125-150 ISSN 1692 - 3324 - enero-junio de 2016/324 p. Medellín, Colombia
128
David Camilo Corrales - Agapito Ledezma - Juan Carlos Corrales
Data Quality Issues
Papers per source IEEE Xplore
Science Direct
Springer Link
Google
Incompleteness
21
14
4
0
Amount of data
23
15
10
5
Redundancy
24
13
10
8
Timeliness
2
0
1
1
Source: authors
Data quality issues as redundancy, amount of data, outliers, and incompleteness have received a mayor attention from the research community (55 papers for redundancy, 53 for amount of data, 47 for outliers, and 39 for incompleteness).Whilst, heterogeneity, noise, inconsistency and timeliness have received a minor attention (33 papers for heterogeneity, 19 for noise, 16 for inconsistency and 4 for timeliness). In figure 1 we can observe the classification of papers by approaches to solve data quality issues.
60
55
53 6
47 40
18 39
33
21
21
Papers
12 7 5 12
20 19
0
12
2
2
Heterogeneity
Outliers
19 6
16 0
5
13
17
3
1
8 Noise
Unsupervised learning
24
9 24
9 2
4
Inconsistency Incompleteness Amount of data Redundancy Supervised learning
Statistical
Others
Figure 1. Classification of papers by approaches to solve data quality issues. Source: authors
Revista Ingenierías Universidad de Medellín
4 0 Timeliness
A systematic review of data quality issues in knowledge discovery tasks
129
1.1 Heterogeneity Heterogeneity defined as incompatibility of information. There are distinguished two types of heterogeneity: the first one called “syntactic heterogeneity” that refers to the differences among definitions; such as, attribute types, formats, or precision. Meanwhile, the second one is called “semantic heterogeneity” that refers to the differences or similarities in the meaning of data [10]. The algorithms presented in the papers to solve the heterogeneity issue were classified in four categories: unsupervised learning, supervised learning, statistics and others, as shown in figure2. We can observe that statistical methods are the most used since 2006 to present.
Whereas, unsupervised and supervised learning are handled broadly since 2010 and beyond. And works that involve pattern matching approaches were developed in 2009. 5
4
Papers
3
2
1
0 2006
2008 Unsupervised learning
2010 Years Supervised learning
2012 Statistical
2014
Others
Figure 2. Time-line of approaches to solve the heterogeneity issue. Source: authors
Figure 3 shows that statistical methods [11] are trend to solve the heterogeneity issue followed by unsupervised (i.e., partitional cluster algorithms such: k-means and weighted k-means) and supervised (i.e., nearest neighbor algorithms as: k-nn and ensemble k-nn) learning [12–14]; as an alternative appears the pattern matching approach [15, 16]. Revista Ingenierías Universidad de Medellín, vol. 15, No. 28 pp. 125-150 ISSN 1692 - 3324 - enero-junio de 2016/324 p. Medellín, Colombia
130
David Camilo Corrales - Agapito Ledezma - Juan Carlos Corrales
Cluster-based K-NN K-means
Weighted K-means PCA
Ensemble K-NN
Pattern matching
Bayesian methods Probabilistic data Association Joint probabilistic data association Multiple hypothesis test Distributed multiple hypothesis test Unsupervised learning
K-NN
Distributed Particle filter
Maximum likelihood
Maximum posterior Dempster-Shafer inference
Distributed Joint probabilistic data association Graphical models
Covariance intersection
Distributed Kalman filter Kalman filter Supervised learning
Abductive reasoning
Covariance consistency Particle filter Statistical
Covariance union Others
Figure 3. Algorithms for addressing the heterogeneity issue. Source: authors
1.2 Outliers These are observations which deviate so much from other observations as to arouse suspicions that it was generated by a different mechanism [17]. Outlier detection is used extensively in many applications. Current application areas of outlier detection include: detection of credit card frauds, detecting fraudulent applications or potentially problematic customers in loan application processing, intrusion detection in computer networks, medical condition monitoring such as heart-rate monitoring, identifying abnormal health conditions, detecting abnormal changes in stock prices and fault diagnosis [18]. The algorithms presented in the papers to solve the outliers issue were classified in four categories: unsupervised learning, supervised learning, statistics and others, as shown in figure4. Unsupervised learning is the most used since 2008, followed by statistical methods since 2005, while supervised learning was exploded in 2004. It is important to point out that genetic algorithms are currently in use.
Revista Ingenierías Universidad de Medellín
A systematic review of data quality issues in knowledge discovery tasks
131
8
Papers
6
4
2
0 2004
2006
2008
Unsupervised learning
Years
Supervised learning
2010
2012 Statistical
2014
Others
Figure 4: time-line of approaches to solve the outliers issue. Source: authors
Figure 5 depicts the techniques to solve the outliers issue several papers make frequent use of unsupervised learning (i.e., partitional, density and hierarchical algorithms) and statistical methods [19–24]; lesser extent the supervised learning (i.e., variations of decision tree, k-nn and support vector machine algorithms) and genetic algorithms [25–27]. Voronoi based Outlier Detection (Voronoi diagram)
Ensemble outlier detection: mixture of Gaussian probability functions
Blox plot, Median Rule Median, Absolute Deviation (MAD) Support vector outlier detection
Clustering Based Outlier Detection: one pass clustering algorithm
A genetic algorithm to detect outliers in multivariate time series
clustering density method and minimal bounding box
Entropy-based outlier detection algorithm
New plot outlier detection based on Mahalanobis Distance Minimum spanning tree (MST)-inspired KNN Agglomerative hierarchical clustering
K-means outlier detection clustering-prunning step
Clusted density of local anomalies detection algorithm
Robust regression based on a multiple linear regression model The least squares algorithm on multi-times curve fitting
Kernel PCA using mahalanobis distance Unsupervised learning
Variance shift outlier model (VSOM) Supervised learning
Statistical
Andrews curves
Kd-tree and K-NN
Density-based clustering DBSCAN Others
Figure 5. Algorithms for addressing the outliers issue. Source: authors
Revista Ingenierías Universidad de Medellín, vol. 15, No. 28 pp. 125-150 ISSN 1692 - 3324 - enero-junio de 2016/324 p. Medellín, Colombia
132
David Camilo Corrales - Agapito Ledezma - Juan Carlos Corrales
1.3 Noise Defined as irrelevant or meaningless data [28] in the instances. For a given domainspecific dataset, attributes that contain a significant amount of noise can have a detrimental impact on the success of a knowledge discovery initiative, e.g., reducing the predictive ability of a classifier in a supervised learning task [29]. To address the noise issue algorithms were classified in three categories: unsupervised learning, supervised learning, and others, as shown in figure6. Although, the solutions for noise come from different fields, these are not currently widely used (its peak was from 2005 to 2009). In contrast, the supervised and unsupervised learning are currently used (from 2008, and 2009 respectively, until the present time). 3.5 3
Papers
2.5 2 1.5 1 0.5 2006
2008 Unsupervised learning
Years
2010
Supervised learning
2012 Statistical
2014
Others
Figure 6. Time-line of approaches to solve the noise issue. Source: authors
The most popular algorithms to address the noise issue have come from different fields (others category in figure7) such as: hash function, string matching algorithms, fuzzy systems, among others [30]. Supervised and unsupervised learning algorithms are the next most popular to address this issue [31–34].
Revista Ingenierías Universidad de Medellín
A systematic review of data quality issues in knowledge discovery tasks
Association rules, h-confidence measure, hyperclique patterns
Pairwise Attribute Noise Detectio Algorithm (PANDA)
Technique for ranking attributes in a given dataset from most to least noisy + PANDA Improved Kernel PCA Altorithm Fuzzy routh prototype selection algorithm removes noisy instances Duplicate identification rules: Functions to compare text similarity Hash function
Ensemble and co-training based detection method
PCA and partial least squares PLS
Fisher discriminant ration
Method based on fuzzy clustering in groups
Theorem redundant data compression with Markov estimation
String matching algorithms
Unsupervised learning
k-means
polishing, noise elimination and robust algorithms (Decision Tree)
Sub-fuzzy clustgering property optimization method based on grouping
Nested Bocking Technique: Jaro distance metric
133
Supervised learning
K-medoids
Rule-based noise detection approach (Boolean rules) Statistical
Others
Figure 7. Algorithms for addressing the noise issue. Source: authors
1.4 Inconsistency It refers to the lack of harmony between different parts or elements; instances that are self-contradictory or lacking in agreement when it is expected [7]. This problem is also known as mislabeled data or class noise. e.g., in supervised learning tasks, two instances have the same values, but have different labels or the label values do not correspond itself. The algorithms found in the papers that solve the inconsistency issue were classified in two categories: supervised learning and statistics, as shown in figure8. The supervised learning algorithms are widely used since 2005 compared to statistical methods, where only three of their approaches were used in 2008, 2009 and 2010. 5
4
Papers
3 2
1
0 2006
2008
2010 Years
Unsupervised learning
Supervised learning
2012 Statistical
2014
Others
Figure 8. Time-line of approaches to solve the inconsistency issue. Source: authors
Revista Ingenierías Universidad de Medellín, vol. 15, No. 28 pp. 125-150 ISSN 1692 - 3324 - enero-junio de 2016/324 p. Medellín, Colombia
134
David Camilo Corrales - Agapito Ledezma - Juan Carlos Corrales
We can see, in figure9 that the supervised learning algorithms (such as: ensemble methods and simple classifiers) [35, 36] are more used than statistical algorithms (i.e., Bayesian approaches and ROC analysis) [37–39]. Multiple classifiers with voting to detect mislabeled data Bayes error rate method Decisión Tree
AdaBoost
Partitioning Filter based on Rules
Receiver Operating Characteristic (ROC) analysis
Ensembles of classifiers
Bayesian classifier
Bayesian Information Criterion
Bayesian classifier
Filtering rules
dual-two-class-classifiers
Set of classifiers with a judgments, a voting mechanism is used to fuse these different judgments Supervised learning
Statistical
Figure 9. Algorithms for addressing the inconsistency issue. Source: authors
1.5 Incompleteness It is widely acknowledged as data sets affected by missing values. Typically occurs because of sensor faults, lack of response in scientific experiments, faulty measurements, and data transfer problems in digital systems or respondents unwilling to answer survey questions [40]. The algorithms presented in the papers that addressed the incompleteness issue were classified in four categories: unsupervised learning, supervised learning, statistics and others. Given the results in figure10 we argue that the increase of statistical methods and the unsupervised and supervised learning algorithms solve the incompleteness issue from 2010. However, the statistical methods have been more explored than unsupervised and supervised learning algorithms. 6 5
Papers
4 3 2 1 0 2004
2006
2008
Unsupervised learning
Years
2010
Supervised learning
2012 Statistical
2014 Others
Figure 10. Time-line of approaches to solve the incompleteness issue. Source: authors
Revista Ingenierías Universidad de Medellín
A systematic review of data quality issues in knowledge discovery tasks
135
Figure 11 depicts that the algorithms more used are statistics(i.e., imputation methods )[41–44], followed by unsupervised learning(i.e., combination of partitional and fuzzy algorithms, among others) [45–47], supervised learning (i.e., ensemble of svm and neural networks, k-nn, Bayesian network, etc.) [48–50] and lesser extent the ontologies [51].
Association Rules
Fuzzy C-Means
Weighted K-means K-NN
PCA
Modified median imputation
Fuzzy K-means
Cluster-based K-NN
multiple linear regression
K-means
Bicluster and mean squared residue metric Global-local Modified Singular Value Decomposition Ontology
Regression imputation
Bicluster-based least square imputation method Bayesian multiple imputation
Clustering-based Random Imputation Non parametric iterative Imputation
Pairwise deletion
Dynamic local least squares imputation Wise Walczak imputation
Mean imputation
Regression tree imputation method
Listwise imputation
Hot-deck imputation
Predictive model-based imputation
Cluster-Based Local Least Squares Imputation
Propensity score imputation
Ensemble SVM
Unsupervised learning
Neural network ensemble Supervised learning
R-expectation maximization imputation Bayesian network classifiers Statistical
Others
Figure 11. Algorithms for addressing the incompleteness issue. Source: authors
1.6 Amount of data The amount of data available for model building contributes to relevance in terms of goal attainment [7]; small and imbalanced datasets build inaccurate models. The algorithms found in the papers that solve the amount of data issue were classified in four categories: unsupervised learning, supervised learning, statistics and others. We can analyze, in figure12, the increased of usage of statistical methods (since 2004), supervised learning (since 2005) and unsupervised learning (since 2010) until present times. The other approaches are used in lesser extent (2012).
Revista Ingenierías Universidad de Medellín, vol. 15, No. 28 pp. 125-150 ISSN 1692 - 3324 - enero-junio de 2016/324 p. Medellín, Colombia
136
David Camilo Corrales - Agapito Ledezma - Juan Carlos Corrales
5 4
Papers
3 2 1 0 2004
2006
2008
Unsupervised learning
2010
Years
2012
Supervised learning
Statistical
2014 Others
Figure 12. Time-line of approaches to solve the amount of data issue. Source: authors
We can analyze, in figure13 that statistical methods are the most relevant approach to generate new instances, using techniques such as: synthetic minority oversampling technique (SMOTE), intervalized kernel density estimator, multimodality variables [52–54], as well as, combination of statistical methods with supervised learning algorithms as: posterior probability of support vector machine (SVM) and neural networks [55–57]. Furthermore the statistical methods is the most important approach to balance datasets through oversampling and under sampling techniques, besides of hybrid techniques with unsupervised learning algorithms as: k-means based oversampling and fuzzy c means based oversampling [58–60]. Additionally exist other approaches from evolutionary algorithms and fuzzy systems [61–64]. Overbagging
Boosting
Non-parametric statistical methods
Posterior probability neural network
Multimodality variables
Posterior probability SVM Rotation forest Incremental learning
Bagging
Random oversampling
Intervalized kernel density estimator
Parameter estimation of the weibull distribution Triangular fuzzy member function
Syntethic minority oversampling techniques
K-means based oversampling Unsupervised learning
Random undersampling
Fuzzy C-Means based oversampling
Supervised learning
Statistical
Evolutionary algorithms Others
Figure 13. Algorithms for addressing the amount of data issue. Source: authors
Revista Ingenierías Universidad de Medellín
A systematic review of data quality issues in knowledge discovery tasks
137
1.7 Redundancy As the name implies, it is the redundant information, such as, duplicate instances and derived attributes of others that contain the same information [65, 66]. As mentioned above, the algorithms found in the papers to solve the redundancy issue were classified in four categories: unsupervised learning, supervised learning, statistics and others. The time-line of approaches to solve the redundancy issue is shown in figure 14. The use of unsupervised learning algorithms have grown since 2008, and the supervised learning algorithms since 2010. Meanwhile the statistical methods have decreased its use (from the year 2006 to 2010). Other approaches as evolutionary and greedy algorithms are used at the present time (2013-2014). 12.5
10
Papers
7.5
5
2.5
0 2006
2008 Unsupervised learning
2010 Years Supervised learning
2012 Statistical
2014
Others
Figure 14. Time-line of approaches to solve the redundancy issue. Source: authors
In figure 15 the supervised learning approach is the most commonly used, specially Nearest-neighbor algorithms as: k-nn, selective nearest neighbor rule, condensed nearest neighbor, multi edit nearest neighbor, etc. [65, 67, 68], followed by unsupervised learning techniques [69–72], in addition to other approaches from evolutionary(memetic and clonal selection) and greedy (sequential forward selection and plus-L minus-R selection) algorithms [65, 66].
Revista Ingenierías Universidad de Medellín, vol. 15, No. 28 pp. 125-150 ISSN 1692 - 3324 - enero-junio de 2016/324 p. Medellín, Colombia
138
David Camilo Corrales - Agapito Ledezma - Juan Carlos Corrales
Correlation coefficiet Pair opposite class-nearest neighbor
Prediction Analysis of microarray Memetic algorithm
Between within ration
Clonal selection algorithm
Decremental reduction optimization procedure
Iterative case filtering algorithm
Generalized condensed nearest neighbour rule
Multiedit nearest neighbor
K-NN
Condensed nearest neighbor
Selective nearest neighbour rule
Support vector k-nearest neighbor clustering Unsupervised learning
Object selection clustering Supervised learning
SVM
Plus-L Minus-R selection
Sequential forward selection PCA
Probabilistic PCA
Edited nearest neighbor
Kernel PCA
Generalized-modified chang algorithm Statistical
Others
Figure 15. Algorithms for addressing the redundancy issue. Source: authors
1.8 Timeliness It is defined as the degree, in which, data represent reality from the required point in time. When the state of the world changes faster than our ability to discover these state changes and update the data repositories accordingly, the confidence on the validity of data decays with time [73]. e.g., people move, get married, and even die without filling out all necessary forms to record these events in each system where their data is stored [74].
In this sense to solve the timeliness issue, researchers such as [75–77] use decay functions (DF) as measure of the degradation of knowledge integrity. A DF takes some associated information that correspond to a description of the instance (for example, the source-destination pair of a network packet) and returns a weight for this instance; sliding window, exponential decay and polynomial decay are examples of DF. Correspondingly [73] proposes two approaches (analytical and algebraic) to deal with information obsolescence based on credibility thresholds defined by associated information of an instance. 2 DATA QUALITY ISSUES IN AGRICULTURAL DISEASES: COFFEE RUST The data quality issues discussed above can appeared in any application domain. For uniformity and easiness purposes, in this section, the examples for each data quality issue are focused on coffee rust disease and its weather conditions. Rust is the main disease that attacks the coffee crop and it causes losses up to 30% in susceptible varieties of Arabica Coffee species in Colombia. In regions of Brazil, where climate conditions favor the disease, losses can reach about 35%, and sometimes even more than 50% [78–82]. Revista Ingenierías Universidad de Medellín
A systematic review of data quality issues in knowledge discovery tasks
139
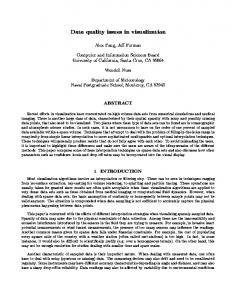
2.1 Heterogeneity Practical examples are the data collected by weather stations (WS). Let us suppose that exist two WS with data of temperature. The WS “A” measures the temperature with a dot as decimal separator and the WS “B” with a comma. When we try to fuse the temperature data of WS “A” and “B” we find a syntactic heterogeneity issue. Equally, the WS “A” measures the temperature in Celsius degree and the WS “B” in Fahrenheit scale, in this case we find a semantic heterogeneity issue. 2.2 Outliers The outliers can be presented as an error in the process of the data collected or abnormal behaviors of the scenario modelled. Supposing that we have a dataset with incidence rate of rust measurements. In the first case the presence of outliers occurs by human errors in the count of infected leafs per coffee tree. Whereas, in the second case, the change of weather conditions generate outliers, even though the measurements of infection rust are correct. In figure16 are presented in red color, examples of outliers. 15
Incidence rate of rust
12.5
10 7.5
5
2.5 0 1400
1500
1600
1700 Plants per hectare
1800
1900
2000
Figure 16. Outliers: plants per hectare vs incidence rate of rust. Source: authors
2.3 Noise A particular case of noise is given by temperature, humidity and rainfall dataset of a weather station. The sensors are misconfigured and its measurements have incoherent values as temperature of 250°C, humidity of -70%, and rainfall of -15 mm as seen in table 2. Revista Ingenierías Universidad de Medellín, vol. 15, No. 28 pp. 125-150 ISSN 1692 - 3324 - enero-junio de 2016/324 p. Medellín, Colombia
140
David Camilo Corrales - Agapito Ledezma - Juan Carlos Corrales
Table 2. Example of dataset with weather variables and noise. Temperature (°C)
Humidity (%]
Rainfall (mm)
16.49
97.53
0.8
16.88
-70
0.6
16.58
98.73
1
15.24
97.88
-0.9
15.84
99.71
0.3
250
97.47
15.07
-300
0.1
16.19
89.07
-15
Source: authors
2.4 Inconsistency Assuming we have a dataset for coffee rust detection with the attributes: coffee rust control in the last month (Yes/No), coffee rust control in the last 3 months (Yes/No), fertilization in the last 4 months (Yes/No), and the class: rust presence(Yes/No). A case of inconsistency is given by contradictions in the values of attributes and class. For example if it was not done a coffee rust control in last month and the last 3 months, and neither fertilizations in the last 4 months, and the class did not declare the rust presence is possible that the instance is incoherent (Second instance in Table 3). Another example occurs when the class is mislabeled. Assuming that we have two instances with the same values in the attributes (coffee rust control in the last month = “Yes”, coffee rust control in the last 3 months = “Yes”, fertilization in the last 4 months = “Yes”)but the values of its classes are different (for first instance the rust presence is “Yes” whereas the second instance is “No”)as we can see in the first and third instance of the table 3. Table 3. Example of dataset for coffee rust detection with inconsistencies. Coffee rust control in the last month.
Coffee rust control in the last 3 months
Fertilization in the last 4 months
Rust presence
Yes
Yes
Yes
Yes
No
No
No
No
Yes
Yes
Yes
No
Yes
Yes
No
No
Yes
No
Yes
No
Source: authors
Revista Ingenierías Universidad de Medellín
A systematic review of data quality issues in knowledge discovery tasks
141
2.5 Incompleteness Considering the data collected by weather stations, some values are missed due to lapses found in the sensors, electrical interruptions, and losses in the data transmission, etc. In table 4 are shown the missing values represented by symbol “?”. Table 4. Example of dataset with weather variables and incompleteness. Temperature (°C)
Humidity (%]
Rainfall (mm)
20
70
5.4
19
?
?
?
75
6.5
18
?
?
?
77
6.5
21
?
0.7
23
78
6.2
?
95.75
0.8
Source: authors
2.6 Amount of data A real case is presented in [80, 82]. Their dataset includes 147 instances to try to detect the incidence rate of rust. Nevertheless the few instances to train a classifier limit its performance, since the classifier cannot take the right decision if data training does not have cases that support the expected decision. On the other hand, the imbalanced issue is explained through the next example: assuming we have a dataset forcoffee rust detection with the attributes: coffee rust control in the last month (Yes/No), coffee rust control in the last 3 months (Yes/No), fertilization in the last 4 months (Yes/ No), and the class: rust presence (Yes/No); the number of instances with label rust presence = “Yes” are 100 and 900 instances with label rust presence = “No”, is a case of imbalanced dataset. 2.7 Redundancy Redundancy is produced by duplicate instances and derived attributes of others that contain the same information. Imagine we have a dataset for coffee rust detection with the attributes: coffee rust control in the last month, coffee rust control in the last 3 months, fertilization in the last 4 months, length, width, area of a plot and the class: rust presence (Yes/No). In table 5, the first and second instance are examples of duplicate Revista Ingenierías Universidad de Medellín, vol. 15, No. 28 pp. 125-150 ISSN 1692 - 3324 - enero-junio de 2016/324 p. Medellín, Colombia
142
David Camilo Corrales - Agapito Ledezma - Juan Carlos Corrales
instances. Whereas derived attributes are the length and width of a plot because the area contains the same information (the area is computed as product of length and width). Table 5. Example of dataset for coffee rust detection with redundancies. Coffee rust Coffee rust Fertilization control in the control in the in the last 4 last month. last 3 months months
Length (m)
Width (m)
Area (m2)
Rust presence
No
No
No
100
100
10000
Yes
No
No
No
100
100
10000
Yes
Yes
Yes
No
90
80
7200
No
Yes
Yes
Yes
130
50
6500
No
Source: authors
2.8 Timeliness A basic sample of timeliness is the construction of a classifier for coffee rust detection based on weather data from 1998. The classifier will be accurate to detect coffee rust in the year 1998; however, in the actuality it does not work due to weather changes occurred in the last years.
On the basis of the foregoing, we have identified 4 data quality issues (noise, incompleteness, outliers and amount of data) in a real dataset for coffee rust detection exposed in [80], [82]. The data used in this work were collected at the Technical Farm (Naranjos) of the Supracafe, in Cajibio, Cauca, Colombia (21°35’08”N, 76°32’53”W), during 2011-2013. The dataset includes 147 samples from the total of 162 available ones. The remaining 15 samples were discarded manually due to data quality problems in the collection process. The 15 instances discarded, 9 was noise issue (sensors of weather station were misconfigured) and 6 of incompleteness (lost in the data transmission of weather station with server). Moreover, 8 samples of 147 instances of the dataset were detected as outliers due to the poor process to apply the methodology in the incidence rate of rust. As a final point, the amount of data issue is reflected on the dataset, since, it is very small to try to detect coffee rust, considering that incidence rate of rust are among 1% and 20% with only 147 samples. 3 CONCLUSIONS AND FUTURE WORKS In this study we have reviewed the relevant literature to identify the major data quality issues in order to improve the community’s awareness and understanding of the quality challenges (and current solutions). The systematic review presented above offers four Revista Ingenierías Universidad de Medellín
A systematic review of data quality issues in knowledge discovery tasks
143
approaches to solve the data quality issues in knowledge discovery tasks: unsupervised and supervised learning, statistical methods and others. 59.76% of papers used unsupervised and supervised learning, followed by 31.57% of statistical methods and other approaches with8.64%. The trend to use unsupervised and supervised learning occurs because of the ability to handling large volume of data. Different from of statistical methods which assume a known underlying distribution of data. It is also worth to observe that 27.41% of papers with statistical methods use multivariate techniques and 73.59% univariate techniques. Low use of multivariate methods happens because statistical methods are often unsuitable for high-dimensional data sets. Other approaches as ontologies, evolutionary algorithms and fuzzy systems are considered interesting to support main approaches as unsupervised and supervised learning.
From the agriculture domain we considered two data quality issues out of reach: the first one the timeliness; the treatment of data during the collection process, considering that it is needed extra associated information of the instance in the moment of recollection (for example, the date of capture of data as temperature, humidity, rainfall, age of weather station, etc.) and usually the re-collectors do not discover this types of details. The second one is the amount of data; to capture this kind of data it is necessary to have workers that cross the crops and count the infected leafs permanently, which implies high cost and qualified personnel. ACKNOWLEDGEMENTS The authors are grateful to the Telematics Engineering Group (GIT) of the University of Cauca, Control Learning and Systems Optimization Group (CAOS) of the Carlos III University of Madrid for technical support, Colciencias for PhD scholarship granted to MsC. David Camilo Corrales, Ministry of Economy and Competitiveness of Spain (Project TRA2011-29454-C03-03 i-Support: Sistema Inteligente Basado en Agentes de Soporte al Conductor) and AgroCloud project of the RICCLISA Program to support this research.
REFERENCES [1] J. Gantz and David Reinsel, “The digital universe in 2020: Big data, bigger digital shadows, and biggest growth in the far east,” IDC VIEW, pp. 1-16, 2012. [2] H. Hu, Y. Wen, T.-S. Chua, and X. Li, “Toward Scalable Systems for Big Data Analytics: A Technology Tutorial,” IEEE Access, vol. 2, pp. 652-687, 2014. [3] A. Rajaraman and J. D. Ullman, Mining of Massive Datasets. New York, N.Y. ; Cambridge: Cambridge University Press, 2011. Revista Ingenierías Universidad de Medellín, vol. 15, No. 28 pp. 125-150 ISSN 1692 - 3324 - enero-junio de 2016/324 p. Medellín, Colombia
144
David Camilo Corrales - Agapito Ledezma - Juan Carlos Corrales
[4] F. Pacheco, C. Rangel, J. Aguilar, M. Cerrada, and J. Altamiranda, “Methodological framework for data processing based on the Data Science paradigm,” in Computing Conference (CLEI), 2014 XL Latin American, 2014, pp. 1-12. [5] G. A. Liebchen and M. Shepperd, “Software productivity analysis of a large data set and issues of confidentiality and data quality,” in Software Metrics, 2005. 11th IEEE International Symposium, 2005, p. 3 pp.-46. [6] G. A. Liebchen and M. Shepperd, “Data Sets and Data Quality in Software Engineering,” in Proceedings of the 4th International Workshop on Predictor Models in Software Engineering, New York, NY, USA, 2008, pp. 39-44. [7] M. F. Bosu and S. G. Macdonell, “A Taxonomy of Data Quality Challenges in Empirical Software Engineering,” in Software Engineering Conference (ASWEC), 2013 22nd Australian, 2013, pp. 97-106. [8] D. C. Corrales, A. Ledezma, and J. C. Corrales, “A conceptual Framework for data quality in knowledge discovery tasks (FDQ-KDT): a proposal,” in Journal of Computers, Chicago, 2015. [9] B. A. Kitchenham, “Systematic Review in Software Engineering: Where We Are and Where We Should Be Going,” in Proceedings of the 2Nd International Workshop on Evidential Assessment of Software Technologies, New York, NY, USA, 2012, pp. 1-2. [10] F. Hakimpour and A. Geppert, “Resolving Semantic Heterogeneity in Schema Integration,” in Proceedings of the International Conference on Formal Ontology in Information Systems - Volume 2001, New York, NY, USA, 2001, pp. 297-308. [11] F. Castanedo, “A Review of Data Fusion Techniques,” Sci. World J., vol. 2013, p. e704504, Oct. 2013. [12] W. Zou and W. Sun, “A Multi-dimensional Data Association Algorithm for Multi-sensor Fusion,” in Intelligent Science and Intelligent Data Engineering, J. Yang, F. Fang, and C. Sun, Eds. Springer Berlin Heidelberg, 2013, pp. 280-288. [13] S. Lloyd, “Least Squares Quantization in PCM,” IEEE Trans Inf Theor, vol. 28, no. 2, pp. 129-137, Sep. 2006. [14] A. W. Michael Shindler, “Fast and Accurate k-means For Large Datasets,” 2011. [15] S. K. Chang, E. Jungert, and X. Li, “A progressive query language and interactive reasoner for information fusion support,” Inf. Fusion, vol. 8, no. 1, pp. 70-83, Jan. 2007. [16] T. Aluja-Banet, J. Daunis-i-Estadella, and D. Pellicer, “GRAFT, a complete system for data fusion,” Comput. Stat. Data Anal., vol. 52, no. 2, pp. 635-649, Oct. 2007. [17] D. M. Hawkins, “Introduction,” in Identification of Outliers, Springer Netherlands, 1980, pp. 1-12. Revista Ingenierías Universidad de Medellín
A systematic review of data quality issues in knowledge discovery tasks
145
[18] A. Daneshpazhouh and A. Sami, “Entropy-based outlier detection using semi-supervised approach with few positive examples,” Pattern Recognit. Lett., vol. 49, pp. 77-84, Nov. 2014. [19] W. Yalin, X. Wenping, W. Xiaoli, and C. Bin, “Study on online outlier detection method based on principal component analysis and Bayesian classification,” in Control Conference (CCC), 2013 32nd Chinese, 2013, pp. 7803-7808. [20] B. Liang, “A hierarchical clustering based global outlier detection method,” in 2010 IEEE Fifth International Conference on Bio-Inspired Computing: Theories and Applications (BIC-TA), 2010, pp. 1213-1215. [21] R. Pamula, J. K. Deka, and S. Nandi, “An Outlier Detection Method Based on Clustering,” in 2011 Second International Conference on Emerging Applications of Information Technology (EAIT), 2011, pp. 253-256. [22] J. Qu, W. Qin, Y. Feng, and Y. Sai, “An Outlier Detection Method Based on Voronoi Diagram for Financial Surveillance,” in International Workshop on Intelligent Systems and Applications, 2009. ISA 2009, 2009, pp. 1-4. [23] J. Liu and H. Deng, “Outlier detection on uncertain data based on local information,” Knowl.Based Syst., vol. 51, pp. 60-71, Oct. 2013. [24] B. Mogoş, “Exploratory data analysis for outlier detection in bioequivalence studies,” Biocybern. Biomed. Eng., vol. 33, no. 3, pp. 164-170, 2013. [25] D. Cucina, A. di Salvatore, and M. K. Protopapas, “Outliers detection in multivariate time series using genetic algorithms,” Chemom. Intell. Lab. Syst., vol. 132, pp. 103-110, Mar. 2014. [26] J. Shen, J. Liu, R. Zhao, and X. Lin, “A Kd-Tree-Based Outlier Detection Method for Airborne LiDAR Point Clouds,” in 2011 International Symposium on Image and Data Fusion (ISIDF), 2011, pp. 1-4. [27] X. Peng, J. Chen, and H. Shen, “Outlier detection method based on SVM and its application in copper-matte converting,” in Control and Decision Conference (CCDC), 2010 Chinese, 2010, pp. 628-631. [28] H. Xiong, G. Pandey, M. Steinbach, and V. Kumar, “Enhancing data analysis with noise removal,” IEEE Trans. Knowl. Data Eng., vol. 18, no. 3, pp. 304-319, Mar. 2006. [29] V. Chandola, A. Banerjee, and V. Kumar, “Anomaly Detection: A Survey,” ACM Comput Surv, vol. 41, no. 3, pp. 15:1-15:58, Jul. 2009. [30] N. Verbiest, E. Ramentol, C. Cornelis, and F. Herrera, “Preprocessing noisy imbalanced datasets using SMOTE enhanced with fuzzy rough prototype selection,” Appl. Soft Comput., vol. 22, pp. 511-517, Sep. 2014. [31] Z. J. Ding and Y.-Q. Zhang, “Additive noise analysis on microarray data via SVM classification,” in 2010 IEEE Symposium on Computational Intelligence in Bioinformatics and Computational Biology (CIBCB), 2010, pp. 1-7. Revista Ingenierías Universidad de Medellín, vol. 15, No. 28 pp. 125-150 ISSN 1692 - 3324 - enero-junio de 2016/324 p. Medellín, Colombia
146
David Camilo Corrales - Agapito Ledezma - Juan Carlos Corrales
[32] H. Yin, H. Dong, and Y. Li, “A Cluster-Based Noise Detection Algorithm,” in 2009 First International Workshop on Database Technology and Applications, 2009, pp. 386-389. [33] S. R. Kannan, R. Devi, S. Ramathilagam, and K. Takezawa, “Effective FCM Noise Clustering Algorithms in Medical Images,” Comput Biol Med, vol. 43, no. 2, pp. 73-83, Feb. 2013. [34] Y.-L. He, Z.-Q. Geng, Y. Xu, and Q.-X. Zhu, “A hierarchical structure of extreme learning machine (HELM) for high-dimensional datasets with noise,” Neurocomputing, vol. 128, pp. 407-414, Mar. 2014. [35] K. Hayashi, “A simple extension of boosting for asymmetric mislabeled data,” Stat. Probab. Lett., vol. 82, no. 2, pp. 348-356, Feb. 2012. [36] B. Sluban and N. Lavrač, “Relating ensemble diversity and performance: A study in class noise detection,” Neurocomputing, vol. 160, pp. 120-131, Jul. 2015. [37] P. Shen, S. Tamura, and S. Hayamizu, “Feature reconstruction using sparse imputation for noise robust audio-visual speech recognition,” in Signal Information Processing Association Annual Summit and Conference (APSIPA ASC), 2012 Asia-Pacific, 2012, pp. 1-4. [38] B. Frenay and M. Verleysen, “Classification in the Presence of Label Noise: A Survey,” IEEE Trans. Neural Netw. Learn. Syst., vol. 25, no. 5, pp. 845-869, May 2014. [39] C. Catal, O. Alan, and K. Balkan, “Class noise detection based on software metrics and ROC curves,” Inf. Sci., vol. 181, no. 21, pp. 4867-4877, Nov. 2011. [40] I. B. Aydilek and A. Arslan, “A hybrid method for imputation of missing values using optimized fuzzy c-means with support vector regression and a genetic algorithm,” Inf. Sci., vol. 233, pp. 25-35, Jun. 2013. [41] F. Qin and J. Lee, “Dynamic Methods for Missing Value Estimation for DNA Sequences,” in 2010 International Conference on Computational and Information Sciences (ICCIS), 2010, pp. 442-445. [42] S. Zhang, Z. Jin, and X. Zhu, “Missing data imputation by utilizing information within incomplete instances,” J. Syst. Softw., vol. 84, no. 3, pp. 452-459, Mar. 2011. [43] B. Lotfi, M. Mourad, M. B. Najiba, and E. Mohamed, “Treatment methodology of erroneous and missing data in wind farm dataset,” in 2011 8th International Multi-Conference on Systems, Signals and Devices (SSD), 2011, pp. 1-6. [44] Z. Sahri, R. Yusof, and J. Watada, “FINNIM: Iterative Imputation of Missing Values in #x00A0;Dissolved Gas Analysis Dataset,” IEEE Trans. Ind. Inform., vol. 10, no. 4, pp. 20932102, Nov. 2014. [45] P. Keerin, W. Kurutach, and T. Boongoen, “An improvement of missing value imputation in DNA microarray data using cluster-based LLS method,” in 2013 13th International Symposium on Communications and Information Technologies (ISCIT), 2013, pp. 559-564. Revista Ingenierías Universidad de Medellín
A systematic review of data quality issues in knowledge discovery tasks
147
[46] F. O. de França, G. P. Coelho, and F. J. Von Zuben, “Predicting missing values with biclustering: A coherence-based approach,” Pattern Recognit., vol. 46, no. 5, pp. 1255-1266, May 2013. [47] W. Insuwan, U. Suksawatchon, and J. Suksawatchon, “Improving missing values imputation in collaborative filtering with user-preference genre and singular value decomposition,” in 2014 6th International Conference on Knowledge and Smart Technology (KST), 2014, pp. 87-92. [48] T.-P. Hong and C.-W. Wu, “Mining rules from an incomplete dataset with a high missing rate,” Expert Syst. Appl., vol. 38, no. 4, pp. 3931-3936, Apr. 2011. [49] K. Jiang, H. Chen, and S. Yuan, “Classification for Incomplete Data Using Classifier Ensembles,” in International Conference on Neural Networks and Brain, 2005. ICNN B ’05, 2005, vol. 1, pp. 559-563. [50] C.-H. Wu, C.-H. Wun, and H.-J. Chou, “Using association rules for completing missing data,” in Fourth International Conference on Hybrid Intelligent Systems, 2004. HIS ’04, 2004, pp. 236-241. [51] A. C. Yang, H.-H. Hsu, and M.-D. Lu, “Imputing missing values in microarray data with ontology information,” in 2010 IEEE International Conference on Bioinformatics and Biomedicine Workshops (BIBMW), 2010, pp. 535-540. [52] R. Blagus and L. Lusa, “Evaluation of SMOTE for High-Dimensional Class-Imbalanced Microarray Data,” in 2012 11th International Conference on Machine Learning and Applications (ICMLA), 2012, vol. 2, pp. 89-94. [53] F. Koto, “SMOTE-Out, SMOTE-Cosine, and Selected-SMOTE: An enhancement strategy to handle imbalance in data level,” in 2014 International Conference on Advanced Computer Science and Information Systems (ICACSIS), 2014, pp. 280-284. [54] Y. Cheung and F. Gu, “A direct search algorithm based on kernel density estimator for nonlinear optimization,” in 2014 10th International Conference on Natural Computation (ICNC), 2014, pp. 297-302. [55] M. B. Abidine, N. Yala, B. Fergani, and L. Clavier, “Soft margin SVM modeling for handling imbalanced human activity datasets in multiple homes,” in 2014 International Conference on Multimedia Computing and Systems (ICMCS), 2014, pp. 421-426. [56] A. Adam, I. Shapiai, Z. Ibrahim, M. Khalid, L. C. Chew, L. W. Jau, and J. Watada, “A Modified Artificial Neural Network Learning Algorithm for Imbalanced Data Set Problem,” in 2010 Second International Conference on Computational Intelligence, Communication Systems and Networks (CICSyN), 2010, pp. 44-48. [57] A. Adam, L. C. Chew, M. I. Shapiai, L. W. Jau, Z. Ibrahim, and M. Khalid, “A Hybrid Artificial Neural Network-Naive Bayes for solving imbalanced dataset problems in semiconductor manufacturing test process,” in 2011 11th International Conference on Hybrid Intelligent Systems (HIS), 2011, pp. 133-138. Revista Ingenierías Universidad de Medellín, vol. 15, No. 28 pp. 125-150 ISSN 1692 - 3324 - enero-junio de 2016/324 p. Medellín, Colombia
148
David Camilo Corrales - Agapito Ledezma - Juan Carlos Corrales
[58] N. A. Abolkarlou, A. A. Niknafs, and M. K. Ebrahimpour, “Ensemble imbalance classification: Using data preprocessing, clustering algorithm and genetic algorithm,” in 2014 4th International eConference on Computer and Knowledge Engineering (ICCKE), 2014, pp. 171-176. [59] C. Galarda Varassin, A. Plastino, H. C. Da Gama Leitao, and B. Zadrozny, “Undersampling Strategy Based on Clustering to Improve the Performance of Splice Site Classification in Human Genes,” in 2013 24th International Workshop on Database and Expert Systems Applications (DEXA), 2013, pp. 85-89. [60] J. Liang, L. Bai, C. Dang, and F. Cao, “The -Means-Type Algorithms Versus Imbalanced Data Distributions,” IEEE Trans. Fuzzy Syst., vol. 20, no. 4, pp. 728-745, Aug. 2012. [61] G. Y. Wong, F. H. F. Leung, and S.-H. Ling, “A novel evolutionary preprocessing method based on over-sampling and under-sampling for imbalanced datasets,” in IECON 2013 - 39th Annual Conference of the IEEE Industrial Electronics Society, 2013, pp. 2354-2359. [62] W. Mingnan, J. Watada, Z. Ibrahim, and M. Khalid, “Building a Memetic Algorithm Based Support Vector Machine for Imbalaced Classification,” in 2011 Fifth International Conference on Genetic and Evolutionary Computing (ICGEC), 2011, pp. 389-392. [63] T. Z. Tan, G. S. Ng, and C. Quek, “Complementary Learning Fuzzy Neural Network: An Approach to Imbalanced Dataset,” in International Joint Conference on Neural Networks, 2007. IJCNN 2007, 2007, pp. 2306-2311. [64] G. Y. Wong, F. H. F. Leung, and S.-H. Ling, “An under-sampling method based on fuzzy logic for large imbalanced dataset,” in 2014 IEEE International Conference on Fuzzy Systems (FUZZ-IEEE), 2014, pp. 1248-1252. [65] J. A. Olvera-López, J. A. Carrasco-Ochoa, J. F. Martínez-Trinidad, and J. Kittler, “A review of instance selection methods,” Artif. Intell. Rev., vol. 34, no. 2, pp. 133-143, May 2010. [66] S. Khalid, T. Khalil, and S. Nasreen, “A survey of feature selection and feature extraction techniques in machine learning,” in Science and Information Conference (SAI), 2014, 2014, pp. 372-378. [67] G. Kalpana, R. P. Kumar, and T. Ravi, “Classifier based duplicate record elimination for query results from web databases,” in Trendz in Information Sciences Computing (TISC), 2010, 2010, pp. 50-53. [68] B. Martins, H. Galhardas, and N. Goncalves, “Using Random Forest classifiers to detect duplicate gazetteer records,” in 2012 7th Iberian Conference on Information Systems and Technologies (CISTI), 2012, pp. 1-4. [69] Y. Pei, J. Xu, Z. Cen, and J. Sun, “IKMC: An Improved K-Medoids Clustering Method for Near-Duplicated Records Detection,” in International Conference on Computational Intelligence and Software Engineering, 2009. CiSE 2009, 2009, pp. 1-4. [70] X. Mansheng, L. Youshi, and Z. Xiaoqi, “A property optimization method in support of approximately duplicated records detecting,” in IEEE International Conference on Intelligent Computing and Intelligent Systems, 2009. ICIS 2009, 2009, vol. 3, pp. 118-122. Revista Ingenierías Universidad de Medellín
A systematic review of data quality issues in knowledge discovery tasks
149
[71] L. D. Avendaño-Valencia, J. D. Martínez-Vargas, E. Giraldo, and G. Castellanos-Domíngue, “Reduction of irrelevant and redundant data from TFRs for EEG signal classification,” Conf. Proc. Annu. Int. Conf. IEEE Eng. Med. Biol. Soc. IEEE Eng. Med. Biol. Soc. Annu. Conf., vol. 2010, pp. 4010-4013, 2010. [72] Q. Hua, M. Xiang, and F. Sun, “An optimal feature selection method for approximately duplicate records detecting,” in 2010 The 2nd IEEE International Conference on Information Management and Engineering (ICIME), 2010, pp. 446-450. [73] M. Finger and F. S. Da Silva, “Temporal data obsolescence: modelling problems,” in Fifth International Workshop on Temporal Representation and Reasoning, 1998. Proceedings, 1998, pp. 45-50. [74] A. Maydanchik, Data Quality Assessment. Technics Publications, 2007. [75] J. Debenham, “Knowledge Decay in a Normalised Knowledge Base,” in Database and Expert Systems Applications, M. Ibrahim, J. Küng, and N. Revell, Eds. Springer Berlin Heidelberg, 2000, pp. 417-426. [76] G. Cormode, V. Shkapenyuk, D. Srivastava, and B. Xu, “Forward Decay: A Practical Time Decay Model for Streaming Systems,” in Proceedings of the 2009 IEEE International Conference on Data Engineering, Washington, DC, USA, 2009, pp. 138-149. [77] M. Placide and Y. Lasheng, “Information Decay in Building Predictive Models Using Temporal Data,” in 2010 International Symposium on Information Science and Engineering (ISISE), 2010, pp. 458-462. [78] M. E. Cintra, C. A. A. Meira, M. C. Monard, H. A. Camargo, and L. H. A. Rodrigues, “The use of fuzzy decision trees for coffee rust warning in Brazilian crops,” in 2011 11th International Conference on Intelligent Systems Design and Applications (ISDA), 2011, pp. 1347-1352. [79] D. C. Corrales, A. J. P. Q, C. León, A. Figueroa, and J. C. Corrales, “Early warning system for coffee rust disease based on error correcting output codes: a proposal,” Rev. Ing. Univ. Medellín, vol. 13, no. 25, 2014. [80] D. C. Corrales, A. Ledezma, A. J. P. Q, J. Hoyos, A. Figueroa, and J. C. Corrales, “A new dataset for coffee rust detection in Colombian crops base on classifiers,” Sist. Telemática, vol. 12, no. 29, pp. 9-23, Jun. 2014. [81] D. C. C. Corrales, J. C. Corrales, and A. Figueroa-Casas, “Toward detecting crop diseases and pest by supervised learning,” Ing. Univ., vol. 19, no. 1, 2015. [82] D. C. Corrales, A. Figueroa, A. Ledezma, and J. C. Corrales, “An Empirical Multi-classifier for Coffee Rust Detection in Colombian Crops,” in Computational Science and Its Applications -- ICCSA 2015, O. Gervasi, B. Murgante, S. Misra, M. L. Gavrilova, A. M. A. C. Rocha, C. Torre, D. Taniar, and B. O. Apduhan, Eds. Springer International Publishing, 2015, pp. 60-74.
Revista Ingenierías Universidad de Medellín, vol. 15, No. 28 pp. 125-150 ISSN 1692 - 3324 - enero-junio de 2016/324 p. Medellín, Colombia