Future Generation Computer Systems 21 (2005) 163–188
A taxonomy of grid monitoring systems Serafeim Zanikolas∗ , Rizos Sakellariou School of Computer Science, The University of Manchester, Oxford Road, Manchester M13 9PL, Manchester, UK Received 17 December 2003; accepted 28 July 2004 Available online 8 October 2004
Abstract Monitoring is the act of collecting information concerning the characteristics and status of resources of interest. Monitoring grid resources is a lively research area given the challenges and manifold applications. The aim of this paper is to advance the understanding of grid monitoring by introducing the involved concepts, requirements, phases, and related standardisation activities, including Global Grid Forum’s Grid Monitoring Architecture. Based on a refinement of the latter, the paper proposes a taxonomy of grid monitoring systems, which is employed to classify a wide range of projects and frameworks. The value of the offered taxonomy lies in that it captures a given system’s scope, scalability, generality and flexibility. The paper concludes with, among others, a discussion of the considered systems, as well as directions for future research. © 2004 Elsevier B.V. All rights reserved. Keywords: Grid monitoring; Grid Information Services; Grid Monitoring Architecture
1. Introduction The grid is perceived as a large-scale distributed system that supports scattered communities to form Virtual Organisations [1], in order to collaborate for the realisation of common goals. This collaboration takes the form of managed sharing of on-line resources (e.g., software, hardware, data, instruments). However, grid resources, may dynamically join and leave, hence featuring a membership which varies over time; even in ∗ Corresponding author. Tel.: +44 161 275 6160; fax: +44 161 275 6236. E-mail addresses:
[email protected] (S. Zanikolas),
[email protected] (R. Sakellariou)
0167-739X/$ – see front matter © 2004 Elsevier B.V. All rights reserved. doi:10.1016/j.future.2004.07.002
fairly static settings, resource availability is subject to failures. Given this transient nature, users must be supported in finding and keeping track of resources of interest; this is the main purpose of Grid Information Services (GIS) [2,3]. In order for information services to address the mentioned user needs, they must systematically collect information regarding the current and, sometimes, past status of grid resources; a process known as monitoring. In addition to information services, monitoring is also crucial in a variety of cases such as scheduling, data replication, accounting, performance analysis and optimisation of distributed systems or individual applications, self-tuning applications, and many more [4]. Also, given the increasing number of grid resources,
164
S. Zanikolas, R. Sakellariou / Future Generation Computer Systems 21 (2005) 163–188
real-time monitoring of their availability and utilisation is becoming essential for effective management, particularly regarding the detection of faults and bottlenecks and in some cases even their automatic resolution. Finally, identifying patterns of utilisation may form valuable input for long-term resource planning of grid infrastructures. One may wonder how monitoring in the context of the grid differs from traditional monitoring of computer-related resources, which has been a research topic for several decades (e.g., [5]). Grid monitoring is characterised by significant requirements including, among others, scalable support for both pull and push data delivery models applied over vast amounts of current and past monitoring data that may be distributed across organisations. In addition, a monitoring system’s data format has to balance between extensibility and self-description on one hand and compactness on the other. The former is required to accommodate the everexpanding types of monitored resources, whereas the latter is a prerequisite for non-intrusive and scalable behaviour. The problem is further complicated by the continuous evolution of grid middleware and the lack of consensus regarding data representation, protocols and semantics, leading to ad hoc solutions of limited interoperability. Existing proprietary network and host monitoring applications lack the openness required for interoperability and customisation, while they also impose significant financial costs. Few of the equivalent open source projects have a potential and in fact some of them are actually employed for grid monitoring. The aim of this document is to advance the understanding of the issues involved in grid monitoring, and to provide a classification of related projects. The paper’s main contribution is a taxonomy of grid monitoring systems and its application in a wide range of monitoring systems. The key feature of the suggested taxonomy is that it allows the classification of monitoring systems based on the provision and characteristics of components defined in Global Grid Forum’s Grid Monitoring Architecture (GMA) [6]. The value of the proposed taxonomy lies in that it reflects a given system’s scope and consequently generality, scalability and flexibility. The structure of the remainder of the paper is as follows. The next section defines the involved concepts, sets the requirements of the considered problem, briefly describes the process of monitoring, and outlines the
Grid Monitoring Architecture and other standardisation/recommendation efforts promoted by the Global Grid Forum (GGF). In Section 3, we propose a taxonomy of monitoring systems. Sections 4–7 classify the considered systems in order of increasing scope, according to the proposed taxonomy. Section 8 briefly considers related work which is not intended to deliver implemented systems. The paper is complemented, in Section 9, by a summary and discussion of the considered systems, and concluded in Section 10.
2. Background This section introduces the basic concepts and related terminology, as well as the main phases of a monitoring model. A brief explanation of the most evident requirements for monitoring systems, and an overview of GGF’s Grid Monitoring Architecture, as well as other standardisation activities follows. 2.1. Concepts and terminology Having defined the type of monitoring we are concerned with, it is important to note that people use different terms to refer to, more or less, the same concepts. To this end, we explicitly set the following terms, mainly drawn from [6]: An entity as defined in [7], is any networked resource, which can be considered useful, unique, having a considerable lifetime and general use. Typical entities are processors, memories, storage mediums, network links, applications and processes. An event is a collection of timestamped, typed data, associated with an entity, and represented in a specific structure. An event type is an identifier which uniquely maps to an event structure. An event schema or simply schema, defines the typed structure and semantics of all events so that, given an event type, one can find the structure and interpret the semantics of the corresponding event. A sensor is a process monitoring an entity and generating events. Sensors are distinguished in passive (i.e., use readily available measurements, typically from operating system facilities) and ac-
S. Zanikolas, R. Sakellariou / Future Generation Computer Systems 21 (2005) 163–188
tive (i.e., estimate measurements using custom benchmarks). The former typically provide OSspecific measurements while the latter are more intrusive. 2.2. The monitoring process Monitoring distributed systems, and hence grids, typically includes four stages [8,9]: (i) generation of events, that is, sensors enquiring entities and encoding the measurements according to a given schema; (ii) processing of generated events is application-specific and may take place during any stage of the monitoring process, typical examples include filtering according to some predefined criteria, or summarising a group of events (i.e., computing the average); (iii) distribution refers to the transmission of the events from the source to any interested parties; (iv) finally, presentation typically involves some further processing so that the overwhelming number of received events will be provided in a series of abstractions in order to enable an end-user to draw conclusions about the operation of the monitored system. A presentation, typically provided by a GUI application making use of visualisation techniques, may either use a real-time stream of events or a recorded trace usually retrieved from an archive. However, in the context of grids, we generalise the last stage as consumption since the users of the monitoring information are not necessarily humans and therefore visualisation may not be involved. 2.3. Requirements A set of general requirements for monitoring systems that are considered important follows; these may vary considerably depending on the use cases that need to be supported by a specific system. Scalability: Monitoring systems have to cope efficiently with a growing number of resources, events and users. This scalability can be achieved as a result of good performance and low intrusiveness. The former guarantees that a monitoring system will achieve the needed throughput within an acceptable response time in a variety of load scenarios. The latter refers to the intrusiveness imposed by the monitoring system to the entities being monitored. Intrusiveness is typically measured as a function of host (processor, memory, I/O) and network load (bandwidth) generated by the
165
collection, processing and distribution of events. It can be seen that a monitoring system with moderate performance will be insufficient in heavy load scenarios (many resources and/or users), whereas a system inflicting non-trivial intrusiveness degrades the capacity of the monitored resources. Extensibility: A monitoring system must be extensible with respect to the supported resources and hence the events generated by the latter. To this end, desirable features include (i) an extensible and self-describing event encoding method (i.e., data format); (ii) an event schema service which allows controlled and dynamic extensions/modifications; (iii) a producer-consumer protocol that can accommodate new event types. At the same time, (i) and (iii) must be compact to minimise the previously described intrusiveness, which is so important for scalability. Data delivery models: Monitoring information includes fairly static (e.g., software and hardware configuration of a given node) and dynamic events (e.g., current processor load, memory), which suggests the use of different measurement policies (e.g., periodic or on demand). In addition, consumer patterns may vary from sparse interactions to long lived subscriptions for receiving a constant stream of events. In this regard, the monitoring system must support both pull and push data delivery models (further discussed in the next section). Portability: The portability of a monitoring system, and particularly that of the sensors, is of major importance; otherwise a system is unable to monitor specific types of resources, and hence support their visibility on the grid [10]. The concept of portability also applies to the generated events, meaning that any encapsulated measurements must be platform independent. Security: Certain scenarios may require a monitoring service to support security services such as access control, single or mutual authentication of parties, and secure transport of monitoring information. In addition, we have already mentioned that an event is a collection of timestamped typed data; hence a timestamp is required to allow consumers to estimate an event’s freshness. This in turn suggests the requirement for a global notion of time between the components of a monitoring system and its users. A global notion of time in the Grid is needed anyhow (e.g., for security services), but in the context of monitoring there is a need for a much higher accuracy of clock synchronisation
166
S. Zanikolas, R. Sakellariou / Future Generation Computer Systems 21 (2005) 163–188
Fig. 1. The GGF Grid Monitoring Architecture.
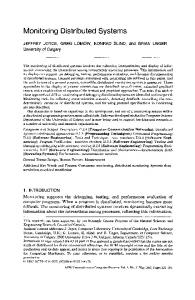
than what can be provided by established technologies (such as the Network Time Protocol [11]). 2.4. A Grid Monitoring Architecture In this section, we provide a brief overview of the Grid Monitoring Architecture (GMA) [6] put together by the Global Grid Forum to encourage discussion and implementations (i.e., it is not a standard). The main components of GMA are as follows (Fig. 1): A producer is a process implementing at least one producer Application Programming Interface (API) for providing events. A consumer is any process that receives events by using an implementation of at least one consumer API. A registry is a lookup service that allows producers to publish the event types they generate, and consumers to find out the events they are interested in.1 Additionally, a registry holds the details required for establishing communication with registered parties (e.g., address, supported protocol bindings, security requirements). Even for systems with no notion of events, registries can be useful for producers and consumers discovering each other. Interactions: After discovering each other through the registry, producers and consumers communicate directly (i.e., not through the registry). GMA defines three types of interactions between producers and consumers. Publish/subscribe refers to a three-phase inter1 The GMA document [6] refers to the registry as a directory service, which implies a Lightweight Directory Access Protocol (LDAP) -based engine. To this end, and in agreement with [12], we prefer the term registry because it is engine-neutral.
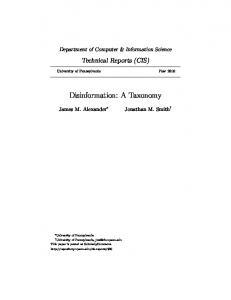
Fig. 2. A republisher implements both producer and consumer interfaces.
action consisting of a subscription for a specific event type, a stream of events from a producer to a consumer, and a termination of the subscription. Both the establishment and the termination of a subscription can be initiated by any of the two parties. A query/response is an one-off interaction initiated by a consumer and followed by a single producer response containing one or more events. Finally, a notification can be sent by a producer to a consumer without any further interactions. In addition to the three core components, the GMA defines a republisher (referred as compound component or intermediary) and a schema repository. A republisher is any single component implementing both producer and consumer interfaces (Fig. 2) for reasons such as filtering, aggregating, summarising, broadcasting, and caching. A schema repository holds the event schema, that is, the collection of defined event types. If a system is to support an extensible event schema, such a repository must have an interface for dynamic and controlled addition, modification and removal of any custom event types. Republishers and the schema repository are considered as optional components, though one can easily see that they are essential parts of any sophisticated monitoring framework. The schema repository may be part of the registry, but in any case these two components must be replicated and distributed to allow for distribution of load and robustness. The GMA, being an architecture, does not define implementation details such as employed data model, event schema, protocol bindings, registry engine and so
S. Zanikolas, R. Sakellariou / Future Generation Computer Systems 21 (2005) 163–188
167
Fig. 3. Mapping GMA components to phases of monitoring. Square brackets and parenthesis indicate optional and grouped expressions respectively, whereas “+” stands for at least one repetition of the preceding item (see text for further explanation).
on. Probably the most important feature of the GMA is the separation of the discovery and retrieval operations (i.e., discover from the registry and retrieve from producers or republishers). Revisiting GMA: Because GMA’s components are fairly general, we correlate its main components to the phases of the monitoring process (as described in Section 2.2). As shown in Fig. 3, a sensor (shown by a circle) must generate events (i.e., the first phase of monitoring), may process them and may make them available to local consumers only (e.g., through a local file); a producer (depicted as a box) may implement its own sensors, may process events (generated by built-in or external sensors) and must support their distribution to remote consumers, hence the producer interface; a republisher (shown as a rounded box) must apply some type of processing to collected events and make them available to other consumers; a hierarchy of republishers (shown as a polygon) consists of one or more (hence, the “+” sign) republishers; finally, a consumer (depicted as an ellipse) may apply some processing before presenting the results to the end-user or application. 2.5. Other recommendations and standards The Global Grid Forum, in addition to the GMA document, hosts several other activities that relate to grid monitoring. Among others, a simple XMLbased producer-consumer protocol is informally described in [13] to encourage interoperability. Regarding event types, the Network Measurements Working Group (NM-WG) is developing an XML schema for exchanging network performance measurements within the framework of the Open Grid Services Infrastructure (OGSI). On the same topic, the CIMbased Grid Schema Working Group (CGS-WG) is working towards the development of a Grid schema based on the Common Information Model (CIM) [14], an object oriented, platform-independent stan-
dard that provides the means for specifying conceptual information models for management systems. Another schema is the Grid Laboratory Uniform Environment (GLUE), developed as part of the DataTag project in order to facilitate interoperability between selected US and EU Grid sites. The GLUE schema has gained wide acceptance given its adoption by Globus MDS3. Finally, the Grid Benchmark Research Group (GB-WG) aims to specify metrics and benchmarks to promote, among others, quantitative comparability of grid hardware and middleware, applications, and practices.
3. A scope-oriented taxonomy of monitoring approaches and frameworks The previous section has refined the GMA components by mapping them to monitoring phases. This section proposes a taxonomy of monitoring systems, which is primarily concerned with a system’s provision of GMA components (as they were defined in Fig. 3). The categories of the proposed taxonomy are named from zero to three depending on the provision and characteristics of a system’s producers and republishers (Fig. 4). Level 0: Events flow from sensors to consumers in either an on-line or an offline fashion (i.e., at the time of measurements being taken or after-
Fig. 4. The categories of the proposed taxonomy of monitoring systems. Note that, although not shown to avoid clutter, the sensor symbol can be omitted in systems where producers have built-in sensors.
168
S. Zanikolas, R. Sakellariou / Future Generation Computer Systems 21 (2005) 163–188
wards, using a trace file). In the on-line case, the sensors store locally any measurements, which are accessed in an application-specific way. This typically is via a web interface that provides interactive access to HTML-formatted information that includes measurements, hence not what one would consider a generic API. The distinguishing feature of level zero or self-contained systems is the lack of producer APIs that would enable the distribution of events to remotely located components, in a programmable fashion (as opposed to non-programmable such as web pages intended for interactive use). Level 1: In first level systems, sensors are either separately implemented and hosted at the same machines with producers, or their functionality is provided by producers. In either case, events are remotely accessible via a generic API provided by producers. Level 2: In addition to producers, second level monitoring systems feature at least one type of republisher, which however has a fixed functionality. Republishers of different functionality may be stacked upon each other but only in predefined ways. A second level system is differentiated by a semantically equivalent first level system by the distribution of the functionality (that would otherwise be provided by a single producer) among different hosts. Level 3: Highly flexible monitoring systems, apart from producers, provide republishers that are configurable, allowing their organisation in an arbitrarily structured hierarchy. As explained earlier, in a hierarchy of republishers every node collects and processes events from lower level producers or republishers for reasons such as the provision of customised views or preparation of higher-level events. Third level systems have a potential for scalability and may form a standalone Grid Information Service (assuming support for a variety of grid resources). Whether they actually are scalable depends on the multiplicity and distribution of components according to the arbitrary hierarchy that is adopted in specific deployments. Since the actual scalability is configuration-dependent, the taxonomy simply highlights which systems have the potential for scalability.
The taxonomy includes a multiplicity qualifier to capture whether republishers in second level systems within an organisation are centralised (i.e., one republisher), merely distributed, or distributed with support for replication. The multiplicity (and distribution) of producers over sensors (in systems of all levels) is not significant since, according to the given definition, at least one producer is required per monitored host. The multiplicity of republishers over producers in third level systems can vary based on the adopted hierarchy. Another qualifier refers to the type of entities that are primarily monitored by a considered system. This qualifier can be any of hosts, networks, applications, availability and generic. The last one denoting generalpurpose systems that support events for at least hosts and networks. Last, the stackable qualifier denotes whether a monitoring system is intended to employ another system’s producers or republishers, in other words operate on top of it. A stackable, say, first level system can be more promising than a non-stackable system of the same level, because the former encapsulates (part of) the functionality of another monitoring system. Based on the above categories and qualifiers, considered systems are characterised using the form L{0-3}. {H,N,A,V,G}.[S], where the number denotes the level, the following letter the nature of monitored entities (Hosts, Networks, Applications, Availability, Generic), and an optional S implies whether the system is stackable. Specifically for second level systems, an a, b or c letter follows the level number to denote (a) a single centralised republisher; (b) more than one distributed republisher; (c) distributed republishers supporting data replication. For instance, L2c.H denotes a second level system concerning mainly hosts and having more than one republisher that supports data replication. Goals and audience: The goal of the taxonomy is to provide a simple means to describe a monitoring system’s features with respect to: (i) its compliance with core GMA components; (ii) main target of monitored entities (e.g., network, hosts, etc.); (iii) whether a system can or has to operate on top of another system. Developers would be primarily interested in systems that provide their functionality via APIs; thus they would be looking first for L1 systems. Administrators that are interested in performance or reliability will have to look for at least L2b (distributed republishers)
S. Zanikolas, R. Sakellariou / Future Generation Computer Systems 21 (2005) 163–188
169
A monitoring system is characterised as “selfcontained” when it does not expose its functionality through a producer interface. To this end, such a system can be used only in predefined and rigid ways (e.g., through a GUI). The considered self-contained systems, MapCenter and GridICE, support grid administrators in monitoring the availability (in the former) and utilisation (in the latter) of grid resources, through web front-ends.
MapCenter has a number of coordinated threads, polling specific ports of a set of hosts according to a configuration file. In addition, there is support for automatic discovery of UDP, TCP, and HTTP-based (e.g., grid) services, by means of probing to well-known ports [16]. MapCenter’s configuration along with the retrieved status information is kept in a flat text file. The latter is used to update periodically a set of HTML files which present the previously mentioned logical views. Of these, the graphical view illustrates the nodes on a geographical map using localisation information retrieved from the WHOIS Internet service. In the taxonomy’s context, MapCenter’s polling threads are considered sensors because they merely store locally any acquired events, as opposed to providing them via a producer API. To this end, MapCenter is classified as L0.V.S because it lacks producers (level zero), is concerned with hosts and services availability, and operates on top of existing information services (stackable). MapCenter can be converted to a first level system by providing the monitoring events through a producer API.
4.1. MapCenter (L0.V.S)
4.2. GridICE (L0.G.S)
MapCenter [15], developed as part of the EU DataGrid project, is a monitoring application which provides web users a visualisation of the availability and distribution of services throughout a Grid. It is intended as a grid administration tool for tracking availability problems. At the time of writing, MapCenter was deployed in more than 10 major grid installations, including the EU DataGrid. Overview: MapCenter builds and periodically updates a model of the network services available in a grid, and provides this information in several logical views (sites, Virtual Organisations (VOs), applications, geographical) through a web interface. It is important to note that the information provided by MapCenter is about the availability of grid nodes and their services (e.g., the daemons of Globus’ Monitoring and Discovery Service (MDS), etc.); hence MapCenter does not keep details concerning configuration and utilisation of resources. However, it does allow users to dynamically query an MDS server (using a PHP-based LDAP client), ping and otherwise interact with hosts (using CGI scripts).
GridICE [17], also known as the InterGrid Monitor Map and EDT-Monitor [18], was developed as part of the DataTag project in order to facilitate grid administrators. It provides status and utilisation information at Virtual Organisation, site and resource level, as well as basic statistics derived from historical traces and realtime alerts, all through a web front-end. Overview: GridICE has a centralised architecture where a main server periodically queries a set of nodes to extract information about the status of grid and network services, and the utilisation of resources. The main server is based on Nagios, an open source, host and network service monitor that can be easily extended by the use of custom monitoring and notification plugins. GridICE has an MDS plugin (see Section 7.2) for periodically querying Globus index information servers and information providers, whereas other plugins can be built, say, for RGMA. The collected information is stored in a DBMS and used to build aggregate statistics (e.g., total memory per site), trigger alerts and dynamically configure Nagios to monitor any newly discovered resources. End-users access the
and L2c (distributed and replicated republishers) systems, respectively; they can also identify systems that depend or may operate on top of other systems with the stackable qualifier. Users that need general-purpose systems that, when appropriately deployed, can scale beyond organisation-wide installations need to look for L3 systems. Users and others can also find useful the monitored entities qualifier to identify generic systems or those primarily concerned with hosts, networks, applications, or availability.
4. Level 0: self-contained systems
170
S. Zanikolas, R. Sakellariou / Future Generation Computer Systems 21 (2005) 163–188
service through a PHP-based web front-end which includes logical views at VO, site and entity level as well as a geographical map. GridICE employs a custom extension of the GLUE schema in order to support network-, and processrelated events. There are concerns in terms of scalability given the centralised architecture and the frequent polling that has to be performed. A way of resolving this could be to distribute the overall load among several Nagios servers organised in a hierarchy. GridICE is a rather uncommon system in that it has its own sensors for taking raw measurements within monitored hosts and uses Globus MDS as producers of those measurements. A Nagios server collects events from MDS daemons as described earlier, constructs higher-level events and provides them through the web. The Nagios server republishes raw measurements as useful abstractions, yet without a producer API and thus cannot be considered a republisher. On this basis, GridICE can be classified either as a zero or a first level system depending on whether the information of interest is the abstracted events or the raw measurements, respectively. GridICE can be converted to a second level system by providing its abstractions via a producer API.
5. Level 1: producer-only systems As an example of a first level system, this section presents Autopilot, a framework for implementing selfadapting applications. 5.1. Autopilot (L1.A) Autopilot [19] is a framework for enabling applications to dynamically adapt to changing environments. This run-time tuning ability is important for applications having to choose among a variety of policies (e.g., schedulers) as well as those that need to adapt to a dynamic environment, such as the grid. Autopilot’s main ideas are leveraged in the grid Application Development Software (GrADS) project [20], which aims to facilitate end-users in the development, execution and tuning of grid enabled applications. In GrADS, grid applications are characterised with performance requirements (specified in so-called “contracts”); among others, a real-time monitor compares an application’s
progress against the requirements of its contract and triggers corrective actions in case of violations. Overview: Application adaptivity requires realtime performance measurements (i.e., generation of application-specific events), reasoning whether there is a need for a corrective action and, if so, instructing the application to perform the latter. Autopilot’s functionality is implemented in separate components, namely sensors, actuators, clients and distributed name servers. Applications instrumented for Autopilot include sensors and actuators for remotely reading and writing respectively, application-level variables. Sensors and actuators are described by property lists (e.g., name, location, type of variable measured/controlled, etc.), have attached functions and register themselves to a name service (i.e., a registry). Property lists are used by clients (i.e., consumers) to lookup in the registry for sensors. Attached functions implement data reduction techniques (e.g., summarisation) in case of sensors or perform requested actions in case of actuators. An Autopilot client finds out “interesting” sensors through the registry and subscribes for receiving their events. Subsequently, a client uses an applicationspecific logic—that is defined as a fuzzy logic rule base—to make decisions and, if applicable, instruct an actuator to perform adaptive actions. In addition, clients manage sensors, in terms of activation and sampling frequency, through appropriate actuators. Autopilot’s events are represented in either binary or ASCII encodings according to the Pablo Self-Defining Data Format [21]. As the name implies, SDDF encoded events include descriptions of their structure, though the actual semantics are not specified. The binary format can be employed between machines of same or different byte order conventions, whereas the ASCII encoding must be used in cases of different word length or floating point representations. In the context of the taxonomy, the Autopilot sensors operate as producers since they not only take measurements but also provide the means for accessing them remotely. Combined with the focus on application monitoring, Autopilot is classified as L1.A.
6. Level 2: producer and republisher systems This section is concerned with monitoring systems that include producers and one or more special pur-
S. Zanikolas, R. Sakellariou / Future Generation Computer Systems 21 (2005) 163–188
pose republishers. The considered systems, described in alphabetical order, are listed here under the three subcategories of second level systems. Centralised republisher: an administration oriented monitoring framework based on the CODE framework; Hawkeye, an administration oriented system for monitoring and management of computer clusters; GridRM, a proposal for integrating the diverse monitoring sources typically available in a grid site. Distributed republishers: HBM, an unreliable fault detector of fail-stop failures; JAMM, a host monitoring prototype with managed sensors; Mercury, GridLab’s organisation-level monitoring system; NetLogger, an application performance analysis toolkit that was extended with components for providing a producer interface and controlling application-level sensors; OCM-G, an interactive-applications monitoring system for execution steering and performance analysis; Remos, a prototype similar to NWS that additionally provides logical views of network topologies; SCALEA-G, an extensible, serviceoriented monitoring and performance analysis system for both applications and resources. Distributed republishers with replication: NWS, a network monitoring and forecasting service providing end-to-end measurements and predictions. 6.1. CODE-based monitoring system (L2a.G) The considered system [22] is concerned with monitoring and managing organisation-wide Globus-based grid installations, and is used in the NASA Information Power Grid (IPG). It is based on CODE [23], a framework for Control and Observation in Distributed Environments, primarily intended to facilitate computer systems administration. Overview: The CODE framework includes observers, actors, managers and a directory service. Each observer process manages a set of sensors and provides their events through an event producer interface, hence acting as a producer. Every actor process can be asked, through an actor interface, to perform specific actions, such as restarting a daemon or sending an email. A manager process consumes the events from one or more
171
producers and, based on a management logic (a series of if-then statements, or an expert system), instructs actors to perform specific actions. Producers and actors register their location, events and actions in an LDAP-based registry where managers lookup for the appropriate producers and actors. A management agent, consisting of an observer, an actor and a manager, is placed in each Grid Resource and Allocation Manager (GRAM) and Grid Information Service (GIS) server of a Globus installation. Events generated by management agents are forwarded to an event archive which is discovered through the registry. A GUI management front-end (i.e., a consumer) retrieves events from the archive (a republisher) to illustrate the current status of hosts and networks. Also, the management application allows a user to perform simple actions, such as Globus daemons and user accounts management, based on what is advertised in the registry. The GGF’s XML producer-consumer protocol is employed for exchanging events, while the event archive is an XML database queried using XPath. The CODE monitoring system is intended for hosts, networks and services, and has a single instance of a republisher per installation and thus is classified as L2a.G. 6.2. GridRM (L2a.H.S) Grid Resource Monitoring (GridRM) [24] is a research project that aims to provide a unified way of accessing a diverse set of monitoring data sources, that are typically found in grid environments (e.g., Simple Network Management Protocol (SNMP) [25], Ganglia, NetLogger, Network Weather Service (NWS), etc.).2 Overview: In GridRM, every organisation has a Java-based gateway that collects and normalises events from local monitoring systems. In this respect, every gateway operates as a republisher of external (to GridRM) producers. A global registry is used to support consumers in discovering gateways providing information of interest. Each gateway consists of a global and a local layer. The former includes an abstract layer which interfaces with platform-specific consumer APIs (Java, Web/Grid Services, etc.) and a security layer that applies an or2
Ganglia, NetLogger and NWS are considered in later sections.
172
S. Zanikolas, R. Sakellariou / Future Generation Computer Systems 21 (2005) 163–188
ganisation’s access control policy. The local layer, has several components including an abstract data layer and a request handler. The latter receives consumer queries from the global layer and collects real-time or archived data from appropriate sources depending on the query’s type (last state or historical). The abstract data layer includes several JDBC-based drivers, each one for retrieving data from a specific producer. The Java Database Connectivity (JDBC) interface is Java’s standard way of interoperating with databases; GridRM hides the diversity of monitoring sources behind JDBC’s widely used interface. Gateways represent events according to the GLUE schema. Consumers form and submit SQL queries using GLUE as the vocabulary, and gateways forward the queries to the appropriate drivers. GridRM is a research proposal that has to resolve several issues. For instance, the GLUE schema is under development and hence not complete; custom extensions must be made or adopted to support events for networks, processes and applications. Also, it is not clear whether the joining of information from several gateways is performed by clients themselves or by gateways (e.g., iteratively or recursively). In the latter case and in addition to the load generated by the constant conversion of collected events to the GLUE schema, gateways are likely to become a bottleneck, whereas they also pose a single point of failure. In the context of the taxonomy, GridRM is classified as L2a.H.S, namely a stackable second level system with a centralised republisher per organisation, that is currently focused on host events (GLUE must be extended accordingly to consider GridRM a generic monitoring system). 6.3. Hawkeye (L2a.G) Hawkeye [26], is a monitoring and management tool for clusters of computers. Although Hawkeye uses some technology from Condor [27] it is available as a standalone distribution for Linux and Solaris. Overview: Every monitored node hosts a monitoring agent (producer) that periodically calculates a set of metrics, which reflect the host’s state, and communicates them to a central manager. The metrics are represented in XML-encoded Condor’s classified advertisements (classads) [28], that is, simple attribute-value pairs with optional use of expressions.
The central manager (republisher) indexes the current state of nodes for fast query execution, and periodically stores it into a round robin database to maintain an archive. The monitoring information in the central manager, in addition to an API, can be accessed via command line utilities, and web and GUI frontends. Administrators can submit jobs to monitored nodes, either for unconditional execution or to be triggered as a response to specific events (e.g., when disk space is running out). Hawkeye is a second level, general-purpose monitoring system with a centralised republisher, i.e., L2a.G. 6.4. HBM (L2b.V) The Globus Heartbeat Monitor [29] (HBM) is an implementation of an unreliable fault-detection service of fail-stop failures of processes and hosts. A fault detector is considered unreliable if there is a possibility of erroneously reporting failures. A fail-stop failure of a component refers to the class of failures that are permanent and can be detected by external components. HBM was employed in early versions of Globus to verify the availability of grid services, but has been dropped due to the later adoption of soft-state protocols (i.e., services subscribe to a registry and periodically renew their subscription, which otherwise expires). Overview: HBM consists of local monitors (producers), data collectors (republishers) and consumers. For instance, a consumer can be a program that is responsible for the availability of specific services, or a process of a distributed parallel program. In HBM, a local monitor has to be running in monitored hosts, and hosts of monitored processes. Every monitored process registers to the local monitor residing in the same host. A local monitor periodically detects the state of all the monitored processes and communicates their status to interested data collectors. Upon the receipt of messages from local monitors, data collectors have to determine the availability status of specific processes, and notify accordingly any previously registered consumers. With respect to the taxonomy, HBM is characterised as L2b.V, namely a second level system with distributed republishers that is concerned with the availability of hosts and processes.
S. Zanikolas, R. Sakellariou / Future Generation Computer Systems 21 (2005) 163–188
6.5. JAMM (L2b.G) Java Agents for Monitoring and Management (JAMM) [30] was an effort to leverage the achievements of NetLogger (see Section 6.7) for building a GMA-like monitoring system with managed sensors. Overview: JAMM places a sensor manager per host, implemented using Java RMI, in order to achieve dynamic activation of sensors either by (i) monitoring network ports for incoming connections and enabling sensors related to the load generated by the invoked application, or (ii) after an explicit request made by a GUI management application. Every host is associated with a gateway where its events are being sent using NetLogger’s Universal Logger Message (ULM) format. Consumers can lookup in an LDAP-based registry for available sensors and their associated gateways, and retrieve the events they are interested in, from the latter. In the context of the taxonomy, JAMM’s sensors operate as producers because they generate and disseminate events; gateways serve as republishers that aggregate and optionally filter incoming events according to consumer queries. Since there may be more than one republishers but replication is not supported, JAMM is classified as L2b.G. 6.6. Mercury (L2b.G) Mercury [31–33] is a generic and extensible monitoring system, built as part of the GridLab project. The latter aims in the development of a Grid Application Toolkit to facilitate developers in building gridaware applications [34]. Mercury is a grid-enhanced version of the GRM distributed monitor [35,36] of the P-GRADE graphical parallel program development environment. GRM is an instrumentation library for message-passing applications in traditional parallel environments (such as clusters and supercomputers). Overview: Mercury consists of one local monitor per host (producer), a main monitor, and a monitoring service (republisher). Local monitors employ a set of sensors, implemented as loadable modules, to collect information about the local node, including host status, applications, etc., and send it to the main monitor. The latter coordinates local monitors according to requests received from the monitoring service and also serves requests from local (i.e., site-level) consumers.
173
The monitoring service is where external consumers submit their queries. Upon the receipt of such a query, the monitoring service validates it against the site policy and, if valid, instructs the main monitor to perform the query, which in turn coordinates the involved local monitors. Eventually, the monitoring service receives the results from the main monitor, transforms the platform-specific measurements to comparable values and finally forwards them to the consumer. Mercury defines a custom producer-consumer protocol that supports multi-channel communication and uses External Data Representation (XDR) for the encoding of events. In addition, a library and a special sensor are provided for the instrumentation of applications, so that a job can generate custom events which are sent to the sensor and read by the local monitor. Mercury also provides decision-making modules that inform actuators on adapting the monitoring process and steering applications. The main monitor in Mercury may be deployed in several instances to allow for load distribution. Combined with the described architecture and the support for events related to hosts, networks and applications, Mercury is classified as L2b.G. 6.7. NetLogger (L2a.A) The Network Application Logger Toolkit (NetLogger) [37] is used for performance analysis of complex systems such as client–server and/or multi-threaded applications. NetLogger combines network, host and application events and thus provides an overall view that facilitates the identification of performance bottlenecks. Overview: NetLogger consists of four components: an API and its library (available for C, C++, Java, Perl and Python), tools for collecting and manipulating logs (i.e., events), host and network sensors (typically wrappers of Unix monitoring programs), and a front-end for visualisation of real-time or historical events. An application is manually instrumented by invoking NetLogger’s API calls typically before and after (disk/network) I/O requests and any time-consuming computations. Events are tagged by the developer with a textual description, and by the library with a timestamp and some host- and network-related events. The generated events are stored to either a local file, a syslog daemon or a remote host. Prior to transmission, events
174
S. Zanikolas, R. Sakellariou / Future Generation Computer Systems 21 (2005) 163–188
are locally buffered to minimise the overhead imposed in high rates of generation. In terms of data encoding, NetLogger supports the text-based Universal Logger Message format (ULM), along with binary and XML-based encodings, allowing developers to choose the imposed overhead. In addition, the API was extended to allow for dynamic (de)activation of logging by periodically checking a local or remote configuration file. Concerning robustness, another extension to the API supports dynamic fail-over to a secondary logging destination in case the original remote host becomes unavailable. GMA-like NetLogger application monitoring: In an attempt to line up NetLogger with the GMA concepts, Gunter et al. [38] extended NetLogger’s framework by adding a monitoring activation service which is further elaborated in [39]. An activation service consists of three components: an activation manager and an activation producer per installation (republisher), and an activation node per host (producer). An activation manager holds the logging detail required for applications instrumented with NetLogger (including an option for deactivation of logging) and a simple client is provided for setting these values remotely. Each activation node periodically queries the activation manager for the required logging levels and communicates this information to the local applications through configuration files that are periodically checked by the latter. Applications are instructed to log events in a local file wherefrom the activation node forwards them asynchronously to the activation producer. The latter passively accepts events from activation nodes and matches them to consumer subscriptions, expressed as simple filters. All interactions among the activation service components employ pyGMA, which is a Python SOAPbased implementation of producer, consumer and registry interfaces similar to those defined in the GGF XML producer-consumer protocol [13]. In contrast, the transfer of events from activation nodes to producers can be done using any of the NetLogger transport options, hence ULM, binary or XML formats. Remarks: Considerable intrusiveness is introduced because of activation nodes having to periodically poll the activation manager, and applications to periodically check their configuration file. Also, instead of manual configuration, a registry could be used to support the dynamic discovery of activation service components.
Given a registry where all components would be subscribing their details, it would be far less intrusive to have the activation manager to inform activation nodes of logging level updates instead of the current design where activation nodes have to poll activation managers every 5 s. NetLogger is classified as L2a.A, namely a second level system with a centralised republisher that is intended for application monitoring. 6.8. NWS (L2c.N) The Network Weather Service is a portable (ANSI C-based) and non-intrusive performance monitoring and forecasting distributed system, primarily intended to support scheduling and dynamic resource allocation [40,10]. Overview: In NWS, a host employs sensors for estimating CPU load, memory utilisation and end-to-end network bandwidth and latency for all possible sensor pairs. Sensors combine passive and active monitoring methods, to accomplish accurate measurements, and are stateless to improve robustness and minimise intrusiveness. Network sensors in particular employ a set of techniques for avoiding conflicts among competing sensors. Sensors are managed through a sensor control process and their events are sent to a memory service, both of which can be replicated for distribution of load and fault-tolerance. All components subscribe to an LDAP-based registry (referred as name service), using a soft-state protocol. A forecasting process consumes events from the memory service to generate load predictions using a variety of forecasting libraries. A CGI-based front-end exposes current performance measurements and predictions to end-users. NWS has a small number of sophisticated and portable sensors, while there are prototypes for disk I/O, Network File System (NFS) and system availability. Current interfaces include C, LDAP and Globus Monitoring and Discovery Service (MDS) wrapper shell scripts, whereas a prototype has been under development for the Open Grid Services Architecture (OGSA) [41]. In terms of the taxonomy, NWS sensors operate as producers (i.e., measure and disseminate events), and memory services and forecasters serve as republishers; forecasters always operate on top of memory services.
S. Zanikolas, R. Sakellariou / Future Generation Computer Systems 21 (2005) 163–188
Since memory services can be configured for replication, NWS is classified as L2c.N. More recently, Topomon [42] has extended NWS to provide network topology information, which can be used to compute minimum spanning trees between two given hosts, in terms of latency or bandwidth. As part of that extension, Topomon has a republisher operating on top of NWS memory and forecasting processes, and employs GGF’s XML producer-consumer protocol. 6.9. OCM-G (L2b.A) OMIS Compliant Monitor (OCM-G) [43] is a monitoring system for interactive grid applications, developed as part of the EU CrossGrid project [44]. OCM-G is a grid-enhanced implementation of the On-line Monitoring Interface Specification (OMIS) [45]. OMIS defines a standard interface between instrumented applications and consumers. Overview: OCM-G’s overall architecture is rather similar to that of Mercury. There are per-host local monitors and per-site service managers. Local monitors have a producer interface for disseminating events generated by statically or dynamically instrumented applications (sensors). End-user performance tools (consumers) address commands to service managers (republishers), which in turn contact the local monitors of the involved applications. OCM-G supports three kinds of services: ondemand retrieval of events; manipulation of running applications for performance-enhancement and steering; and execution of actions upon the detection of specific events. OCM-G is intended to be customisable with respect to performance/overhead tradeoffs (such as the buffer size for storing the events in local monitors). This is due to the emphasis on interactive applications, that require low-latency monitoring to support real-time user feedback. Also, OCM-G defines numerous low-level events (so-called metrics) to allow performance tools to define composite events with custom semantics. In addition, OCM-G allows enquiries for host- and network-related events to facilitate performance analysis (i.e., as in NetLogger), and supports certificate-based authentication and access control of users as well as local monitors and service managers. In the context of the taxonomy, OCM-G is characterised as L2b.A, i.e., a second level system with
175
distributed republishers that is focused on application monitoring. 6.10. Remos (L2b.N.S) The Resource Monitoring System (Remos) provides to network-aware applications an application programming interface (API) for run-time enquiry of performance measurements of local and wide area networks [46,47]. Overview: Remos has a query-based interface featuring two abstractions, namely flows and network topologies. A flow represents a communication link between two applications. In contrast, a network topology graph provides a logical view of the physical interconnection between compute and network nodes, annotated with information on link capacity, current bandwidth utilisation and latency. Remos consists of several types of collectors, a modeller and a prediction service. A variety of collectors is employed to accommodate the heterogeneity of networks: SNMP and bridge collectors for SNMP-aware routers and Ethernet switches respectively; benchmark collectors for network links where SNMP is not available, typically wide area network (WAN) links. SNMP and bridge collectors correspond to republishers making use of external producers (SNMP); benchmark collectors are producers implementing active sensors. In addition, every site has a master collector, which accepts queries from modellers. A master collector coordinates the appropriate collectors for the execution of a given query, and collects, merges and sends the results to the query’s originator, effectively acting as a higher level republisher. These results are raw measurements and it is the modeller’s responsibility to build the (flow or topology) abstractions before forwarding them to the application. Every application has its own modeller, which is a process running on the same host, which makes modellers part of consumers. In addition to current load measurements, Remos’ API supports predictions for host load and network events (e.g., bandwidth utilisation and latency), of which only the former was implemented at the time of writing, using the RPS toolkit [48]. Because of the complexity involved in networks (e.g., routing protocols, heterogeneity of devices, etc.), Remos provides “best effort” measurements annotated with statistical parameters (e.g., standard deviation,
176
S. Zanikolas, R. Sakellariou / Future Generation Computer Systems 21 (2005) 163–188
confidence). Remos’ design focuses on the provision of a consistent interface, independently of the underlying network technicalities, and on portability, hence the use of SNMP and simple system-independent benchmarks. Remos employs a variety of producers (external SNMP producers, benchmark collectors) and republishers (SNMP collectors, master collectors, predictor), which however have to be connected in a predefined way. On this basis, Remos is classified as L2b.N.S, that is, a stackable (since it operates on top of SNMP) second level system with optional support for multiple first-level republishers (SNMP collectors) per installation. 6.11. SCALEA-G (L2b.G) SCALEA-G is an extensible, service-oriented3 instrumentation, monitoring and performance analysis framework for hosts, networks and applications. Overview: SCALEA-G [49] implements a variety of grid services (see Section 7.2), including sensor, sensor manager, instrumentation, archival, registry and client services. A sensor manager service interacts with sensor service instances, which may be on the same or different hosts. This implies that SCALEA-G sensors are equivalent to producers and sensor managers to republishers. An archival service provides persistent storage of monitoring information. Producers and republishers are registered in and discovered from a sensor repository and a directory service, respectively. (The directory service and sensor repository services combined, provide the functionality of a registry.) An application instrumentation service is partially built on existing systems (SCALEA [50] and Dyninst [51]) to support source-level and dynamic instrumentation. Consumers interact with the instrumentation service using an XML-based instrumentation request language that defines request/response messages. All messages are encoded in XML according to predefined schemas, and consumers can pose XPath/ XQuery queries or establish subscriptions with sensor manager services. Globus’ Grid Security Infrastructure (GSI) is employed to provide security services such as consumer authentication and authorisation. SCALEA3 SCALEA-G is implemented using the Open Grid Services Architecture (OGSA), which has been superseded by the newly adopted Web Services Resource Framework (WSRF).
G is complemented by GUI programs for configuring the system and conducting performance analysis. SCALEA-G is a second level general-purpose monitoring system with distributed republishers, namely L2b.G. 7. Level 3: hierarchy of republishers This section focuses on third level monitoring systems, that is, frameworks featuring producers and general purpose republishers which can form an arbitrarily structured hierarchy. The considered systems are: Ganglia, a fairly scalable and widely used cluster monitoring system; Globus MDS, the Monitoring and Discovery Service of the most widely deployed grid middleware; MonALISA, a Jini-based monitoring prototype for large distributed systems; Paradyn with Multicast/Reduction Network, a system for application performance analysis; RGMA, a relational approach to GMA, that is intended to operate as a standalone Grid Information Service (GIS). MDS, MonALISA and RGMA can be configured for stackable operation, i.e., run on top of other monitoring systems. Among others, both systems can be configured to retrieve and query information provided by a Ganglia installation. 7.1. Ganglia (L3.G) Ganglia [52] is an open source hierarchical monitoring system, primarily designed for computer clusters but also used in grid installations. Ganglia at the time of writing was deployed in more than 500 clusters. Overview: At the cluster level, membership is determined with a broadcast, soft-state protocol—softstate means that membership must be periodically renewed by explicit messages or otherwise expires. All nodes have a multi-threaded daemon (Ganglia monitoring daemon) performing the following tasks: • Collecting and broadcasting External Data Representation (XDR) encoded events from the local host. • Listening the broadcasts sent by other nodes and locally maintaining the cluster’s state. • Replying to consumer queries about any node in the local cluster, using XML encoded messages. Given the above actions, a cluster’s status is replicated among all nodes, which act as producers, result-
S. Zanikolas, R. Sakellariou / Future Generation Computer Systems 21 (2005) 163–188
ing in distribution of load and fault-tolerance, but also in high network and host intrusiveness. An arbitrarily structured hierarchy of republishers (referred as Ganglia meta-daemons) periodically collect and aggregate events from lower level data sources, store them in round-robin databases, and provide them on demand to higher level republishers. Data sources may be either producers (on behalf of a cluster) or other republishers (on behalf of several clusters); in both cases an XML-encoding is employed. Ganglia does not have a registry and therefore the location of producers and republishers must be known through out-of-band means. The databases serve as archives and are also used by a web-based visualisation application providing cluster- and node-level statistics. Simple command line utilities are provided for adding new event types and querying producers and republishers. Remarks: Ganglia introduces considerable, albeit linear, overhead both at hosts and networks at cluster and hierarchy levels, because of the multicast updates in the former, and XML event encoding in the latter. The network intrusiveness imposed by republishers connected through WAN links is of considerable importance given the associated costs. Other concerns include the availability of IP multicast, and the lack of a registry since Ganglia was primarily intended for clusters, which are fairly static compared to grids. 7.2. Globus MDS (L3.G.S) The Monitoring and Discovery Service [2,3], formerly known as the Metacomputing Directory Service, constitutes the information infrastructure of the Globus toolkit [53]. Overview: MDS 2.x is based on two core protocols: the Grid Information Protocol (GRIP) and the Grid Registration Protocol (GRRP). The former allows query/response interactions and search operations. GRIP is complemented by GRRP, which is for maintaining soft-state registrations between MDS components. The Lightweight Directory Access Protocol (LDAP) [54] is adopted as a data model and representation (i.e., hierarchical and LDIF respectively—LDAP Directory Interchange Format), a query language and a transport protocol for GRIP, and as a transport protocol for GRRP. Given the LDAP-based hierarchical
177
data model, entities are represented as one or more LDAP objects defined as typed attribute-value pairs and organised in a hierarchical structure, called the Directory Information Tree (DIT). The MDS framework consists of information providers (sensors), Grid Resource Information Services (GRIS—producers) and Grid Index Information Services (GIIS—republishers). Both producers and republishers are implemented as backends for the open source OpenLDAP server implementation. Producers collect events from information providers, either from a set of shell scripts or from loadable modules via an API. In addition, producers provide their events to republishers or to consumers using GRIP, and register themselves to one or more republishers using GRRP. Republishers form a hierarchy in which each node typically aggregates the information provided by lower level republishers (and producers in case of first level republishers). Republishers use GRIP and GRRP as part of the consumer and producer interfaces, though custom implementations could offer alternative producer interfaces (i.e., relational). Several roles may be served by republishers, including the provision of special purpose views (e.g. application-specific), organisation-level views and so on. Consumers may submit queries to either producers or republishers, or discover producers through republishers, in any case using GRIP. Remarks: The hierarchical data model along with LDAP’s referral capability (i.e., forward a query to an authoritative server) accommodates well the need for autonomy of resource providers and decentralised maintenance. Also, MDS supports security services, such as access control, through the use of the Grid Security Infrastructure (GSI) [55]. However, LDAP features a non-declarative query interface that requires knowledge of the employed schema. In addition, the performance of OpenLDAP’s update operation— which is by far the most frequently used—has been very much criticised. MDS3: Globus was re-designed and implemented as part of the Open Grid Services Architecture (OGSA) [41], a web services-based framework aiming to enhance interoperability among heterogeneous systems through service orientation (i.e., hiding the underlying details by means of consistent interfaces). In OGSA, everything is represented as a grid service, that is, a web
178
S. Zanikolas, R. Sakellariou / Future Generation Computer Systems 21 (2005) 163–188
service that complies to some conventions, including the implementation of a set of grid service interfaces (portTypes in WSDL terminology). Every grid service exposes its state and attributes through the implementation of the GridService portType and, optionally, the Notification-Source portType, which correspond to pull and push data delivery models, respectively. In this respect, the functionality of the MDS2 Grid Resource Information Service (GRIS) is encapsulated within grid services. In OGSA, the equivalent of the MDS2 Grid Index Information Service (GIIS) is the Index Service which, among others, provides a framework for aggregation and indexing of subscribed grid services and lower level Index Services. Index Services are organised in a hierarchical fashion just like the GIISs in MDS2. Information is represented in XML according to the GLUE schema. Simple queries can be formed by specifying a grid service and one or more service data elements, whereas more complex expressions are supported using XPath. 7.3. MonALISA (L3.G.S) MonALISA (Monitoring Agents using a Large Integrated Services Architecture) [56] is a Jini-based [57], extensible monitoring framework for hosts and networks in large-scale distributed systems. It can interface with locally available monitoring and batch queueing systems through the use of appropriate modules. The collected information is locally stored and made available to higher level services, including a GUI front-end for visualising the collected monitoring events. Overview: MonALISA is based on the Dynamic Distributed Services Architecture (DDSA) [58] which includes one station server per site or facility within a grid, and a number of Jini lookup discovery services (i.e., equivalent to registries). The latter can join and leave dynamically, while information can be replicated among discovery services of common groups. A station server hosts, schedules, and restarts if necessary, a set of agent-based services. Each service registers to a set of discovery services wherefrom can be found from other services. The registration in Jini is lease-based, meaning that it has to be periodically renewed, and includes contact information, event types of interest and the code required to interact with a given service.
Each station server hosts a multi-threaded monitoring service, which collects data from locally available monitoring sources (e.g., SNMP, Ganglia, LSF, PBS, Hawkeye) using readily available modules. The collected data are locally stored and indexed in either an embedded or an external database, and provided on demand to clients (i.e., consumer services). A client, after discovering a service through the lookup service, downloading its code and instantiating a proxy, can submit real-time and historical queries or subscribe for events of a given type. Custom information (i.e., not part of the schema) can be acquired by deploying a digitally signed agent filter to the remote host. In addition, non-Java clients can use a WSDL/SOAP binding. Services and modules can be managed through an administration GUI, allowing an authenticated user to remotely configure what needs to be monitored. Also, MonALISA has a facility for periodically checking the availability of new versions and automatically updating any obsolete services. Current applications of MonALISA are a GUI front-end featuring several forms of status visualisation (maps, histograms, tables, etc.) and dynamic optimisation of network routing for the needs of a video conference application. Future plans include building higher level services for supporting job scheduling and data replication. Concluding, MonALISA provides a generalpurpose and flexible framework, though it could be argued that Java restricts the overall performance. Also, Jini is using multicast, which is not always available, and places scalability limits. In terms of the taxonomy, external (to MonALISA) monitoring sources are producers, whereas monitoring services and other higher-level services serve as republishers by collecting data from producers and providing higher level abstractions, respectively. To this end, MonALISA is classified as L3.G.S meaning that custom-built republishers can be structured in a custom hierarchy; a variety of entities can be monitored; the system is stackable. 7.4. Paradyn/MRNet (L3.A) Paradyn [59] is a performance analysis toolkit for long running, parallel, distributed and sequential applications. It supports dynamic instrumentation, that is,
S. Zanikolas, R. Sakellariou / Future Generation Computer Systems 21 (2005) 163–188
insertion, modification and removal of instrumentation code during program execution. Paradyn originally had a first-level architecture (i.e., consumers and producers only), consisting of an enduser GUI for application performance analysis and control, that consumes data originating from the processes of an instrumented distributed application. Scalability concerns arising from performance analysis of applications with hundreds of processes motivated the development of Multicast/Reduction Network. MRNet [60,61] is a communication system, with support for multicast and data aggregation services, for use in parallel tools—available separately and as part of Paradyn. Overview: In addition to Paradyn’s end-user GUI (consumer, referred as front-end), parallel processes of an application (sensors) and a back-end per process (producers), MRNet provides a program that can be run in many instances in potentially different hosts to form a custom hierarchy of internal processes (republishers) that transfer data from producers to a single consumer and vice versa. Producers and consumers can use MRNet’s communication facilities using the provided C++ library. MRNet republishers support synchronisation and transformation filters to determine when packets should be forwarded up the hierarchy (e.g., wait for a packet from every child node) and to apply packetspecific data-reduction techniques (e.g., deliver to the consumer the average of all producers’ measurements as opposed to all values). Also, an MRNetinstrumented consumer uses multicast for sending control requests to producers, thus scaling better for large number of producers. Paradyn with MRNet is reported [60] to scale well in settings of up to 500 producers per consumer, resulting in significantly improved scalability (compared to the original first level architecture) with respect to a variety of performance metrics. Paradyn/MRNet is classified as L3.A because it is application-oriented and, in addition to consumer and producers, provides a configurable republisher for creating arbitrarily structured hierarchies of custom functionality. 7.5. RGMA (L3.G.S) The Relational Grid Information Services Research Group of the Global Grid Forum supports the view
179
that the only difference between information and monitoring services is that the data involved in the latter have to be timestamped [62]. To this end, they have built RGMA [12] as part of the EU DataGrid project; a framework which combines grid monitoring and information services based on the relational model. That is, RGMA defines the GMA components, and hence their interfaces, in relational terms. Overview: In RGMA, producers are distinguished in five different classes but we limit our discussion in database and stream producers, which are indicative of the main concepts. Database producers are employed for static data stored in databases, whereas stream producers for dynamic data stored in memory resident circular buffers. New producers announce their relations (i.e., event types) using an SQL “create table” query, offer them via an SQL “insert” statement, and “drop” their tables when they cease to exist. A consumer is defined as an SQL “select” query. In order for a component to act as either a consumer or a producer, it has to instantiate a remote object (agent) and invoke methods from the appropriate (consumer or producer) API. The global schema includes a core set of relations, while new relations can be dynamically created and dropped by producers as previously described. Republishers are defined as one or more SQL queries that provide a relational view on data received by producers or other republishers. The registry holds the relations and views provided by database producers, stream producers and republishers. The registry includes the global schema and is centralised, while there are efforts for a distributed implementation. A mediator uses the information available in the registry and cooperates with consumers to dynamically construct query plans for queries that cannot be satisfied by a single relation (i.e., involving “joins” from several producers). Remarks: RGMA is implemented in Java Servlets and its API is available for C++ and Java, while wrapper API implementations exist for C, Perl and Python. The RGMA implementation is considered stable but suffers in terms of performance [63]. RGMA can be used as a standalone grid information service assuming information providers and consumers use the RGMA APIs. Some tools are available for supporting MDS2 information providers and consumers (i.e., using an LDAP interface) but in the cost of performance degradation.
180
S. Zanikolas, R. Sakellariou / Future Generation Computer Systems 21 (2005) 163–188
Conceptually, RGMA provides access to the information of a Virtual Organisation’s resources as if that was stored in a single RDBMS; there are plans for extending this concept across VOs. Overall, the system has a potential for good scalability given the (under development) replication of the global schema and the registry, and the combination of data sources into a hierarchy of republishers.
host and network monitoring events from Microsoft Win32 operating systems, and apply data reduction techniques; GridObserver [67], a web front-end which appears rather similar to Ganglia (GridObserver was not classified due to limited available information); Ref. [68] discusses a set of sampling methods that aim to minimise intrusiveness in large-scale systems; Refs. [69] and [70] have pointers to numerous web oriented systems and general-purpose network performance measurement tools, respectively.
8. Related work Most relevant to this survey, is a white paper [64] by the “Automatic Performance Analysis: Real Tools” (APART) working group. This paper provides a directory of grid-oriented performance analysis systems, which are characterised along a large number of features. The paper also underlines the lack of any single system that can serve the needs of all user classes. To this end, the paper suggests three groups of systems that combined can satisfy most user needs. As part of that integration, it is noted that a lot of effort is needed for the systems to interoperate. Also relevant, though rather outdated, is a survey of selected grid monitoring tools in [65]. For a brief discussion of related work on monitoring systems evaluation see Section 9. Other work includes, WatchTower [66], a C++ library that allows applications to extract comprehensive
9. Discussion Tables 1–4 summarise the features of the systems considered in Sections 5–7. To start with, Tables 1 and 2 show the mapping of system components to that of GMA (as they were defined in Section 2.4), as well as characteristics of sensors and producer interactions. GMA mapping: The registry functionality, if any, is provided either by standalone components or is partially (e.g., Mercury, Remos) or fully (e.g., MDS2, Hawkeye) provided by a republisher. Most of the considered systems provide the tools for maintaining an archive into some form of a database (a relational DBMS, an XML DB, etc.) and some of them expose the archived data through a producer or a republisher interface (e.g., RGMA, CODE). MonALISA is interesting in that it provides the option of using
Table 1 Systems overview with respect to components mapping to GMA, sensors and interactions—part 1 Features/project
AutoPilot
CODE
Hawkeye
GridRM
NetLogger
HBM
JAMM
Mercury
Classification Producer
L2a.G Agent
L2a.G Agent Manager
Name service
Manager
Registry
L2a.A Instrumented applications Activation producer Registry
L2b.V Local monitor Data collector –
L2b.G Instrumented applications Gateway
Registry
Registry
MM
Archive
–
Event archive Directory service XML DB
L2a.H External source Gateway
L2b.G LM
Republisher
L1.A Instrumented applications n/a
Round robin DB
DBMS
DBMS
–
–
DBMS
A (H/N) A (P) y
V P n/a
H/N/A P y
H/A/N P y
Push Push
Pull Push
Push Pull
Both Both?
Sensors Monitored entities A H/N/S H/N/S H Passive/active A P P Depends Managed y y y n/a Interactions (PR, PRC: producer–republisher, producer or republisher–consumer PR n/a Both Both Depends PRC Push Both Pull Both?
In the sensors category, parenthesis denote non-comprehensive monitoring of related entities.
MM, MS
Features/project
OCM-G
Remos
SCALEAG
NWS
Ganglia
MDS2
MonALISA
Paradyn/ MRNet
RGMA
Classification Producer
L2b.A Local monitor
L2b.G Sensor and/or sensor manager
L2c.G Memory host
L3.G Monitoring daemon
L3.G.S GRIS
L3.G.S Monitoring service
L3.A Backends
L3.G.S Producers
Republisher
Monitoring service –
L2b.N SNMP services and benchmark collectors SNMP and master collector Part of collectors
Sensor manager
Predictor
GIIS
Name service
GIIS
Other agents Lookup service
Internal processes –
Republishers
Sensor repository and directory service Archival service
Meta daemon –
Registry
–
RRD tool
–
DBMS
–
DBMS
N (H) P/A n/a
H/N P n
H/N/P P n
H/N Depends Depends
A A? y
H/N/? P? n
Pull Pull
Push Pull
Push Pull
Depends Both?
Both? Both?
? Both
Registry
Archive – – Sensors Monitored entities A (H/N) N (H) A/H/N/S Passive/active A (?) P/A Managed y n/a y Interactions (PR, PRC: producer–republisher, producer or republisher–consumer PR Both Pull? Both PRC Both Pull? Both
In the sensors category, parenthesis denote non-comprehensive monitoring of related entities.
S. Zanikolas, R. Sakellariou / Future Generation Computer Systems 21 (2005) 163–188
Table 2 Systems overview with respect to components mapping to GMA, sensors and interactions—part 2
181
182
S. Zanikolas, R. Sakellariou / Future Generation Computer Systems 21 (2005) 163–188
Table 3 Systems overview with respect to events, implementation and other issues—part 1 Features/project
Auto pilot
CODE
Hawkeye
GridRM
Events (Format: A, B, G, L, U, X, Xd = ASCII, Binary, GLUE, ULM, XML, XDR) Format SDDF X X G Implementation Language C++ C++, J C++ J API C++ C++, J C++, J JDBC Tools V V W, G, CLI W Availability y n y n Miscellany Key features App Globus Cluster stats/ Unified interface steering systems management management Security GSI GSI GSI –
Net logger
HBM
JAMM
Mercury
X/U/B
?
U
Xd
C/Py C, C++, J, P, Py V y
C C? V y
J ? V y
C, J C V y
Fault detection –
–
Extensibility and adaptivity –
GSI
Language/API: Co, J, Jp, Js, P, Py, W = CORBA, Java, Java Serve Pages, Java Servlets, Perl, Python, WSDL/SOAP; Tools: V, W = Visualisation GUI, Web front-end.
an embedded or an external database per monitoring service. Sensors: Regarding the monitored entities, almost all of the considered systems support host and network events, though the degree of comprehensiveness greatly varies (e.g., NWS is primarily intended for networks, NetLogger and OCM-G for applications, etc.). Recall from Section 2.1 that a sensor, may be either active or passive, depending on whether it actively performs measurements (e.g., using benchmarking algorithms) or passively collects performance data from platform-specific facilities. This is a tradeoff between intrusiveness on one hand, and potentially platformindependent results on the other. To this end, an ideal system would provide sensors in both types, to allow developers to choose whichever is appropriate for a given use. Apart from the application instrumentation systems (Autopilot, NetLogger, OCM-G, and the instrumentation service of SCALEA-G) which require active sensors, most of the considered systems employ passive sensors. Exceptions include NWS (both types) and Remos (active for WAN, passive for LAN links). The managed property denotes whether dynamic sensor (de)activation is possible, which applies only to systems that support the push data delivery model. This is supported by all relevant systems except Ganglia and MDS2. Producers: The last sections of Tables 1 and 2 refer to the supported data delivery models, between producers and republishers on one hand, and producers or
republishers with consumers on the other (denoted as PR and PRC, respectively). Pull implies query-like interactions and push refers to either subscription or oneoff interactions. Event delivery in subscriptions can be conditional or unconditional (i.e., periodic). Periodic event delivery can guarantee measurements of a given frequency but is more intrusive. In managed sensors, the frequency of measurements may be dynamically configurable. On-line application performance analysis and steering (as opposed to post mortem analysis) require a constant stream of events and thus are more suited for push data delivery, whereas infrequent queries are better served using pull mode. Particularly push-only systems without managed sensors typically impose excessive overhead. Ideally, both modes should be supported or otherwise unnecessary overhead is imposed (e.g., consumers establishing a short-lived subscription in place of a query, or constantly posing queries due to lack of subscriptions). Events: In Tables 3 and 4, the format field indicates the employed encoding of events, varying from heavyweight and self-describing approaches (XML) to very compact but rigid formats (XDR). In any case, the employed event format greatly affects a system’s intrusiveness both in terms of host and network load for processing and transmitting events, respectively. Again, the ideal is to provide several options and let the user determine what is appropriate for any given case, as is with NetLogger’s ULM and Autopilot’s SDDF.
Features/project
OCM-G
Remos
SCALEA-G
Events (Format: B, G, L, U, X, Xd = Binary, GLUE, ULM, XML, XDR) Format Java data types X Implementation Language C J J API C, C++ J C, C++, J Tools Availability Miscellany Key features
Security
NWS
V y
– y
V y
C C, sh, LDAPC W y
Interactive application steering GSI
Flows, topologies, predictions
Services-based unified system
Load predictions
GSI
GSI
–
Ganglia
MDS2
MonALISA
Paradyn/ MRNet
RGMA
Xd, X
L
X?
C CLI util W y
C C, Co, J, Jp, P, Py, sh, LDAP W y
Jini J, W
C++ C++
V, W y
V y
Js C, C++, J, P, Py V, W y
Cluster stats
Custom views
Corrective actions
Scalable on-line app analysis
Virtual DBMS
GSI
SSL/ X.509
–
GSI
X
Language/API: Co, J, Jp, Js, P, Py, W = CORBA, Java, Java Server Pages, Java Servlets, Perl, Python, WSDL/SOAP; Tools: V, W = Visualisation/Analysis GUI, Web front-end.
S. Zanikolas, R. Sakellariou / Future Generation Computer Systems 21 (2005) 163–188
Table 4 Systems overview with respect to events, implementation and other issues—part 2
183
184
S. Zanikolas, R. Sakellariou / Future Generation Computer Systems 21 (2005) 163–188
Implementation issues: Tables 3 and 4 also refer to the implementation language of the considered systems, the supported application programming interfaces (APIs) and tools, and whether the actual software is distributed through the Internet. The language itself is a good indication of a system’s host overhead and overall performance; hence Java-based systems are normally expected to have a worse performance compared to C-based systems. Concerning APIs, some of the production level projects feature many options, whereas there is a tendency (though not reflected in the tables) to provide WSDL/SOAP bindings for interfacing with OGSA. In terms of tools, almost all of the considered systems provide a standalone visualisation GUI, a web front-end or both. Finally, most of the systems are freely available, though licence restrictions greatly vary. Miscellany: The diversity of the considered systems is reflected in the key features row. These include high level abstractions, such as network and processor load predictions (NWS, Remos); a unified interface integrating other monitoring sources (GridRM); the organisation of monitoring information in custom views (e.g., in MDS one can have different GIIS servers for available software, processors, storage mediums and so on); the correlation of host-, network- and application-related events (NetLogger, OCM-G); the calculation of site- or VO-level load (Ganglia, GridICE), the conceptualisation of a VO’s information services as a virtual DBMS (RGMA), etc. Concerning automatic actions, some systems can be configured to trigger specific commands under certain circumstances, to facilitate systems management (CODE, MapCenter, Hawkeye) or to allow the adaptation of applications to a dynamic environment (Autopilot, OCM-G, MonALISA, Mercury). In terms of security, many systems provide authentication and/or authorisation via the Grid Security Infrastructure (GSI). MonALISA employs X.509 certificates for the secure management, upgrade and deployment of agents. Evaluation: With respect to evaluation of monitoring systems, we note, in agreement with [64], that the existing work is very limited. Mercury has been recently reported as coping well with the high load posed by application monitoring based on GRM, whereas RGMA’s performance has been proven insufficient for the same purpose [71]. An earlier paper [31] compares design characteristics of GRM and NetLogger, and ar-
gues that the latter suffers in terms of performance and robustness. Another study [63] describes a performance comparison of Hawkeye and a few versions of Globus MDS2 and RGMA. One of the main conclusions is that caching of events is most important for the performance of all system components. Hawkeye, with the exception of the producer (agent), which does not employ caching, generally appears to be more stable and efficient in terms of imposed host load. Throughput and response time vary considerably among different versions and components of every system. According to the study, RGMA’s producers and registry appear to be less scalable with respect to the number of concurrent users and sensors (referred as information collectors). Among the proposed suggestions is that (i) the republishers of the considered systems should be connected to less than 100 producers; (ii) the number of concurrent consumers should be less than 400, 500 and 600 for RGMA, MDS and Hawkeye, respectively. Remarks: One can easily see the lack of coordination, hence the overlapping functionality, between projects. Also evident is the diversity of APIs and protocols which, along with implied or explicit but custom semantics of event types, lead to interoperability problems. Coordination is clearly a political issue and one can only hope that there will be a driving force to encourage consolidation or at least some form of closer cooperation. However, interoperability is more of a technical problem. Communication paradigms and protocols in the considered systems vary from sockets (Mercury, NWS), LDAP (MDS2), Java RMI (JAMM), and web services (NetLogger’s pyGMA, CODE, Topomon, MDS3 and MonALISA). GGF’s producer-consumer protocol [13] is not sufficient because it is more of a methodology for designing producer-consumer interactions using web services rather than a protocol specification. Also, there is no commonly agreed event schema either because of systems addressing (slightly) different problems or due to different views of the same problems. This problem can be faced in two ways; either agree on a widely accepted platform-independent (e.g., web services-based) protocol and event schema and assume its adoption by monitoring systems, or extend information services to interoperate with a diverse set of monitoring sources in order to collect and transform events
S. Zanikolas, R. Sakellariou / Future Generation Computer Systems 21 (2005) 163–188
to a common schema (e.g., GridRM, MonALISA). The former places much less overhead on information services and thus allows for better performance and scalability, but requires a consensus on protocols and semantics. In the latter approach, information services are very likely to become performance bottlenecks given the need to implement several protocols and normalise collected events. In addition to interoperability, which is a major obstacle for connecting the existing grid installations into a worldwide Grid, there is also the scalability requirement. In a worldwide Grid context, there is a need for highly scalable monitoring services [72] (i) to build efficient, Grid-wide resource discovery end-user applications or services, such as resource brokers [73], search engines [74] or directories of grid resources, or (ii) to provide a variety of “global view” services to enhance the understanding of the Grid. Grid search engines may provide to users and programs an efficient means of resolving complex, largescope queries (i.e., involving the combination of information from many organisations). However, end-users may not be able to specify exactly their needs or be unaware of the resources that are available throughout the Grid. To this end, resource directories will support end-users to find the appropriate matches through a browsable list of resources, offered in a variety of classifications. The latter can be based on criteria such as discipline (in case of collaborations, data repositories, and on-line instruments), sharing policy, physical location (e.g., continent, country, city), administration hierarchy (e.g., virtual organisation, organisation, department) supported quality of service guarantees, hardware and software specifications, and so on. On the other hand, global view services, similarly to Netcraft [75] and Alexa [76] for the worldwide web, will provide a comprehensive quantitative and qualitative characterisation of the Grid throughout time. This will help to understand the dynamics of the Grid, support long-term capacity planning and contribute to its realistic modelling and simulation by answering questions such as: how many are the grid resources in the public worldwide Grid; what is their distribution among sites; which resource types are rare or popular; which grid sites are most reliable; how these numbers evolve throughout time; how does the Grid’s evolution relates to that of the Internet.
185
10. Summary This paper introduced the problem of grid monitoring, including associated concepts, requirements and stages. It also outlined the Grid Monitoring Architecture of the Global Grid Forum and mapped its components to phases of distributed systems monitoring. More importantly, a taxonomy was defined to allow the classification of monitoring systems with respect to (i) compliance to core GMA components; (ii) main target of monitored entities; and (iii) whether a system can or has to operate on top of another system. The taxonomy should be applicable to all monitoring systems because its categories are specified with respect to fundamental monitoring functions (i.e., generation, processing, distribution and consumption of monitoring data). Furthermore, the taxonomy was used to classify a diverse set of monitoring systems, ranging from application instrumentation tools to standalone Grid Information Services. In addition, the paper underlined, in agreement with [64], the need for more coordination and interoperability among existing and future monitoring projects, given the currently overlapping functionality and lack of consensus regarding the employed protocols and semantics. Finally, an unexplored field was identified in the context of global monitoring, and motivated in terms of potential applications.
Acknowledgements We would like to thank the anonymous reviewers whose feedback significantly improved the paper. Also, the first author is pleased to acknowledge the scholarship he is receiving from the Greek State Scholarships Foundation (IKY).
References [1] I. Foster, C. Kesselman, S. Tuecke, The anatomy of the grid: enabling scalable virtual organizations, Int. J. Supercomput. Appl. 15 (3) (2001) 115–128. [2] S. Fitzgerald, I. Foster, C. Kesselman, G. von Laszewski, W. Smith, S. Tuecke, A directory service for configuring highperformance distributed computations, in: Proceedings of the Sixth IEEE Symposium on High Performance Distributed Computing, IEEE Computer Society Press, 1997, pp. 365–375.
186
S. Zanikolas, R. Sakellariou / Future Generation Computer Systems 21 (2005) 163–188
[3] S. Czajkowski, K. Fitzgerald, I. Foster, C. Kesselman, Grid information services for distributed resource sharing, in: Proceedings of the 10th IEEE International Symposium on HighPerformance Distributed Computing (HPDC-10), IEEE Computer Society Press, San Francisco, CA, 2001, pp. 181–194. [4] Z. Balaton, P. Kacsuk, N. Podhorszki, F. Vajda, Use Cases and the Proposed Grid Monitoring Architecture, Tech. Rep. LDS-1/2001, Computer and Automation Research Institute of the Hungarian Academy of Sciences, 2001. http://www.lpds.sztaki.hu/publications/reports/lpds-12001.pdf. [5] G. Carlson, How to save money with computer monitoring, in: Proceedings of the ACM Annual Conference, ACM Press, Boston, MA, USA, 1972, pp. 1018–1023. [6] B. Tierney, R. Aydt, D. Gunter, W. Smith, M. Swany, V. Taylor, R. Wolski, A Grid Monitoring Architecture, GWDPerf-16–3, Global Grid Forum, August 2002. http://wwwdidc.lbl.gov/GGF-PERF/GMA-WG/papers/GWD-GP-163.pdf. [7] B. Plale, P. Dinda, M. Helm, G. von Laszewski, J. McGee, Key concepts and services of a grid information service, in: Proceedings of the 15th International Conference on Parallel and Distributed Computing Systems (PDCS 2002), Louisville, KY, 2002. [8] M. Mansouri-Samani, Monitoring Distributed Systems (A Survey), Tech. Rep. DOC92/23, Imperial College, London, UK, 1992. http://www.citeseer.ist.psu.edu/mansourisamani92monitoring.html. [9] M. Mansouri-Samani, M. Sloman, Monitoring distributed systems, IEEE Network 7 (6) (1993) 20–30. [10] R. Wolski, L.J. Miller, G. Obertelli, M. Swany, Performance information services for computational grids, Grid Resource Management, State of the Art and Future Trends, Kluwer Academic Publishers, 2003, pp. 193–213. [11] D.L. Mills, Network Time Protocol (Version 3) Specification, Implementation and Analysis, RFC 1305, March 1992. http://www.ietf.org/rfc/rfc1305.txt. [12] A. Cooke, A.J.G. Gray, L. Ma, W. Nutt, J. Magowan, M. Oevers, P. Taylor, R. Byrom, L. Field, S. Hicks, J. Leake, M. Soni, A. Wilson, R. Cordenonsi, L. Cornwall, A. Djaoui, S. Fisher, N. Podhorszki, B. Coghlan, S. Kenny, D. O’Callaghan, R-GMA: an information integration system for grid monitoring, in: Proceedings of the 10th International Conference on Cooperative Information Systems, 2003. [13] W. Smith, D. Gunter, D. Quesnel, A Simple XML Producer/Consumer Protocol, GWD-Perf-8-2, Global Grid Forum, 2002. http://www-didc.lbl.gov/GGF-PERF/GMAWG/papers/GWD-GP-8-2.pdf. [14] Distributed Management Task Force—Common Information Model (CIM), accessed on 3 December 2003. http://www.dmtf.org/standards/cim. [15] F. Bonnassieux, R. Harakaly, P. Primet, MapCenter: an open grid status visualization tool, in: Proceedings of the ISCA 15th International Conference on Parallel and Distributed Computing Systems, Louisville, KY, USA, 2002. [16] F. Bonnassieux, R. Harakaly, P. Primet, Automatic services discovery, monitoring and visualization of grid environments: the
[17]
[18]
[19]
[20]
[21]
[22]
[23]
[24]
[25]
[26]
[27]
[28]
[29]
mapcenter approach, in: F.F. Rivera, M. Bubak, A.G. Tato, R. Doallo (Eds.), Proceedings of the First European Across Grids Conference, vol. 2970 of Lecture Notes in Computer Science, Springer-Verlag, Santiago de Compostela, Spain, 2004, pp. 222–229. S. Andreozzi, N. De Bortoli, S. Fantinel, A. Ghiselli, G. Tortone, C. Vistoli, GridICE: A Monitoring Service for the Grid, in: Proceedings of the Third Cracow Grid Workshop, Cracow, Poland, October 27–29, 2003, pp. 220–226. S. Andreozzi, S. Fantinel, D. Rebatto, L. Vaccarossa, G. Tortone, A monitoring tool for a grid operation center, in: Computing in High Energy and Nuclear Physics (CHEP03), La Jolla, CA, 2003. R.L. Ribler, J.S. Vetter, H. Simitci, D.A. Reed, Autopilot: adaptive control of distributed applications, in: Proceedings of the Seventh IEEE Symposium on High-Performance Distributed Computing, 1998, pp. 172–179. F. Berman, A. Chien, K. Cooper, J. Dongarra, I. Foster, D. Gannon, L. Johnsson, K. Kennedy, C. Kesselman, J. MellorCrummey, D. Reed, L. Torczon, R. Wolski, The GrADS project: software support for high-level grid application development, Int. J. High Perform. Comput. Appl. 15 (4) (2001) 327– 344. R. Aydt, The Pablo Self-Defining Data Format, Tech. Rep., Department of Computer Science, University of Illinois at Urbana-Champaign (Revised at 17 March 2003), March 1992. ftp://vibes.cs.uiuc.edu/pub/Pablo.Release.5/SDDF/ Documentation/SDDF.ps.gz. W. Smith, A system for monitoring and management of computational grids, in: Proceedings of the 31st International Conference on Parallel Processing (ICPP2002), IEEE Computer Society Press, 2002, p. 55. W. Smith, A Framework for Control and Observation in Distributed Environments, Tech. Rep. NAS-01–006, NASA Advanced Supercomputing Division, NASA Ames Research Center, July 2001. M.A. Baker, G.C. Smith, GridRM: an extensible resource monitoring system, in: Proceedings of the IEEE International Cluster Computing Conference, 1–4 December 2003, pp. 207–214. J.D. Case, M. Fedor, M.L. Schoffstall, C. Davin, Simple Network Management Protocol (SNMP), RFC 1157, May 1990. http://www.ietf.org/rfc/rfc1157.txt. A. Hawkeye, Monitoring and Management Tool for Distributed Systems, accessed on 27 October 2003. http://www.cs.wisc.edu/condor/hawkeye/. M. Litzkow, M. Livny, M. Mutka, Condor: a hunter of idle workstations, in: Proceedings of the Eighth International Conference of Distributed Computing Systems, San Jose, CA, 1988, pp. 104–111. R. Raman, M. Livny, M. Solomon, Matchmaking: distributed resource management for high throughput computing, in: Proceedings of the Seventh IEEE International Symposium on High Performance Distributed Computing (HPDC), IEEE Computer Society Press, Chicago, IL, USA, 1998, p. 140. P. Stelling, I. Foster, C. Kesselman, C. Lee, G. von Laszewski, A fault detection service for wide area distributed computations, in: Proceedings of the Seventh IEEE International Sym-
S. Zanikolas, R. Sakellariou / Future Generation Computer Systems 21 (2005) 163–188
[30]
[31]
[32]
[33]
[34]
[35]
[36]
[37]
[38]
[39]
[40]
[41]
posium on High Performance Distributed Computing, Chicago, IL, 1998, pp. 268–278. B. Tierney, B. Crowley, D. Gunter, J. Lee, M. Thompson, A monitoring sensor management system for grid environments, Cluster Comput. 4 (1) (2001) 19–28. Z. Balaton, P. Kacsuk, N. Podhorszki, Application monitoring in the grid with GRM and PROVE, in: Proceedings of the International Conference on Computational Science (ICCS2001), Part I, vol. 2073 of Lecture Notes in Computer Science, Springer-Verlag, San Francisco, CA, USA, 2001, p. 253. Z. Balaton, G. Gomb´as, Resource and job monitoring in the grid, in: Proceedings of the Ninth International Euro-Par Conference, vol. 2790 of Lecture Notes in Computer Science, Springer-Verlag, Klagenfurt, Austria, 2003, pp. 404–411. Z. Balaton, G. Gomb´as, GridLab Monitoring: Detailed Architecture Specification, Tech. Rep. GridLab-11-D11.2-01-v1.2, EU Information Society Technologies Programme (IST), 2001. http://www.gridlab.org/Resources/Deliverables/D11.2.pdf. G. Allen, K. Davis, K.N. Dolkas, N.D. Doulamis, T. Goodale, T. Kielmann, A. Merzky, J. Nabrzyski, J. Pukacki, T. Radke, M. Russell, E. Seidel, J. Shalf, I. Taylor, Enabling applications on the grid: a gridlab overview, Int. J. High Perform. Comput. Appl. 17 (4) (2003) 449–466. N. Podhorszki, P. Kacsuk, Design and implementation of a distributed monitor for semi-on-line monitoring of VisualMP applications, in: Proceedings of the Third AustrianHungarian Workshop on Distributed and Parallel Systems (DAPSYS2000), From Instruction Parallelism to Cluster Computing, Hungary, 2000, pp. 23–32. Z. Balaton, P. Kacsuk, N. Podhorszki, F. Vajda, From cluster monitoring to grid monitoring based on GRM, in: R. Sakellariou, et al. (Eds.), Proceedings of the Seventh International Euro-Par Conference, vol. 2150 of Lecture Notes in Computer Science, Springer-Verlag, Manchester, UK, 2001, pp. 874–881. B. Tierney, D. Gunter, NetLogger: a toolkit for distributed system performance tuning and debugging, in: G.S. Goldszmidt, J. Sch¨onw¨alder (Eds.), Proceedings of the IFIP/IEEE Eighth International Symposium on Integrated Network Management (IM 2003), vol. 246 of IFIP Conference Proceedings, Kluwer, 2003, pp. 97–100. D. Gunter, B. Tierney, K. Jackson, J. Lee, M. Stoufer, Dynamic monitoring of high-performance distributed applications, in: Proceedings of the 11th IEEE Symposium on High Performance Distributed Computing, HPDC-11, IEEE Computer Society Press, Edinburgh, Scotland, 2002, p. 163. C.E. Tull, D. Gunter, W. Lavrijsen, D. Quarrie, B. Tierney, GMA instrumentation of the athena framework using NetLogger, in: Computing in High Energy and Nuclear Physics (CHEP03), La Jolla, CA, 2003. R. Wolski, N. Spring, J. Hayes, The network weather service: a distributed resource performance forecasting service for metacomputing, J. Future Generation Comput. Syst. 15 (5/6) (1999) 757–768. I. Foster, C. Kesselman, J. Nick, S. Tuecke, The Physiology of the Grid: An Open Grid Services Architecture for Distributed Systems Integration, Tech. Rep., Global Grid Forum, June 2002. http://www.globus.org/research/papers/ogsa.pdf.
187
[42] M. den Burger, T. Kielmann, H.E. Bal, TopoMon: a monitoring tool for grid network topology, in: Proceedings of the International Conference on Computational Science (ICCS 2002), vol. 2230, Springer-Verlag, 2002, pp. 558–567. [43] B. Balis, M. Bubak, T. Szepieniec, R. Wism¨uller, M. Radecki, Monitoring grid applications with grid-enabled OMIS monitor, in: F.F. Rivera, M. Bubak, A.G. Tato, R. Doallo (Eds.), Proceedings of the First European Across Grids Conference, vol. 2970 of Lecture Notes in Computer Science, SpringerVerlag, Santiago de Compostela, Spain, 2004, pp. 230– 239. [44] The EU CrossGrid Project, accessed on 27 November 2003. http://www.eu-crossgrid.org. [45] T.L. II, R. Wism¨uller, OMIS 2.0: a universal interface for monitoring systems, in: M. Bubak, J. Dongarra, J. Wasniewski (Eds.), Proceedings of the Fourth European PVM/MPI Users’ Group Meeting on Recent Advances in Parallel Virtual Machine and Message Passing Interface, vol. 1332 of Lecture Notes in Computer Science, Springer-Verlag, Cracow, Poland, 1997, pp. 267– 276. [46] T. DeWitt, T. Gross, B. Lowekamp, N. Miller, P. Steenkiste, J. Subhlok, D. Sutherland, ReMoS: A Resource Monitoring System for Network-Aware Applications, Tech. Rep. CMU-CS-97–194, School of Computer Science, Carnegie Mellon University, December 1998. http://www-2.cs.cmu. edu/afs/cs/project/cmcl/www/remulac/remos-tr-2.ps. [47] P. Dinda, T. Gross, R. Karrer, B. Lowekamp, N. Miller, P. Steenkiste, D. Sutherland, The architecture of the Remos system, in: Proceedings of the 10th IEEE International Symposium on High Performance Distributed Computing (HPDC-10 2001), IEEE Computer Society Press, San Francisco, CA, USA, August 7–9, 2001, pp. 252–265. [48] P. Dinda, D. O’Hallaron, An Extensible Toolkit for Resource Prediction in Distributed Systems, Tech. Rep. CMUCS-99–138, School of Computer Science, Carnegie Mellon University, July 1999. http://www.reports-archive.adm. cs.cmu.edu/anon/1999/CMU-CS-99-138.pdf. [49] H.L. Truong, T. Fahringer, SCALEA-G: A Unified Monitoring and Performance Analysis System for the Grid, Tech. Rep., Institute for Software Science, University of Vienna, November 2003. ftp.vcpc.univie.ac.at/projects/aurora/reports/auroratr2. [50] H.L. Truong, T. Fahringer, SCALEA: a performance analysis tool for parallel programs, Concurrency Comput.: Pract. Experience 15 (11/12) (2003) 1001–1025. [51] B. Buck, J.K. Hollingsworth, An API for runtime code patching, Int. J. High Perform. Comput. Appl. 14 (4) (2000) 317–329. [52] M.L. Massie, B.N. Chun, D.E. Culler, Ganglia Distributed Monitoring System: Design, Implementation, and Experience, Parallel Computing 30 (2004) 817–840. [53] I. Foster, C. Kesselman, Globus: a toolkit-based grid architecture, in: The Grid: Blueprint for a Future Computing Infrastructure, Morgan-Kaufmann, 1999, pp. 259–278. [54] M. Wahl, T. Howes, S. Kille, Lightweight Directory Access Protocol (v3), RFC 2251, December 1997. http://www. ietf.org/rfc/rfc2251.txt. [55] I. Foster, C. Kesselman, G. Tsudik, S. Tuecke, A security architecture for computational grids, in: Proceedings of the ACM
188
[56]
[57] [58]
[59]
[60]
[61]
[62]
[63]
[64]
[65]
[66]
[67]
S. Zanikolas, R. Sakellariou / Future Generation Computer Systems 21 (2005) 163–188 Conference on Computers and Security, ACM Press, 1998, pp. 83–91. H.B. Newman, I.C. Legrand, P. Galvez, R. Voicu, C. Cirstoiu, MonALISA: a distributed monitoring service architecture, in: Computing in High Energy and Nuclear Physics (CHEP03), La Jolla, CA, 2003. J. Waldo, The Jini Architecture for Network-Centric Computing, Commun. ACM 42 (7) (1999) 76–82. H.B. Newman, I.C. Legrand, J.J. Bunn, A distributed agentbased architecture for dynamic services, in: Computing in High Energy and Nuclear Physics (CHEP01), 2001. B. Miller, M. Callaghan, J. Cargille, J. Hollingsworth, R. Irvin, K. Karavanic, K. Kunchithapadam, T. Newhall, The paradyn parallel performance measurement tools, IEEE Comput. 28 (11) (1995) 37–46. P.C. Roth, D.C. Arnold, B.P. Miller, MRNet: a software-based multicast/reduction network for scalable tools, in: Proceedings of the Supercomputing 2003 (SC 2003), Phoenix, AZ, 2003. P.C. Roth, D.C. Arnold, B.P. Miller, Benchmarking the MRNet distributed tool infrastructure: lessons learned, in: Proceedings of the High-Performance Grid Computing Workshop, held in conjunction with IPDPS, IEEE Computer Society Press, Santa Fe, NM, USA, 2004. B. Coghlan, A. Djaoui, S. Fisher, J. Magowan, M. Oevers, Time, information services and the grid, in: Advances in Database Systems (BNCOD): Supplement to the Proceedings of the 18th British National Conference on Databases at RAL, 9–11 July 2001. X. Zhang, J. Freschl, J. Schopf, A performance study of monitoring and information services for distributed systems, in: Proceedings of the 12th IEEE High Performance Distributed Computing (HPDC-12 2003), IEEE Computer Society Press, Seattle, WA, USA, 2003, pp. 270–282. M. Gerndt, R. Wism¨uller, Z. Balaton, G. Gomb´as, Z. N´emeth, N. Podhorski, H.-L. Truong, T. Fahringer, M. Bubak, E. Laure, T. Margalef, Performance Tools for the Grid: State of the Art and Future, Tech. Rep., Lehrstuhl fuer Rechnertechnik und Rechnerorganisation, Technische Universitaet Muenchen (LRR-TUM), January 2004. http://www.lpds.sztaki.hu/∼zsnemeth/apart/repository/ gridtools.pdf. Z. Balaton, P. Kacsuk, N. Podhorszki, F. Vajda, Comparison of Representative Grid Monitoring Tools, Tech. Rep. LDS-2/2000, Computer and Automation Research Institute of the Hungarian Academy of Sciences, 2000. http://www.lpds.sztaki.hu/publications/reports/lpds-2.pdf. M. Knop, J. Schopf, P. Dinda, Windows performance monitoring and data reduction using WatchTower, in: Proceedings of the Workshop on Self-Healing, Adaptive and self-MANaged Systems (SHAMAN), New York, 2002. N. Chalakornkosol, P. Uthayopas, Monitoring the dynamics of grid environment using grid observer (poster presentation), in: Proceedings of the IEEE CCGRID2003, Toshi Center, Tokyo, 2003.
[68] C.L. Mendes, D.A. Reed, Monitoring large systems via statistical sampling, in: Proceedings of the Los Alamos Computer Science Intitute (LACSI) Symposium, Santa Fe, 2002. [69] Views of Monitoring Data, accessed on 27 November 2003. http://www-unix.mcs.anl.gov/∼schopf/views.html. [70] CAIDA, the Cooperative Association for Internet Data Analysis: Performance Measurement Tools Taxonomy, accessed on 27 November 2003. http://www.caida.org/tools/ taxonomy/performance.xml. [71] N. Podhorszki, Z. Balaton, G. Gomb´as, Monitoring messagepassing parallel applications in the grid with GRM and mercury monitor, in: Proceedings of the Second European Across Grids Conference, Nicosia, Cyprus, 2004. [72] S. Zanikolas, R. Sakellariou, Towards a monitoring framework for worldwide grid information services, in: 10th International Euro-Par Conference, Vol. 3149, Lecture Notes in Computer Science, Springer-Verlag, Pisa, Italy, August 31–September 3, 2004, pp. 417–422. [73] Z. Balaton, G. Gomb´as, Z. N´emeth, Information system architecture for brokering in large scale grids, in: Proceedings of the DAPSYS 2002 on Parallel and Distributed Systems: Cluster and Grid Computing, Kluwer, Linz, 2002, pp. 57–65. [74] M. Dikaiakos, Y. Ioannidis, R. Sakellariou, Search engines for the grid: a research agenda, in: F.F. Rivera, M. Bubak, A.G. Tato, R. Doallo (Eds.), Proceedings of the First European Across Grids Conference, vol. 2970 of Lecture Notes in Computer Science, Springer-Verlag, Santiago de Compostela, Spain, 2004, pp. 49–58. [75] Netcraft, accessed on 2 February 2004. http://www. netcraft.com. [76] Alexa, accessed on 2 February 2004. http://www.alexa.com.
Serafeim Zanikolas received a BSc degree in Software Engineering (2001), and a MSc in Computer Science (2003), from the Technological Educational Institute of Thessaloniki, Greece, and the University of Essex, UK, respectively. He is currently doing research in the area of monitoring and information services in Grid computing, as part of his PhD study at the School of Computer Science of the University of Manchester, UK. Rizos Sakellariou received his PhD degree, in Computer Science, from the University of Manchester in 1997 for a thesis on symbolic analysis techniques with applications to loop partitioning and scheduling for parallel computers. Since January 2000, he has been a Lecturer in Computer Science at the University of Manchester. Prior to his current appointment, he was a visiting Assistant Professor at the University of Cyprus (fall 1999), and a postdoctoral research associate at Rice University (1998–1999) and the University of Manchester (1996–1998). His primary area of research is in parallel and distributed systems, but his research interests also include compilers, computer architecture, performance modelling and evaluation, scheduling, and their interactions.