Solar Physics DOI: 10.1007/•••••-•••-•••-••••-•
arXiv:1001.4884v1 [astro-ph.SR] 27 Jan 2010
A Technique for Removing Background Features in SECCHI–EUVI He ii 304 ˚ A Filtergrams: Application to the Filament Eruption of 22 May 2008 G. Artzner1 · S. Gosain2 · B. Schmieder3 c Springer ••••
Abstract The STEREO mission has been providing stereoscopic view of filament eruptions in EUV. The clearest view during a filament eruption is seen in He ii 304 ˚ A observations. One of the main problems visualizing filament dynamics in He ii 304 ˚ A is the strong background contrast due to surface features. We present a technique that removes background features and leaves behind only the filamentary structure, as seen by STEREO-A and B. The technique uses a pair of STEREO He ii 304 ˚ A images observed simultaneously. The STEREO-B image is geometrically transformed to STEREO-A view so that the background images appear similar. Filaments being elevated structures, i.e., not lying on the same spherical surface as background features, do not appear similar in the transformed view. Thus, subtracting the two images cancels the background but leaves behind the filament structure. We apply this technique to study the dynamics of the filament eruption event of 22 May 2008, which was observed by STEREO and followed by several ground-based observatories participating in the Joint Observing Programme (JOP 178). Keywords: Filament disappearance; STEREO; CME; Plasma
1. Introduction Stereoscopic observations of filament eruption in EUV wavelengths are now routinely recorded by the SECCHI–EUVI instrument onboard the STEREO spacecraft (Kaiser et al., 2008). Using these stereoscopic observations we can reconstruct the three-dimensional geometry and the trajectory of erupting filaments (Gissot et al., 2008; Liewer et al., 2009; Gosain et al., 2009). Of these EUV observations, the He ii 304 ˚ A observations are most useful in tracing filaments because: i) the filament spine appears much sharper and clearer (Martin, Engvold, 1
Institut d’Astrophysique Spatiale Bˆ at. 121, 91405, Orsay, France email:
[email protected] 2 Udaipur Solar Observatory, P. Box 198, Dewali, Udaipur 313001, India email:
[email protected] 3 Observatoire de Paris, LESIA, 92190 Meudon, France email:
[email protected]
SOLA: ms_ver3.tex; 27 January 2010; 16:06; p. 1
G. Artzner et al.
Lin, 2007; Joshi and Srivastava, 2007), and ii) the filament can be traced up to higher altitudes compared to Hα images (Joshi and Srivastava, 2007). For the quiet Sun, He ii 304 ˚ A corresponds to plasma temperatures of ≈ 60 − 80×103 K. At these wavelengths, the bright and dark background features overlay network and intra-network elements, respectively. The filaments are seen in absorption as dark structures on the disk and are seen in emission as prominence above the limb. During erupting phase, the filaments seen on disk become diffuse and lose contrast and are not very easy to distinguish against background features. Studying the dynamics of erupting filaments is very important to understand the global equilibrium of filaments and has relevance for space weather prediction. Here, we present a technique for improving the contrast of the filaments by removing the background features as seen in He ii 304 ˚ A filtergrams. The technique uses a pair of simultaneously observed STEREO-A and STEREO-B images. After data reduction, the STEREO-B image is geometrically transformed into the STEREO-A view, so the background images appear similar. Filaments being elevated structures, i.e. not lying on same spherical surface as the background features, do not appear similar in the transformed view. Thus, by taking difference of the two images, the background features cancel and only the elevated structures like filaments appear. We call this the difference method. This difference method is valid only if the filament is visible on the disk in both STEREO images. With this technique it is possible to detect faint filament structures by removing the background features which enhances the filament visibility. The larger separation between the viewing angles is an advantage as the projections are very different for elevated structures like filaments as compared to surface features like plages. This results in a better contrast in the difference image due to non-overlapping of elevated structures in the transformed view. Making movies out of such difference images allows us to visualize the dynamics of the filaments in a much better way. We present, as an illustration, an application of this technique to a filament disappearance or disparition brusque (DB) event of 22 May 2008, when the separation angle between STEREO satellites is about 52.4◦ . Mouradian and Soru-Escaut (1989) classified DBs into two categories, one due to dynamic and the other one due to thermal instability. In case of filament disappearance due to thermal instability the filament reappears after the plasma has cooled down. In the 22 May 2008 event the initial dense filament became an untwisting flux rope with multiple threads with a fan-shaped structure which rose and disappeared one by one into the corona. The plasma becomes optically so thin as the flux rope rapidly expands in the corona that it remains no longer visible. So, although the filament is not dense enough to be seen as erupting filament at larger distances from the Sun, we can rule out thermal instability to be the cause of this event, as the filament did not reform at this location even after several days. The key point here is that for widely separated STEREO views we could detect filament dynamics of this faint event by applying the difference method and removing the background features. The movie made out of these difference images show the filament dynamics with much more clarity than the traditional
SOLA: ms_ver3.tex; 27 January 2010; 16:06; p. 2
Background Feature Removal in STEREO Images
movies where the background chromospheric features are present. With the difference movie we make a reasonable interpretation that this filament is eruptive, which is not so obvious in normal movies. Details of the technique of geometric transformation are given in Section 2. The case study of the 22 May 2008 filament eruption is presented in Section 3. In Section 4 we discuss the technique and results of the case study.
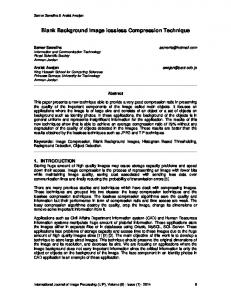
2. Technique of Background Feature Removal 2.1. Illustration of Method Since filaments are three-dimensional structures with heights extending up to a few 100 Mm, they are seen differently when viewed from different angles, specially when the separation between the viewing angles is large. An illustration of this effect is shown in Figure 1. The top panel shows a filament and a solar surface feature i.e., a plage, observed from different angles by STEREO A and B satellites. Both images represent solar disk in the epipolar view (Inhester, 2006), i.e., the central latitude (equator) in both the images represents the epipolar line. While plage is a background feature, the filament is a three-dimensional structure extending into the solar corona. Hence its projection is seen differently from STEREO-A and B as compared to the background features. The background features seen in He ii 304 ˚ A images are assumed to be on a sphere of radius R≈ 696 Mm (photosphere) + 4 Mm (chromosphere) = 700 Mm. On transforming the STEREO-B image to the reference frame of STEREO-A, we see that unlike the plage, the filament is seen differently due to different projections. However, one must be careful because the plage is not observed from the same point of view, so that transforming it using the interpolation step may introduce some distortion effects. Taking the difference of STEREO-A image and the transformed STEREO-B image, we see that the surface feature (plage) cancels nicely while the filament leads to imbalanced difference image. This difference depends on: i) the location of the filament on the solar disk with respect to the observer, i.e., the filament should be on the disk (for both STEREO A and B views) despite the large angle between the twin satellites, ii) the height of the filament, and iii) the inclination of the filament sheet with respect to the local solar vertical direction. In Figure 1, we have neglected the inclination of the filament for simplification. The inclined filaments will in general pose a difficulty in interpreting the structures, specially if the spine is oriented along the line-of-sight, hiding the filament structure below itself. 2.2. STEREO Image Transformation The geometric illustration in Figure 2 presents the notations used in the text below describing the method of transformation. Let hdra and hdrb be the IDL structures of the headers for the A and B images of a STEREO/SECCHI–EUVI pair. The points in the physical space are noted with O as the center of the
SOLA: ms_ver3.tex; 27 January 2010; 16:06; p. 3
G. Artzner et al.
STEREO-A
90 60
30
STEREO-B
0
90
STEREO-A
90 60
30
60
30
De-projected (STEREO-B)
90 60
0
30
0
A – De-projected (B)
90 60
30
0
Figure 1. An illustration of the basic idea behind the method. Top: The top panel illustrates a filament and a plage seen from different angles by STEREO A and B. The images are represented in epipolar view, with the grid representing the “SECCHI Grid”. While plage is a surface feature, the filament is a three-dimensional structure in the solar corona. The filament is assumed to be in a vertical sheet. Hence its projection is seen differently from STEREO A and B as compared to the plage. Middle: On de-projecting the STEREO-B image to the reference frame of STEREO-A we see that unlike plage the filament cannot be reconciled due to different projections. Bottom: On taking the difference of STEREO-A image and de-projected STEREO-B image we see that the surface features (illustrated by a plage) cancels nicely while the filament leads to an imbalanced (black and white) difference image.
SOLA: ms_ver3.tex; 27 January 2010; 16:06; p. 4
Background Feature Removal in STEREO Images
r b O
o
a
s A
B
Earth Figure 2. Geometric illustration of the angles used for de-projecting the STEREO images. The dashed line and ellipse in green color show rotation axis of Sun and Equator respectively in “Carrington grid” representation. The solid line and ellipse in black color show the epipolar axis and equator respectively in “SECCHI grid” representation. “O” and “o” are the same points, i.e., the centre of Sun. Oa is normal to plane OrA, and Ob is normal to plane OrB, where Or is rotation axis of the Sun.
solar sphere, A and B as the position of STEREO-A and B respectively, M as intersection of the line-of-sight of the current point of the STEREO-A image with a transparent reference sphere of arbitrary radius Rsol concentric to the Sun. Relative to the sphere: the center [o], the north pole [r] of the solar Equator, the south pole [s] of the normal of the mission plane are determined by the Sun and the STEREO spacecrafts. The eastern, towards Earth, direction of the normal to the plane determined by STEREO-A and the Sun’s axis of rotation is indicated by the point a on the sphere. The eastern, away from Earth, direction of the normal to the plane determined by STEREO-B and the Sun’s axis of rotation is indicated by the point b on the sphere. The position of the south pole [s] normal to the mission plane is given by the vector, os = OA × OB/|OA × OB|. The position of a is given by the vector oa = OA × Or/|OA × Or| and the position of b is given by the vector ob = OB × Or/|OB × Or|. The trace of the mission plane in each image is the epipolar plane. Both images are best compared when their epipolar plane are aligned. The angle from polar north to the epipolar plane is, acos(os · oa). The roll angle of the satellite is given in the image header as the CROTA parameter. The Chasles relation gives the amount of rotation, −hdra.CROTA − 90 + acos(os · oa) and −hdrb.CROTA − 90 + acos(os · ob) to be applied to the raw images in order to obtain epipolar plane parallel to the x-axis.
SOLA: ms_ver3.tex; 27 January 2010; 16:06; p. 5
G. Artzner et al.
By analogy with the Carrington grid, we then introduce the notion of “SECCHI Grid” of meridian circles perpendicular to and of latitude circles parallel with the mission plane. In the figure “SECCHI grid”, the longitude range spans from 90◦ to the East to 90◦ to the West of the central meridian, as seen from STEREO-A. Homologous points have to be located on the same latitude circle. When homologous points are not located at the same relative position with respect to the meridian great circles, a simple reasoning indicates where the relevant structure is located, above or below the level of the sphere upon which the reference grid is drawn. 2.3. De-projection of STEREO-B image to STEREO-A Let ia and ja be the integer coordinates of the current image point Pa of the STEREO-A image. As a first step, these integer raw coordinates are transformed into fractional centered coordinates by using the parameters CRPXi in the header, and further rotated to the mission-plane system with the rotation as determined above with the Chasles rotation. Taking into account the values of two distances, the radius of the reference sphere and the Sun to spacecraft distance, and the scale factors CDELTj in the header of the STEREO-A image converting pixel numbers into angles, the set of two fractional coordinates pertaining to Pa allows us to compute by classical geometry the x, y, z coordinates of the physical point M corresponding to Pa . The “SECCHI-A” latitude and longitude of the p point M are then computed respectively as acos(y/ x2 + y 2 ) and atan(z, x), in order to possibly add a “SECCHI grid” to the images. The “SECCHI-B” zcoordinate of the point M is, by definition of the SECCHI system, equal to its “SECCHI-A” value. The “SECCHI-A” to “SECCHI-B” transformation for the x and y coordinates is obtained by the rotation of the angle between A and B , as seen from the Sun. Using again the values of two distances, the radius of the reference sphere and the Sun to STEREO-B and the scale factor as indicated by the parameters CDELTj in the header of the STEREO-B image, we compute the fractional coordinates of the homologous point Pb in the STEREO-B image. It should be noted that in this procedure we compute exactly the coordinates of the homologous point in the STEREO-B image related to the current point in the STEREO-A image. We do not use the approximations used when rotating images. One approximation that we use is a bi-cubic spline function, when interpolating the measured intensity in the STEREO-B image relative to the physical point M .
3. Application to STEREO Data 3.1. Basic Steps The basic steps required are as follows: • •
SECCHI PREP data reduction Centering of images
SOLA: ms_ver3.tex; 27 January 2010; 16:06; p. 6
Background Feature Removal in STEREO Images
Epipolar Orientation 2008/05/22 10:56:15 UT
B projected to A 2008/05/22 10:56:15 UT
Figure 3. Top panel shows STEREO A, B images in epipolar orientation after the raw images have been centered and re-scaled. The middle panel shows the STEREO B image projected to STEREO A. Bottom panel shows the difference of the two images in the middle panel. It can be noticed that only the filament and other elevated structures remain as black–white difference features while background features are completely removed, particularly the white plage.
SOLA: ms_ver3.tex; 27 January 2010; 16:06; p. 7
G. Artzner et al.
• • • •
Re-scaling the images for common size of solar disk. Correction for the roll orientation. Constrained by the criteria that common or homologous features lie on the epipolar line. Transformation of STEREO-B to A. Taking the difference image.
These steps are demonstrated on the real observations in Figure 3. These STEREO observations are of a filament eruption on 22 May 2008 at 10:56 UT observed in He ii 304 ˚ A. The caption of Figure 3 explains the different steps applied to these observations to yield a difference image. 3.2. Global View of Filament Eruption on 22 May 2008 The filament eruption of 22 May 2008 has been previously studied by Gosain et al., (2009). The height of the filament was derived using the triangulation method SCC MEASURE (Thompson, 2006) for one set of observations during the eruption phase at 10:56 UT on 22 May. The filament spine reached an altitude of ≈ 180 Mm. Here, we use the difference images to derive the qualitative information about the filament as it evolved and finally erupted. To this end, we made a movie of the difference images which is made available as electronic supplementary material (movie1.mpg). The time sequence of such difference images are useful to study the evolution of filament. In Figure 4, we show the difference images created using STEREO-A and B observations of 22 May during different phases of the eruption. We summarize the qualitative information about the filament evolution, using these difference images, in Table 1. Initially, the erupting section of the filament has a helical shape with an estimated three turns. Branching into three parts appear on one end (upper end) of the filament. Subsequently, we see thin long filamentary structures with a slow rising motion. Later, the spine disappears and only the three branches remain visible, which erupt with a oscillating motion. All the threads are very thin and will not be visible with a low spatial resolution telescope. The filament structure was inflating before rising and erupting, and the material cools to escape along field lines until it is no more distinguishable because of its weak contrast. The filament eruption was rather slow, with successive eruptive phases concerning different parts of the filament, and lasted for about 24 hours, disappearing completely by about 18:00 UT on 22 May 2008. After viewing the difference movie (movie1.mpg) we get an impression that it is a slow eruption with top threads disappearing slowly. If it was a thermal DB it would perhaps reappear as the plasma cools down, we do not see such reappearance for next few days. While the structure of the filament can be studied with the difference images, we can also use difference images to detect filaments over the solar disk. By clipping the difference signals for the filament, i.e. putting 1 or 0 for negative or positive difference values respectively above certain threshold, we made movies of the filament disappearance. This movie is useful to identify the filaments on the disk, specially when an automated identification is required. The movie is included as electronic supplementary material (movie2.mpg).
SOLA: ms_ver3.tex; 27 January 2010; 16:06; p. 8
Background Feature Removal in STEREO Images
(a)
(b)
(c)
1 1
2
2 3
3
21/05/17:16
21/05/15:06
(e)
(d) 1
21/05/22:26 (f)
2 3
22/05/01:06
22/05/02:06
22/05/11:26
˚ filtergrams (STEREO A is white, Figure 4. Difference images obtained with He ii 304 A STEREO B is black). The description of the panels is as follows: (a) The filament is helicoidal with three turns shown by arrows, numbered as 1, 2, and 3. (b) The three branches (blobs), numbered as 1, 2, and 3, are shown by arrows. (c) A thin filament spine is visible at the location marked by arrow. (d) Filament seems to split into three branches along its length, numbered as 1, 2 and 3. (e) Apparent twist in the filament is represented by arrows. (f) The filament is in erupting phase, the STEREO-A view (white part) is now expanded with a fan shape. A movie of all the difference images (available online as supplementary material) shows oscillating fine threads during this time.
A observations Table 1. Sequence of events in He ii 304 ˚ Observation 1. 2. 3. 4.
Date
Helicoidally shape with three turns Three branches are visible Thin filament at the latitude -20◦ Filament changing with three branches instead of a spine 5. Twist 6. Fan and oscillating threads 7. Complete disappearance
21 21 21 22
Time (UT)
May May May May
15:06 17:16 22:26 01:06
22 May 22 May 22 May
02:06 11:26 18:00
SOLA: ms_ver3.tex; 27 January 2010; 16:06; p. 9
G. Artzner et al.
3.3. Partial Filament Eruption With the help of difference images we find that there is another faint filament located close (southwards) to the filament discussed above, which erupts earlier during 02:00 UT to 07:00 UT on 22 May 2008. The two difference images displayed in the upper panel of Figure 5, show the disappearance of this faint filament (marked by white arrows). From the movie of difference images it appears that the two filaments are connected closely. So, we can consider this faint filament eruption as a case of partial filament eruption. The part of the filament which disappeared is represented by the white arrow in the mosaic. A CME was detected by the STEREO-A COR2, Solar Mass-Ejection Imager (SMEI) and Large Angle and Spectrometric Coronagraph (LASCO) C2 instruments around this time. A movie of STEREO-A COR2 observations of the CME is made available as electronic supplementary material (movie3.mpg). However, the association of the CME with this partial filament eruption could not be clearly established due to another off-limb prominence eruption nearby on 21 May 2008. It could also happen that the CME associated with partial filament eruption was too faint to be detected by these instruments. Filament eruptions and associated CMEs are commonly interpreted in terms of helical magnetic flux rope structure (2000). Whether, these flux ropes exist prior to eruption or they are formed during eruption, is still a controversy. An alternative model, suggested by Gibson and Fan (2006), is known as the “partially-expelled flux rope” (PEFR) model. In this model, a flux rope exists prior to the the CME and as it erupts it reconnects internally and with the surrounding fields and breaks into two flux ropes. One portion of the rope is expelled as a CME while the other flux rope remains attached. Several partial filament eruptions were studied by Tripathi et al., (2009) and were found to be consistent with the PEFR model. In our observations, the faint filament eruption event could be a partially erupting flux rope with either no CME at all or no CME detected. The other remaining part of the flux rope, i.e., the filament discussed in previous section, erupts 8 to 12 hours later. The second filament eruption could be due to destabilization caused by the partial filament eruption.
4. Discussion and Conclusions We describe a method that helps to study filament eruptions using He ii 304 ˚ A observations from STEREO. The elevated structures are seen better if the separation angle is large because the difference signal is enhanced as there is no overlapping of structures. This method has the potential to be used to detect not only the filaments but also other elevated structures like plumes or jets. This could be very useful in studies of transient events. In the present paper, the method has been applied to real observations of a filament eruption on 22 May 2008, when the separation angle of the two STEREO satellites was equal to 52.4◦ . At such large separation angles the traditional stereoscopic techniques, like triangulation method as identifying common features in both images is difficult. Hence, we need to use alternative techniques
SOLA: ms_ver3.tex; 27 January 2010; 16:06; p. 10
Background Feature Removal in STEREO Images
22-May-2008 00:06 UT
22-May-2008 06:06 UT
Figure 5. The difference images during 00:06 UT and 06:06 UT shows the partial filament (marked by white arrows) disappearance.
like the difference method to extract the three dimensional information about the filament. Here, a qualitative study of the eruption event is done with the difference images, which gives a global view of the event. The movie of the difference images (movie1.mpg) shows clearly the evolution and dynamics of the erupting filament, which is not so clear in conventional movies made of intensity pictures. Further, a faint CME was observed by STEREO-A COR2 on 22 May 2008, during 02:00 UT to 07:00 UT. However, the association of this CME with this partial filament eruption is ambiguous because of another filament eruption on 21 May 2008 which occurred nearby off the limb. This faint filamentary structure could be seen clearly in the “clean” images. Also, this event concerns a large region on the Sun (about a quadrant of the visible solar disk), which becomes evident in the movie of difference images of He ii 304 ˚ A. Also, with proper thresholds, the method could be used to make automatic detection of filaments and transient events. Thus, this image processing technique helps in the studies of solar eruptive phenomena by isolating filament features from background chromospheric features. Also, with the launch of Solar Dynamics Observatory (SDO) there is a possibility of applying these techniques to STEREO-A–SDO, STEREO-B–SDO pairs.
Acknowledgements
SG acknowledges CEFIPRA funding for his visit to the Observatoire
de Paris, Meudon, France under its project No. 3704-1. The STEREO/SECCHI data are produced by a consortium of RAL (UK), NRL (USA), LMSAL (USA), GSFC (USA), MPS (Germany), CSL (Belgium), IOTA (France), and IAS (France).
SOLA: ms_ver3.tex; 27 January 2010; 16:06; p. 11
G. Artzner et al.
References Amari, T., Luciani, J.F., Mikic, Z., Linker, J.: 2000, Astrophys. J. Lett. 529, L49. Gibson, S.E., Fan, Y.: 2006, Astrophys. J. Lett. 637, L65. Gissot, S.F., Hochedez, J.F., Chainais, P., Antoine, J.P.: 2008,Solar Phys. 252, 408. Gosain, S., Schmieder, B., Venkatakrishnan, P., Chandra, R., Artzner, G.: 2009, Solar Phys. 147. Inhester, B.: 2006,arXiv:astro-ph/0612649. Joshi, V., Srivastava, N.: 2007, Bull. Astron. Soc. India 35, 455. Kaiser, M.L., Kucera, T.A., Davila, J.M., St. Cyr, O.C., Guhathakurta, M., Christian, E.: 2008, Space Sci. Rev. 136, 16. doi:10.1007/s11214-007-9277-0. Liewer, P.C., de Jong, E.M., Hall, J.R., Howard, R.A., Thompson, W.T., Culhane, J.L., Bone, L., van Driel-Gesztelyi, L.: 2009, Solar Phys. 256, 57. Martin, S.F., Engvold, O., Lin, Y.: 2007, Bull. Am. Astron. Soc. 38, 245. Mouradian, Z., Soru-Escaut, I.: 1989, Astron. Astrophys. 210, 416 – 416. Thompson, W.T.: 2006, Astron. Astrophys. 449, 791. Tripathi, D., Gibson, S.E., Qiu, J., Fletcher, L., Liu, R., Gilbert, H., Mason, H.E.: 2009, Astron. Astroph. 498, 295.
SOLA: ms_ver3.tex; 27 January 2010; 16:06; p. 12