Information Technology and Control
ITC 1/47 Journal of Information Technology and Control Vol. 47 / No. 1 / 2018 pp. 5-25 DOI 10.5755/j01.itc.47.1.18171 © Kaunas University of Technology
2018/1/47
A Time-Constrained Algorithm for Integration Testing in a Data Warehouse Environment Received 2017/05/11
Accepted after revision 2018/01/22
http://dx.doi.org/10.5755/j01.itc.47.1.18171
A Time-Constrained Algorithm for Integration Testing in a Data Warehouse Environment Ljiljana Brkić, Igor Mekterović
University of Zagreb, Faculty of Electrical Engineering and Computing, Unska 3, 10000 Zagreb, Croatia, e-mail:
[email protected],
[email protected] Corresponding author:
[email protected] A data warehouse should be tested for data quality on regular basis, preferably as a part of each ETL cycle. That way, a certain degree of confidence in the data warehouse reports can be achieved, and it is generally more likely to timely correct potential data errors. In this paper, we present an algorithm primarily intended for integration testing in the data warehouse environment, though more widely applicable. It is a generic, time-constrained, metadata driven algorithm that compares large database tables in order to attain the best global overview of the data set’s differences in a given time frame. When there is not enough time available, the algorithm is capable of producing coarse, less precise estimates of all data sets differences, and if allowed enough time, the algorithm will pinpoint exact differences. This paper presents the algorithm in detail, presents algorithm evaluation on the data of a real project and TPC-H data set, and comments on its usability. The tests show that the algorithm outperforms the relational engine when the percentage of differences in the database is relatively small, which is typical for data warehouse ETL environments. KEYWORDS: Data Warehouse Testing, ETL, Integration Testing, Data Quality.
1. Introduction Data quality is a key factor in data warehouse (DW) and business intelligence solutions. Continuous testing of a DW can provide a solid assessment of the data quality. DW testing process should be implemented at very early stages of DW system development, leading to early error detection and correction which will, in
turn, increase DW’s credibility and decrease operational costs in the long run. DW testing is closely related to the quality of stored data. Data quality issues in DW environment are studied in [3], [20]. Typically, quality of data delivered to users is described and evaluated using quality at-
5
6
Information Technology and Control
tributes [38]. These attributes are called data quality dimensions. Each dimension covers a specific aspect of quality. For quantitative assessment of quality dimensions, it is necessary to define metrics and measurement methods. Researchers have recognized the importance of this issue and many research papers (some of which are [13], [18], [21], [30], [38]) deal with methods of measuring or quantifying dimensions of data quality. Apart from the source data, the quality of DW data is also affected by the ETL process used to integrate and transfer the data. Faulty ETL process, whether because of the faulty logic, inappropriate data refreshment strategy or just plain programming errors, can cause data not to be transferred to the DW or not to be transferred in a timely fashion. With that in mind, it is important to assess how accurate and complete data are: whether all required data from the data sources are extracted, stored in the staging area, transformed and subsequently loaded into the DW and whether the data in the DW are accurate with regards to the source data. We adopt the accuracy definition from [3] “Accuracy is defined as the closeness between a value v and a value v’, considered as the correct representation of the real-life phenomenon that v aims to represent” and completeness definition from [2]: “Presence of all defined content at both data element and data set levels.” The assessment of accuracy and completeness of the data in a DW imposes comparing large data sets which is at the core of the DW’s integration testing [24]. This paper is concerned with those very issues – we present an algorithm for integration testing of accuracy and completeness of the DW data in the sense of the aforementioned definitions. Integration testing is an approach to software testing where software components are combined and tested as a group, with the purpose of ensuring that interacting components or subsystems interface correctly with one another. Integration testing in DW environment usually only includes testing the ETL application, which comprises of numerous packages. ETL packages are tested by examining data at the endpoints (input and output) of those packages. In DW environment, we can identify three typical subsystems that ETL application deals with: data source(s), data staging area and DW production tables (typically dimension and fact tables). We perform integration testing by comparing vari-
2018/1/47
ous corresponding data sets from those three sources using the proposed TCFC (Time-Constrained Fragment and Compare) algorithm. The algorithm is generic and widely applicable, not limited to DW environment. It provides an overview of the differences between two data sets depending on the assigned time frame, from performing shallow comparisons to pinpointing exact differing tuples. We present the algorithm in detail, comment on its features, evaluate it on data of a real project as well as on mock data and comment on the results.
2. Motivation The primary objective of the integration testing and TCFC algorithm presented in this paper is to get a global overview of the data quality in the DW with a focus on accuracy and completeness measures. These measures are considered with respect to the source systems, as we assume that the data in the source system are accurate and complete. In this generic test integration scenario, involving source, staging and DW subsystems, testing should provide answers to the following questions: a whether all required data from the data sources
been extracted and transferred to the staging area (completeness), and whether staging area attribute values are equal to corresponding values in source systems (accuracy);
b whether all required data from the staging area
been transferred to the DW (completeness), and whether corresponding attribute values are equal (accuracy).
To answer the first question, the data from the data sources must be compared to the data stored in the staging area, where they are stored in the identical or similar schemas. To answer the second question, data from the staging area must be compared to the data in the DW, where they may be stored in different (though mappable) structures, e.g., dimensional model. In both cases, the problem boils down to comparing two sets of database tables having identical or different but mappable schemas to find missing or excess tuples on either side, and/or matching tuples with different values of non-key attributes. Relational database engines are a natural solution
Information Technology and Control
to that problem, since they are highly optimized for set operations on data: Two tables can be compared for differences with a single SQL statement. This approach, however, which will be referred to as reference implementation hereafter, has two serious drawbacks that motivated our research: 3 It is not possible to span a single SQL query across
heterogeneous platforms. That is a common scenario in DW environment, especially between source systems and staging area. To compare tables from different environments, table from one server would have to be transferred to a (temporary) table on the other server or some sort of database integration software would have to be used that would abstract that operation. Either way, the very operation of moving the data from one DBMS to another is subject to error. Transfer errors can occur for various reasons. For instance, IBM Informix’s DATE type has a wider DATE range than SQL Server’s, and rows with such dates simply cannot be inserted into the SQL Server table having the exact same schema.
4 It is an all-or-nothing approach. It is not possible
to perform a “shallow comparison” – a comparison that would take much less time to execute but would not be completely accurate (i.e. detect all differences in all tables) and/or precise (i.e. pinpoint the exact tuples causing differences). All rows from one table are compared to all rows from the other table and in the case when there is a substantial number of rows (tens of millions and more), such a comparison can also take a substantial resources to execute. A large table comparison could block all others and take up all available time. In other words, such queries cannot be appropriately time-managed to fit into a given time frame. Time managing queries is very important because testing procedures have to fit into the ETL’s acceptable time frame. It is unacceptable to query the data sources at arbitrary times, inflicting additional burden on the production systems.
Sometimes, when comparing two tables via a single SQL statement, it is handy to use a hash function (e.g., MD5) to produce the checksum of the tuple. This shortens the SQL statement, but, in general, calculating checksums additionally slows the comparison and is not suitable for large data sets, especially if checksums cannot be stored (e.g., ETL has read only
2018/1/47
access to source systems). Checksums are applicable to TCFC with similar properties, as commented in Section 3.1. In terms of complexity, comparing two data sets is O(n2) complex, where every record from the first set has to be compared with records from the second set. Another valid approach, used by some commercial tools (e.g., SQL Data Examiner [35]), is to fetch records sorted by the primary key from the databases and perform a less complex merge-sort style comparison; however – it must be taken into account that sorting data at the sources incurs additional costs. Both approaches suffer from the 2nd drawback described above: they are prone to blocking the entire comparison when large tables are examined. In addition, such approaches rely heavily on the client’s resources (disk and memory) as both sets must be retrieved in their entirety. Time-managing testing (queries) is what makes this problem difficult, and, to the best of our knowledge, has not been addressed in the literature so far (see the section “Related Work” for more). This motivated us to develop an algorithm that will surpass these limitations, yet remain comparable to the reference implementation in terms of speed. Since the expected number of differences between the tables is relatively small when compared to the total number of rows, we formulate the TCFC algorithm requirements as follows: _ _ When applied to large data sets with a small number of differences, the algorithm should be comparable in terms of speed with the reference implementation. One could argue that having 10k or 100k faulty tuples is “the same” because such a large number of errors is either a sign of systemic error or an unmanageable number of data errors that cannot be manually corrected. Therefore, the algorithm should work well for a manageable number of differing rows, hundreds or thousands of errors, not millions. _ _ Must be suitable for comparing data across
heterogeneous platforms.
_ _ Must be time manageable, to fit into a configured
time frame, at the expense of precision. In other words, it must be able to perform “shallow comparisons” and, consequently, has to be configurable.
The idea is to leverage the relational engine by break-
7
8
Information Technology and Control
ing down the exhausting reference query into many faster queries that search for potential errors in a greedy fashion. This is done by subsequently breaking data into horizontal fragments and comparing fragment counts (and/or other aggregated values) of corresponding fragments. As the algorithm progresses, fragmentation filters are refined, so that the fragments become smaller. Fragments where inequalities are detected are examined with higher priority. Eventually, if so configured and if time allows it, the comparison could be brought to the primary key level, thus yielding the exact missing or excess tuples. When designing the TCFC algorithm, we were guided by the thought that, given a limited time, it is better to acquire a possibly not completely accurate overview of all tables rather than an accurate comparison of some tables, while leaving others not examined. We denote this approach as “good enough global overview”. In other words, if there is a large set of table pairs with only several containing differences, it is considered better to report that there are some differences in all of the pairs actually containing differences, than to pinpoint exact differences in just a few of them, and leave the rest of the tables unexamined. It is a position that we have attained after participating in few real world projects and, though it might not be the best strategy for all applications, we believe that it is the best one in the most of DW ETL scenarios.
3. TCFC Algorithm The TCFC algorithm is designed to be as generic as possible and to work on heterogeneous platforms and with large data sets. To apply the proposed algorithm to a DW, the following conditions must be met: _ _ Data sources are relational databases, since the algorithm leverages relational engine. Other sources of data (text files, spreadsheets or other office documents, XML files, etc.) are not supported. As a workaround to this limitation, data from other sources can be processed and stored in a relational database (“piped through”). _ _ Each record in the destination table corresponds
to exactly one record in the source table. This requirement can be worked around by adding an additional metadata layer to describe the acceptable differences. For instance, with slowly
2018/1/47
changing dimensions, the number of regular “duplicates” can be kept. Furthermore, a generic system of human reviewing and (dis)approving differences could be put in place, where an analyst would mark the correct differing tuples and they would be taken into account in the future comparisons. We do not describe such system in more detail here, though. As a side note, our realworld project use-case required for a 100% match between the source and DW (students’ exams, year and course enrollments, etc.). _ _ Data lineage [4-5] must be established, there must be a way to determine the source for each tuple in data warehouse tables. To do so, it might be necessary to make minor modifications to existing ETL procedures. The procedure for establishing data lineage in existing systems, which is used in this paper, is described in detail in [26]. In the following two sections, we formally describe the table-level part of the TCFC algorithm for comparing tables with identical and non-identical schemas, then present the overall algorithm in a pseudo code, provide a running example, present and discuss the performance testing and the associated results.
3.1. Determining Inequalities in the Content of . Tables Having Identical Schemas The algorithm works by fragmenting tables according to a fragmentation set, then one or more aggregate functions are evaluated upon each fragment, and finally, the results from the corresponding fragments are compared. Any differences, if found, indicate not only that the contents of � and � are different, but also point out to the group of tuples, i.e. fragment of the relation to which the problem pertains. What follows is a formal description of the stated. Let � and � be the tables (relations) having the schema �. Let � denote a relation with schema � = {�� , … , �� }. Domain for attribute � is denoted by ���(�). Let � be a (possibly empty) subset of �. Let � denote a tuple. Let ���� denote an X-value of �, i.e. tuple � restricted to �. Let ℰ(�, �) denote the equivalence relation on � derived from equivalency of tuple’s X-values. We say that tuples �� , �� ∈ � are equivalent under ℰ(�, �) iff (�� , �� ) ∈ the tuples have equal X-values, i.e. ℰ(�, �) � �� ��� = �� ���. It should be noted that if � = � then �� ��� = �� ��� for each (�� , �� ) ∈ �, rendering all tuples in � equivalent under ℰ(�, �).
Different X-values of � correspond with X-values of tuples in �� (�) (projection on the attributes contained in �). Each tuple � ∈ �� (�) unambiguously identifies an equivalence class, i.e. fragment ℱ(�, �, �) = {� ∈ � | ���� = �}.
Aggregate f main of th function �� each � ∈ ℬ ��,� = {(� ℬ ∀(��� , �� , � �
Designated plied upon gate functio ple �. The o tuple relatio
� � {�� , �� ,
���, �, ��,�
��{��(�) | (��
Applying th ment, ℱ(�, tions ���, � � ∈ �� (�). ���, �, ��,� tional algeb
���, �, � �����(�) � ��
Given the re beforehand
bles accordmore aggreagment, and g fragments indicate not fferent, but fragment of tains. What d.
ng the schechema � = denoted by set of �. Let alue of �, i.e.
on on � deues. We say r ℰ(�, �) iff (�� , �� ) ∈ oted that if � ) ∈ �, ren, �).
X-values of ibutes conmbiguously fragment
� restricted to �. � tuple denote a tuple. Let ���� denote an X-value of �, i.e. tuple � restricted to �. Let ℰ(�, �) denote the equivalence relation on � derived equivalency of tuple’s relation X-values.onWe say Let ℰ(�,from �) denote the equivalence � dethat tuples � , � ∈ � are equivalent under ℰ(�, �) iff � � rived from equivalency of tuple’s X-values. We say Information Technology and Control (� ) the tuples have equal X-values, i.e. , � that tuples �� , �� ∈ � are equivalent under ℰ(�,��)�iff∈ ℰ(�,tuples �) � have �� ��� = �� ���.X-values, It should i.e. be noted (�� , that the equal �� ) ∈if ��� ��� (� ) � = � then � , � = � for each ∈ �, � = �� ���. � � ℰ(�, �) � �� ��� It should be �noted thatrenif all tuples under ℰ(�, �). ��� (� ) �dering = � then �� ���in=��equivalent , � for each ∈ �, ren� � � dering all tuples in � equivalent underwith ℰ(�, �). Different X-values of � correspond X-values of (�) tuples in � (projection on the attributes � Different X-values of � correspond with X-valuesconof (�)attributes tained in �). Each tuple � on ∈ ��the unambiguously tuples in �� (�) (projection conidentifies equivalence i.e. fragment (�) unambiguously tained in �).an Each tuple � ∈ ��class, ℱ(�, �, �) = � | ���� = �}.class, i.e. fragment identifies an{� ∈equivalence ℱ(�, �, �) = {� ∈equivalence � | ���� = �}. Consequently, relation ℰ(�, �) partitions relation � into the set of fragments ℱ(�, �) = Consequently, equivalence relation ℰ(�, �) partitions (�)}. {ℱ(�, the setℱ(�, � deter� ∈ �the � relation�, �) � |into set Because of fragments �) = mines strategythe of the {ℱ(�, �, the �) | fragmentation � ∈ �� (�)}. Because set�,�hereinafdeterter wethe willfragmentation refer to the set � as toofthe mines strategy thefragmentation �, hereinafset.we Inwill the refer specific case set � is ter to the setwhen � as fragmentation to the fragmentation (�) produces empty, a single-tuple zero-degree set. In the��specific case when fragmentation set � is relation, the effect that ℰ(�, �) partitions � into (�) produces empty, ��with a single-tuple zero-degree exactly one fragment which is equal to �. relation, with the effect that ℰ(�, �) partitions � into exactly one which is equal to �. Let �ℱ befragment the set of available aggregate functions, where an available aggregateaggregate function (e.g., count, Let �ℱ�� be denotes the set of functions, sum, max, min). Let ℬ be the set of arbitrary attribute where �� denotes an aggregate function (e.g., count, names , �� , …, toofthe constraint that sum, max,��min). Letsubjected ℬ be the set arbitrary attribute none of the attribute names appears in �. Relation names �� , �� , …, subjected to the constraint that (��,appears ��,�ofis the a setattribute of triplets �, �) which agnone names in �.relates Relation gregate functions from �ℱ, attributes from � � ��,� is a set of triplets (��, �, �) which relates ag-� and attribute names from ℬ in the following gregate functions from �ℱ, attributes from way: � � �if (��, �, �) ∈ � , then aggregate function �� ifis �,� and attribute names from ℬ in the following way: evaluated for attribute � and the result is named (��, �, �) ∈ ��,� , then aggregate function �� is�. Henceforth, will refer to the �,� as the evaluated for we attribute � and the relation result is� named �. aggregationwe set.will refer to the relation ��,� as the Henceforth, Aggregate function �� must be applicable to the doaggregation set. main of the attribute �. More than one aggregate function �� can be applied upon each attribute � and each � ∈ ℬ appears exactly in one triplet. Formally, ��,� = {(��, �, �) | (��, �, �) ∈ �ℱ × (� � �) × ℬ � �� �� ���������� �� ���(�)} ∀(��� , �� , �� ), ���� , �� , �� � ∈ ��,� � �� = �� � ��� = ��� � �� = ��
Designated aggregate functions from ��,� are applied upon fragment ℱ(�, �, �), the results of aggregate functions are renamed and concatenated to tuple �. The overall result of the operation is a singletuple relation ���, �, ��,� , �� with schema � � {�� , �� , … �� }, where � = �������,� �:
���, �, ��,� , �� = � � �����(�)
��{��(�) | (��, A, �)∈ ��,�} ℱ(�, �, �)�.
Applying the aggregate functions upon each fragment, ℱ(�, �, �) ∈ ℱ(�, �) would yield a set of relations ���, �, ��,� , ��, exactly one relation per each � ∈ �� (�). Union of these relations, denoted as ���, �, ��,� �, can be effectively evaluated with relational algebra grouping operator: ���, �, ��,� � = ⋃�∈��(�) ���, �, ��,� , �� = �����(�) � ��{��(�) | (��, A, �)∈ ��,�} ��.
���,� , …, �� �� },=where � = �������,� �: ����, � {��,� ,� � � �����(�) ���, �� �, ��,� , �� = � � �����(�) ℱ(�, �, �)�. {��(�) | (��, A, �)∈ ��,� }
�� �, �)�. {��(�) | (��,the A, �)∈ ��,� } ℱ(�,functions Applying aggregate upon each frag2018/1/47 ment, ℱ(�, �, �) ∈ ℱ(�, �) would yield set offragrelaApplying the aggregate functions upona each tions ���, �, � , ��, exactly one relation per each ment, ℱ(�, �, �)�,� ∈ ℱ(�, �) would yield a set of rela(�). � ∈ � Union of these relations, denoted � tions ���, �, ��,� , ��, exactly one relation per eachas ���, �, � �, can be evaluated with rela� ∈ �� (�).�,�Union of effectively these relations, denoted as tional algebra grouping operator: ���, �, ��,� �, can be effectively evaluated with relational algebra grouping operator: � = ⋃�∈� ���, �, ��,� , �� = ���, �, ��,� � (�) �����(�) ��.��,� , �� = � = |⋃ ���, �,�� {��(�) (��, A,��)∈ ��,� }�, �� (�) ���, �,� �∈� �Given � � ��. {��(�) | (��, A, �)∈ ��, ����(�) } the� relation schema relations �(�) and �(�), �,� beforehand determined sets � and � , one can easGiven the relation schema �, relations�,� �(�) and �(�), � and ���, �, � �. ily evaluate ���, �, � �,�sets � and ��,��,� beforehand determined , one can eas���,relation �, ��,�“exam” �. ily evaluate ���, �, � For instance, only consider in the �,� � andthe left part of the Figure1, and suppose that we want For instance, only consider the relation “exam” in theto compare with the identical-schema relation in anleft part ofitthe Figure1, and suppose that we want to other database. One possible fragmentation compare it with the identical-schema relation insetup ancoulddatabase. be: other One possible fragmentation setup could be: r(R)=exam(exam_date, student_id, course_id, r(R)=exam(exam_date, student_id, course_id, has_passed) has_passed) student_id, course_id, s(R)=exam(exam_date, s(R)=exam(exam_date, student_id, course_id, has_passed) has_passed) X={exam_date,student_id,course_id} X={exam_date,student_id,course_id} (���, ����������, ���������), (���,����������, ����������,���������), ���������), �. ��,� = �(���, (�����, ����������, ��������)�. ����������, ���������), ��,� = � (���, (�����, ��������) Tuples �� ∈ ���,����������, �, ��,� � and �� ∈ ���, �, ��,� �, ��� ��� where � = � = � contain the Tuples ��� ∈ ���,� �, ��,� � and �� ∈results ���, �,of�aggre�,� �, gate functions applied on fragments ℱ(�,of �,aggre�) and where �� ��� = �� ��� = � contain the results ℱ(�,functions �, �), respectively. The inequality of �, the�)tuples gate applied on fragments ℱ(�, and implies the difference between the corresponding ℱ(�, �, �), respectively. The inequality of the tuples �� ⇒ ℱ(�, �) ≠ ℱ(�, �, �), fragments, i.e. �� ≠ implies the difference between the�, corresponding fragments, i.e. �� ≠ �� ⇒ ℱ(�, �, �) ≠ ℱ(�, �, �), which leads to the conclusion that ���� �� ���� � �� � ���� �� ���� � �� � � � �.
Actually, any difference between ���� �� ���� � and ���� �� ���� � implies the inequality of � and �. Unfortunately, the inverse is not true, i.e. even when ���� �� ���� � = ���� �� ���� �, it is still possible that � and � are not equal. This happens in very rare cases when differences of attribute values cumulatively nullify each other during aggregate function evaluation [26]. Opportunely, already low probability of such an event can be further reduced to the acceptable level by applying larger set of aggregate functions. This is the reason why the equivaaltlence ���� �� ���� � = ���� �� ���� � � � = �, hough not strictly correct, will be considered as adequate for practical purpose of comparing fragments. As a side note, an interesting approach that would also almost guarantee the equivalence would be to use a single aggregate function that aggregates tuple hashes. Such an aggregate function should be commutative, because ordering tuples would incur additional costs. For instance, SQL Server provides CHECKSUM_AGG function (which, though undocumented, we suspect is a simple XOR function) that can be used to that purpose. Similar remarks apply
9
with the co main issue of the fragm to use emp exactly one superkeys ����(�) sin Taking int and presum pairs of rel we conclud tions shoul fragmentat ���� �� � �� inspection. group of tu procedure c of the proc with additi ber of fragm count. The mentation inspected o In order to following in
10
� ���� � �� �
���� � and nd �. Unforeven when sible that � y rare cases umulatively ion evaluaobability of he acceptae functions. equiva= �, altered as adefragments. that would would be to egates tuple ld be comincur addi-
and � are not equal. This happens in very rare cases � ����� � = fragmentation set �� . If ���� ��trade-off This differences is the of reason the equiva- Taking into account the aforementioned when attribute why values cumulatively ����presuming �� � ����� �,that then theapair can be small left out of further only relatively number of � = ����aggregate �� ���� � function � � = �,evaluaalt- and lence ���� ����during nullify each��other inspection. Otherwise, in order to determine the pairs of relations is expected to be actually different, hough notOpportunely, strictly correct, will below considered as adetion [26]. already probability of group of tuples incurring differences more precisely, we concluded that the process of comparing relaquate practical of comparing fragments. Information Technology and Control 2018/1/47 such anfor event can bepurpose further reduced to the acceptaprocedure be iteratively carried In each step shouldcan start with the empty orout. nearly empty As a side note, an interesting approach that would tions ble level by applying larger set of aggregate functions. of the procedure, fragmentation set is augmented also almost guarantee the equivalence be to fragmentation set �� . If ���� �� � ����� � = This is the reason why thewould equivawith attributes, increasing num���� ��additional � ����� �, then the pair thus can be left out ofthe further use a single aggregate function that aggregates tuple altlence ���� �� ���� � = ���� �� ���� � � � = �, ber of fragments and decreasing the fragment’s hashes. an correct, aggregate function should as be adecom- inspection. Otherwise, in order to determine tuple the hough notSuch strictly will be considered count. The process is repeated until maximal fragmutative, because ordering tuples would incur addigroup of tuples incurring differences more precisely, quate for practical purpose of comparing fragments. mentation set (with all intended attributes) has been tional instance, SQL Server procedure can be iteratively carried out. In each step As a sidecosts. note, For an interesting approach thatprovides would inspected or allotted time frame has expired. of the procedure, fragmentation set is augmented CHECKSUM_AGG (which, though also almost guaranteefunction the equivalence would undocbe to In order to carry out thethus described procedure, the additional attributes, increasing the numumented, suspectfunction is a simple XOR function) that with use a singlewe aggregate that aggregates tuple following information has to be defined (and stored ber of fragments and decreasing the fragment’s tuple can be Such used an to that purpose. Similar remarks apply hashes. aggregate function should be comin a metadata repository) for each of relations The process is repeated untilpair maximal fraghere as for the reference implementation – this is not count. mutative, because ordering tuples would incur addir(R) and s(R): mentation set (with all intended attributes) has been suitable for large tables because hashes tional costs. For instance, SQL calculating Server provides or allotted frame has expired. Nonempty list of time fragmentation sets, denoted as on the fly is costly, and storing and maintaining addi- 1.inspected CHECKSUM_AGG function (which, though undoc: ����� tional hash data is often not possible, especially umented, we suspect is a simple XOR function) thatat In order� to carry out the described procedure, the source data systems. 〈�� � �� � � � � following information has ������ = � 〉,to be defined (and stored can be used to that purpose. Similar remarks apply in a metadata repository) each pair of relations Theasreason the aggregate functions– are where �� � �� � � � �for here for thewhy reference implementation thisapplied is not � � �. r(R) and s(R): only upon in � � � is straightforward. Apsuitable for attributes large tables because calculating hashes �� can be an empty set. Only the last fragmentation Nonempty listis fragmentation sets, denoted plying upon attribute from list ofofallowed fragmentation denoted as a on the flyaggregate is costly,functions and storing andan maintaining addi-� 1. 1 Nonempty set in the list (but notsets, required) to be : ����� wouldhash be unproductive X-values of tuplesatin : ����� � tional data is oftenbecause not possible, especially � key or superkey of the relation �, because grouping corresponding fragments of � and � are identical by 〉, the relation is the identity source data systems. ����� =〈�〈� � , �� �, � 〉,of ����� ���,superkey by the key � �= �or � ��� �� definition, so are the results of aggregate functions. operator. sets should also fulfil the The reason why the aggregate functions are applied ��� where�����Fragmentation where � ��������� �����.�. constraint that none of antecedent fragmentation Theupon number of fragments inisℱ(�� �) depends onApthe only attributes in � � � straightforward. canbebe empty Only fragmenta����can anan empty set.set. Only thethe lastlast fragmentation sets functionally determines its descendants in the contents of thefunctions fragmentation setattribute �. Generally, inplying aggregate upon an from � tion the is allowed (butrequired) not required) set in set thein list is list allowed (but not to beto a , i.e. � � � � ∈ ����� � � � �� � � � . The latter ����� creasing the cardinality of �, increases cardinaliwould be unproductive because X-valuesthe of tuples in � � � � � � be or a superkey key or superkey of the �, relation because key of the relation because�,grouping in turn numberbyof ty of �� (�), which quite easy to If the tuples �� andis�� corresponding fragments of �increases and � arethe identical grouping byissuperkey the key or of relation byconstraint the key or ofsuperkey thejustify: relation is the identity � �), then �should pertain to the fragment ℱ(�� � �, hence decreasing the average tuples in ���� ��the ���� definition, so are results of aggregate functions. � � ��the �� = the identity operator. Fragmentation sets operator. Fragmentation sets should also fulfil �� �. �� � �� � � � , then � �� �= If � = � � � number of tuples per fragment. There is a trade-off in � � � � � � � � � � also fulfil that the constraint that none fragmentation of antecedent constraint none of antecedent The number of fragments in ℱ(�� �) depends on the selection of attributes for the fragmentation set �. � �� �, making � and � members of ℱ��� � � �� fragmentation sets determines its de-as sets determines its descendants in � functionally � � functionally � � the contents of the fragmentation set �. Generally, inUsing larger fragmentation set provides more precise well. As �fragmenting �� ∈�produce � scendants in� � � the � �����sets ���� ��and �� ,� . ����� The latter ����� creasing the cardinality of �, increases the cardinali��,� �i.e. � �� � , � the � , i.e. � ∈����� of inrelation’s subsetthe which is of the same fragments, either �� or is superfluous �� �� �set ��of .isThe constraint turn increases number tydetermination of �� (�), which constraint quitelatter easy to justify: Ifis� tuples ��easy and to �� �quite source differences, but simultaneously degrades �� ��� � = pertain the fragment �� � �), in �����to justify: �� and ��ℱ(�� pertain to then the fragment decreasing the average tuples in of ���� �� ���� �, hence �If. tuples the performance due to increased number of groups �� � �� �. ��� �.�If �� � �� � , ��, then � � � = � If � ℱ��, � � , then � � = � � number of tuples per fragment. There is a trade-off in 2. ��Nonempty � � aggregation � � � � � sets, � list� of � � � denoted �,��then � � =as for which aggregate functions have to be evaluated selection of attributes for the fragmentation set �. ��� =correspond �� ��� �, making ���� �and �� = �� ��� ��� �� �� ������� making and ���members of ℱ��� �� as , whose members to the mem� �� � �,� �� and their results compared. On the other hand, the Using larger fragmentation set provides more precise : bers of ����� well. As fragmenting sets � and � produce the members of ℱ��, � , �� as well. As fragmenting � � � � do not significontents of the aggregation set � determination of relation’s subset���which is the same set of� fragments, either ��� � or��� ���is sets����� �� and produce the same set fragments, 〉.ofsuperfluous =��〈� �� ���� � � ��� cantly affect the performance, because the cost of � source of differences, but simultaneously degrades ineither �������. � or �� is superfluous in ������ . aggregate function is negligible compared the performance dueevaluation to increased number of groups with the cost of grouping operation. Obviously, the 2. 2 Nonempty Nonempty list list ofof aggregation aggregation sets, sets, denoted denoted as for which aggregate functions have to be evaluated main issue is to appropriately determine the content , whose members correspond to ����� the mem����� � � , whose members correspond to the and their results compared. On the other hand, the of the fragmentation set. The two extreme cases are: : bers of ����� bers of ����� � �: contents of the aggregation set ���� do not signifito use empty fragmentation set, which will produce 〈����� � ����� � � � ����� 〉. ����� = � cantly affect the performance, because the cost of ������ = 〈� �,�� , ��,�� , � , ��,�� 〉. exactly one fragment, or, to use one of the keys or aggregate function evaluation is negligible compared superkeys for �, which will produce altogether Building on the previous example, these values ����(�) single-tuple fragments. could be: Taking into account the aforementioned trade-off ������ and presuming that only a relatively small number of {}, pairs of relations is expected to be actually different, {���������}, we concluded that the process of comparing rela=� � {���������, ����������}, tions should start with the empty or nearly empty {���������, ����������, ���������} fragmentation set �� . If ���� �� � ����� � = ���� �� � ����� �, then the pair can be left out of further ������ = 〈��,� , ��,� , ��,� , ��,� 〉. inspection. Otherwise, in order to determine the group of tuples incurring differences more precisely, procedure can be iteratively carried out. In each step of the procedure, fragmentation set is augmented with additional attributes, thus increasing the number of fragments and decreasing the fragment’s tuple count. The process is repeated until maximal fragmentation set (with all intended attributes) has been
Information Technology and Control
11
2018/1/47
3.2. Determining Inequality in the Content of Tables Having Different Schemas
with the dimension table dDate before fragmentation. Effectively, it is necessary to evaluate q (exam, {exam_date}) and q (fExam ⊳⊲ dDate, {date}) and then compare the contents of the two, having in mind that attribute exam_date corresponds to attribute date.
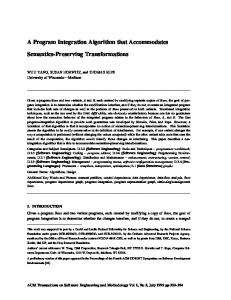
Comparing tables with different schemas typically occurs when comparing relational model tables and dimensional model [22] tables, e.g., staging area and In general, we compare an input set (any relation r DW. Dimension tables can be supported easier than in the source database or in the staging area) with an fact tables since they mostly take over attributes In general, we compare an input set output (any relation in the source database in the staging set (arset of relations in theor staging area or area) in with an outpu from relational source(s). Sometimes attributesarea in or in the DW). For given � and � , the relation � will be fragmented and sp set of relations in the staging In general, we compare an setFor (anygiven relation r in the�,� source database or in the theinput DW). X and the relation r will bestaging area) with the dimensional model are renamed different set ofusing relations the staging area inand the DW). given ��,� and � , the relation be fragmen � functions will evaluated accordance w aggregate functions will beinevaluated for theorfragments i.e.For ���, �, � fragmented specified aggregate will be�inwill �,�be nomenclature but different attribute names do not � will evaluated in acco aggregateinfunctions be thefragments ���, �, ��,� forfor the beexist. algorithm described Section will 3.1.evaluated Theevaluated problem here isfragments that the i.e. relation �(�) does notbe However, r present a problem since they are described and paired in Section In general, werelations compare input set (any relation r�inisthe source database or in theHs 3.1. probleman�.with here the relation �(�) does exist. equivalent toalgorithm �(�) can described be reconstructed from a set of The is setthat of relations the result of not the transform evaluated inThe accordance the algorithm described set of relations in the staging area or in the DW). Forarea) given � and ��,� , the relation � via metadata. Fact tables, on the other hand, are�(�) more In�,general, an input (any relation r in the source database or in�. the staging with an� output set apply (aor of equivalent to can set bein reconstructed from a problem set of relations The setthe of it is database the to result thi In general, we compare an input set (any relation rrelations inisthe source in th τ over i.e. �we = compare �(�). To compare input and3.1. output sets using our algorithm necessary Section The here is that relation ��� will be aggregate functions will be�,� evaluated for the fragments i.e. ���, �,set ��,� set of relations in thekeys staging area or inrelation the DW). For given � the and � ,orthe relation � will beFor fragmented and specified In general, we compare an input set (any r in the source database in the staging area) with an output (a complex in this regard, because business are -1 set of relations in staging area or in the DW). given � and � , the relatio τ over �, i.e. � =set, �(�). To that compare input and output sets using� equivalent our can algorithm it is �,� output such fornot each instance of the3.1. relation we state =necessary � �(�) ��(�)t transformation τ over s(R) does exist. However, tothat algorithm described in Section The problem here is that the �relation �relation will evaluated in accordance with the� will bd aggregate functions will area be evaluated for the fragments i.e. � ���, �, �relation set of relations in the staging or in the DW). For given � and , the � be will be fragmented and specified �,� �,� always replaced with surrogate keys from related aggregate functions will be evaluated for the fragments i.e. ���, �, �specified �,� over output set, such that for each instance of the relation � we can state that � =� transformation τ-1diexistence of such an inverse transformation is not questionable if we adhere to the limitations equivalent to �(�) can be reconstructed from a set of relations �. The set of relations s(R) be reconstructed aevaluated set problem of not relations . with algorithm described 3.1. The problem is���, that�,in the relation �(�) �from will3.1. be in exist. accordance the aggregate functions will in be Section evaluated for thecan fragments i.e. ��,� algorithmhere described Section Thedoes here However, is that therelation relation �(�) mension tables. In addition, some non-key attributes existence of such an inverse transformation is not questionable if we adhere to the limitations τ over �, i.e. � = �(�). To compare input and output sets using our algorithm introductory part of Section 3 (each record in a fact table corresponds to exactly one record in a data source equivalent to �(�) can be reconstructed from a set of relations �. The set of relations � is the result of the transformation The set ofhere relations isrelation the result of from the algorithm described in Section 3.1. The problem istothat �(�) does notatransformaexist. However,�.relation equivalent �(�)the can be reconstructed set of relations The set of relation can be cataloged and replaced with surrogate keys. over output set,algorithm such for each instance of therecord relation transformation τ-1identity introductory part Section 3a set (each record in fact table corresponds toof exactly in� awedac Note that, for schema, both � and � �� are the operators. τ over i.e. �can=be �(�). Toofcompare input and output sets using our itinput isand necessary to one apply inverse equivalent to�,identical �(�) reconstructed from of relations The set..of relations �that isinput the result theouttransformation τover over �, i.e. i.e. �. ��� =a�(�) To compare output sets using our algorithm tion τ r, = To compare and �� if we adhere to -1 for identical existence of such an inverse transformation is not questionable Note that, schema, both � and � are the identity operators. For instance, as shownIninthis Figure 1, table exam is the -1 over output set, such that for each instance of the relation � we can state that � = � ��(�)�. The transformation τ τ over �, i.e. �(Figure = �(�). 1), To the compare input and output setsisusing algorithm it is necessary to apply example inverse defined with the operation of relational algebra overour output set,issuch that for each instance ofinverse the relation � we transformation τ simply puttransformation sets using ourof algorithm it necessary to apply introductory part (each in fact corresponds to exactly o existence ofIn an inverse transformation is instance nottransformation questionable if3is we adhere tostate thea that limitations specified over output set, such that for each of Section the �transformation werecord can �table =questionable � �� ��(�)�. The transformation τ-1such In this example (Figure 1), the inverse simply defined the operation ofthe relation source table for the factτ�� table fExam. table fExam, existence of such an relation inverse not ifinwe adhere �� iswith -1 (fExam, dStudent, dDate, dCourse) = Note that, for identical schema, both � and � are the identity operators. inverse transformation τ over output set, such that introductory part of Section 3 (each record in a fact table corresponds to exactly one record in a data source table). �� existence of an inverse transformation is not questionable if we adhere the limitations specified in the to exactly introductory of Section 3 (eachtorecord in a fact table corresponds (fExam, dStudent, dDate,IndCourse) =part τ such attribute exam_date has been cataloged and replaced �����(���������,����������,���������,����������) example (Figure 1),schema, the inverse is simply defined Note that,part for of identical � and � �� are thefor identity operators. for each instance of the relation rtransformation can state that introductory Sectionschema, 3 (eachboth record in this aNote fact table corresponds to exactly record athe data source table).with the op that, identical bothone �we and � �� in are identity operators. �� � with the surrogate key (� dateID, while the actual exam ����(���������,����������,���������,����������) (fExam, dStudent, dDate, dCourse) τ�� –1 In this for example (Figure 1), the inverse is simply defined the = operation of relational algebra: NoteInthat, identical schema, both � and �τ are theexample identity operators. this (Figure 1), the inverse transformation is simply defined with the o r =transformation (τ(r)). The existence ofwith such an inverse trans����,����������,���������,��������� �� �=����(���������,����������,���������,����������) date has been renamed and stored in the dimension �� (� (fExam, dStudent, dDate, dCourse) τ In this example (Figure 1), the inverse transformation is simply defined with the operation of relational algebra: ����,����������,���������,��������� (fExam, dStudent, dDate, dCourse) = τ (fExam ⊳⊲ dStudent ⊳⊲ dDate ⊳⊲ dCourse)). formation is not questionable if we adhere to the (�����,����������,���������,��������� �����(���������,����������,���������,����������) table dDate as date. The so-called, “junk dimensions” dStudent, dDate, dCourse) = dDate τ�� (fExam, (fExam ⊳⊲ dStudent ⊳⊲ ⊳⊲dDate, dCourse)). �����(���������,����������,���������,����������) Performing transformation τ-1({fExam, dStudent, dCourse}) acquire relation �(�) limitations specified in dDate theweintroductory part ofwhich can be com (fExam ⊳⊲ dStudent, dStudent ⊳⊲ ⊳⊲ dCourse)). -1 � (� ����(���������,����������,���������,����������) are another example of to similar transformations. ����,����������,���������,��������� (� Performing transformation τ ({fExam, dDate, dCourse}) weisacquire relation �(�) which c ����,����������,���������,��������� the relation �(�) using algorithmSection described in Section 3.1. More precisely, it not necessary -1 3 (each record in a fact table corresponds to Performing transformation τ ({fExam, dStudent, dDate, dCourse}) to wereconstruct acquire rela (�����,����������,���������,��������� (fExamto⊳⊲ dStudent ⊳⊲ dDate ⊳⊲ dCourse)). (fExamdescribed ⊳⊲ dStudent ⊳⊲ dDate ⊳⊲ dCourse)). the relation �(�) using algorithm in Section 3.1. More precisely, it is not necessary to r it is sufficient to transformation reconstruct the having all attributes in Xtable). and in in ��,� . that, Commonly, the relatio -1 relation to the relation �(�) using algorithm described Section 3.1. More precisely, it isren To fragment and compare the⊳⊲ contents of tables exactly one record in acontained data source Note -1 Performing τ ({fExam, dStudent, dDate, dCourse}) we acquire relation �(�) which can be compared (fExam dStudent ⊳⊲ dDate ⊳⊲ dCourse)). Performing transformation τ ({fExam, dStudent, dDate, dCourse}) we acquire it is sufficient to reconstruct the relation having all attributes contained in X and in � . Commonly, -1 �,� it istoτsufficient to reconstruct the all contained in X and � will be incorporated into statement which toin not be relation evaluated. to the the �(�)The using algorithm described in Section 3.1. precisely, itan is–1SQL not to reconstruct �(�), exam and fExam basedwill upon fragmentation set for identical schema, both τrelation and τ having arenecessary the identiPerforming transformation τ-1transformation ({fExam, dStudent, dDate, dCourse}) we acquire relation �(�) which can be compared the relation using algorithm described inattributes Section 3.1. Moreserves precisely, itev -1 More will be incorporated into an SQL statement which sei will not be evaluated. The transformation τ�(�) will beto incorporated into an SQL will beattributes evaluated. The transformation τ-1�,� it fExam is sufficient toto reconstruct the relation having all contained in and in � . the Commonly, thecontained relation s(S) to�). the relation �(�) using algorithm described in 3.1. precisely, itrelation is not necessary reconstruct �(�), it not isSection sufficient toMore reconstruct theX having all attributes in X andsta in X={exam_date}, the fact�(�, table has be joined ty operators.In this example (Figure 1), inverse �). -1 �(�,will �). will an SQL statement serves to schemas, evaluate will not�(�, beto evaluated. The τall sufficient reconstruct the transformation relation having attributes containedThe ininto Xtransformation and in ��,� . Commonly, the relation s(S) willwhich be incorporated into an SQL not be be evaluated. τ-1having Theit is following example illustrates the procedure of incorporated fragmenting two data sets different sho The following example into illustrates thestatement procedure of fragmenting twodifferent data sets sch hav -1 The following example illustrates theincorporated procedure of fragmenting twowhich data sets having �(�, �). be an SQL serves to evaluate will �(�, not be evaluated. The transformation τ will Figure 1: �). Figure 1: Figure 1: The following example illustrates the procedure of fragmenting two data sets having different schemas, shown in �(�, �). The following example illustrates the procedure of fragmenting two data sets h Figure 1 �(�) = �(�) = fragmenting Figure 1: example Figure 1: The following illustrates the procedure of two data sets having different schemas, shown in �(�) = Comparing tables with different schemas (relational and dimensional) ����(���������, ����������, ���������, ����������) ����(���������, ����������, ���������, ����������) �(�) Figure 1: = �(�) = ����(���������, ����������, ���������, ����������) {���������, � =����(���������, ����������, ���������} {���������, ����(���������, ����������, ���������, ����������) � =�(�) ����������, ���������} = ����������, ���������, ����������) {���������, � = ����������, ���������} �(�) = ������(���������,����������,���������,��������� {���������, � = ����������, ���������} {���������, ����(���������, ����������, ���������, ����������) �= ����������, ���������} �(�) = ������(���������,����������,���������,����������) �(�) = ������(���������,����������,���������,����������) �(�) = �(� �(�) = ������(���������,����������,���������,������ � = {���������, ����������, ���������} ����,����������,���������,���������� �����(���������,����������,���������,����������) dStudent (�����,����������,���������,���������� dDate (����� (�����,����������,���������,���������� �(�) = ������(���������,����������,���������,����������) ⊳⊲ �������� ⊳⊲ ����� ⊳⊲ �������)) (�����,����������,���������,���������� (�����,����������,���������,���������� (����� ⊳⊲ �������� ⊳⊲ ����� ⊳⊲ �������)) studentId (�����,����������,���������,���������� (����� (����� ⊳⊲ �������� ⊳⊲ �����⊳⊲ ⊳⊲ ����� �������)) �������� ⊳⊲ �����dateId ⊳⊲ �������)) (����� ⊳⊲ �������� ⊳⊲⊳⊲ �������)) (����� ⊳⊲ �������� ⊳⊲student_id exam ����� ⊳⊲ �������)) date exam_date student_id course_id
… has_passed
? =
firstName lastName …
fExam 6
6 dateId
6
studentId courseId
… hasPassed
year
6 month … dCourse courseId course_id courseName
…
6
6
12
Information Technology and Control
transformation is simply defined with the operation of relational algebra: τ�� (fExam, dStudent, dDate, dCourse) = �����(���������,����������,���������,����������) (�����,����������,���������,���������
(fExam ⊳⊲ dStudent ⊳⊲ dDate ⊳⊲ dCourse)).
Performing transformation τ –1({fExam, dStudent, dDate, dCourse}) we acquire relation s(R) which can be compared to the relation r(R) using algorithm described in Section 3.1. More precisely, it is not necessary to reconstruct s(R), it is sufficient to reconstruct r in the source database or having in the staging area) with an output set (a the relation all attributes contained in X and in For given � and ��,� ,. the relation � will be fragmented and specified Commonly, the relation s(S) will not be evaluwill be evaluated in accordance with into the gments i.e. ���,ated. �, �The τ –1 will be incorporated �,� �transformation an SQL statement whichnot serves to However, evaluate q(s, X). m here is that the relation �(�) does exist. relation
2018/1/47
𝑟𝑟𝑟𝑟(𝑅𝑅𝑅𝑅) = 𝑎𝑎𝑎𝑎𝑒𝑒𝑒𝑒𝑎𝑎𝑎𝑎𝑎𝑎𝑎𝑎(𝑎𝑎𝑎𝑎𝑒𝑒𝑒𝑒𝑎𝑎𝑎𝑎𝑎𝑎𝑎𝑎_𝑑𝑑𝑑𝑑𝑎𝑎𝑎𝑎𝑎𝑎𝑎𝑎𝑎𝑎𝑎𝑎, 𝑠𝑠𝑠𝑠𝑡𝑡𝑡𝑡𝑠𝑠𝑠𝑠𝑑𝑑𝑑𝑑𝑑𝑑𝑑𝑑𝑑𝑑𝑑𝑑𝑑𝑑𝑑𝑑_𝑖𝑖𝑖𝑖𝑑𝑑𝑑𝑑 , 𝑎𝑎𝑎𝑎𝑎𝑎𝑎𝑎𝑎𝑎𝑎𝑎𝑎𝑎𝑎𝑎𝑎𝑎𝑎𝑎𝑎𝑎𝑎𝑎_𝑖𝑖𝑖𝑖𝑑𝑑𝑑𝑑 , ℎ𝑎𝑎𝑎𝑎𝑠𝑠𝑠𝑠_𝑎𝑎𝑎𝑎𝑎𝑎𝑎𝑎𝑎𝑎𝑎𝑎𝑎𝑎𝑎𝑎𝑎𝑎𝑎𝑎𝑎𝑎𝑎𝑎) 𝑋𝑋𝑋𝑋 = {𝑎𝑎𝑎𝑎𝑒𝑒𝑒𝑒𝑎𝑎𝑎𝑎𝑎𝑎𝑎𝑎_𝑑𝑑𝑑𝑑𝑎𝑎𝑎𝑎𝑎𝑎𝑎𝑎𝑎𝑎𝑎𝑎, 𝑠𝑠𝑠𝑠𝑡𝑡𝑡𝑡𝑠𝑠𝑠𝑠𝑑𝑑𝑑𝑑𝑑𝑑𝑑𝑑𝑑𝑑𝑑𝑑𝑑𝑑𝑑𝑑_𝑖𝑖𝑖𝑖𝑑𝑑𝑑𝑑 , 𝑎𝑎𝑎𝑎𝑎𝑎𝑎𝑎𝑎𝑎𝑎𝑎𝑎𝑎𝑎𝑎𝑎𝑎𝑎𝑎𝑎𝑎𝑎𝑎_𝑖𝑖𝑖𝑖𝑑𝑑𝑑𝑑 } 𝑠𝑠𝑠𝑠(𝑅𝑅𝑅𝑅) = 𝜌𝜌𝜌𝜌𝑒𝑒𝑒𝑒𝑒𝑒𝑒𝑒𝑒𝑒𝑒𝑒𝑚𝑚𝑚𝑚2(𝑒𝑒𝑒𝑒𝑒𝑒𝑒𝑒𝑒𝑒𝑒𝑒𝑚𝑚𝑚𝑚_𝑑𝑑𝑑𝑑𝑒𝑒𝑒𝑒𝑑𝑑𝑑𝑑𝑒𝑒𝑒𝑒,𝑠𝑠𝑠𝑠𝑑𝑑𝑑𝑑𝑠𝑠𝑠𝑠𝑑𝑑𝑑𝑑𝑑𝑑𝑑𝑑𝑑𝑑𝑑𝑑𝑑𝑑𝑑𝑑_𝑖𝑖𝑖𝑖𝑑𝑑𝑑𝑑,𝑐𝑐𝑐𝑐𝑐𝑐𝑐𝑐𝑠𝑠𝑠𝑠𝑠𝑠𝑠𝑠𝑠𝑠𝑠𝑠𝑠𝑠𝑠𝑠_𝑖𝑖𝑖𝑖𝑑𝑑𝑑𝑑,ℎ𝑒𝑒𝑒𝑒𝑒𝑒𝑒𝑒_𝑝𝑝𝑝𝑝𝑒𝑒𝑒𝑒𝑒𝑒𝑒𝑒𝑒𝑒𝑒𝑒𝑒𝑒𝑒𝑒𝑒𝑒𝑒𝑒) (𝜋𝜋𝜋𝜋𝑑𝑑𝑑𝑑𝑒𝑒𝑒𝑒𝑑𝑑𝑑𝑑𝑒𝑒𝑒𝑒,𝑠𝑠𝑠𝑠𝑑𝑑𝑑𝑑𝑠𝑠𝑠𝑠𝑑𝑑𝑑𝑑𝑑𝑑𝑑𝑑𝑑𝑑𝑑𝑑𝑑𝑑𝑑𝑑_𝑖𝑖𝑖𝑖𝑑𝑑𝑑𝑑,𝑐𝑐𝑐𝑐𝑐𝑐𝑐𝑐𝑠𝑠𝑠𝑠𝑠𝑠𝑠𝑠𝑠𝑠𝑠𝑠𝑠𝑠𝑠𝑠_𝑖𝑖𝑖𝑖𝑑𝑑𝑑𝑑,ℎ𝑒𝑒𝑒𝑒𝑒𝑒𝑒𝑒_𝑝𝑝𝑝𝑝𝑒𝑒𝑒𝑒𝑒𝑒𝑒𝑒𝑒𝑒𝑒𝑒𝑒𝑒𝑒𝑒𝑒𝑒𝑒𝑒 (𝑓𝑓𝑓𝑓𝑓𝑓𝑓𝑓𝑒𝑒𝑒𝑒𝑒𝑒𝑒𝑒𝑒𝑒𝑒𝑒 ⊳⊲ 𝑑𝑑𝑑𝑑𝑑𝑑𝑑𝑑𝑡𝑡𝑡𝑡𝑡𝑡𝑡𝑡𝑑𝑑𝑑𝑑𝑎𝑎𝑎𝑎𝑎𝑎𝑎𝑎𝑎𝑎𝑎𝑎 ⊳⊲ 𝑑𝑑𝑑𝑑𝑑𝑑𝑑𝑑𝑎𝑎𝑎𝑎𝑎𝑎𝑎𝑎𝑎𝑎𝑎𝑎 ⊳⊲ 𝑑𝑑𝑑𝑑𝑟𝑟𝑟𝑟𝑑𝑑𝑑𝑑𝑠𝑠𝑠𝑠𝑠𝑠𝑠𝑠𝑠𝑠𝑠𝑠𝑠𝑠𝑠𝑠)) (𝑠𝑠𝑠𝑠𝑠𝑠𝑠𝑠𝑑𝑑𝑑𝑑, ℎ𝑎𝑎𝑎𝑎𝑠𝑠𝑠𝑠_𝑎𝑎𝑎𝑎𝑎𝑎𝑎𝑎𝑎𝑎𝑎𝑎𝑎𝑎𝑎𝑎𝑎𝑎𝑎𝑎𝑎𝑎𝑎𝑎, 𝑠𝑠𝑠𝑠𝑠𝑠𝑠𝑠𝑑𝑑𝑑𝑑𝑠𝑠𝑠𝑠𝑎𝑎𝑎𝑎𝑠𝑠𝑠𝑠𝑠𝑠𝑠𝑠𝑎𝑎𝑎𝑎𝑎𝑎𝑎𝑎), 𝒜𝒜𝒜𝒜𝑅𝑅𝑅𝑅,𝑋𝑋𝑋𝑋 = � (𝑎𝑎𝑎𝑎𝑣𝑣𝑣𝑣𝑎𝑎𝑎𝑎, ℎ𝑎𝑎𝑎𝑎𝑠𝑠𝑠𝑠_𝑎𝑎𝑎𝑎𝑎𝑎𝑎𝑎𝑎𝑎𝑎𝑎𝑎𝑎𝑎𝑎𝑎𝑎𝑎𝑎𝑎𝑎𝑎𝑎, 𝑎𝑎𝑎𝑎𝑣𝑣𝑣𝑣𝑎𝑎𝑎𝑎𝑠𝑠𝑠𝑠𝑎𝑎𝑎𝑎𝑠𝑠𝑠𝑠𝑠𝑠𝑠𝑠𝑎𝑎𝑎𝑎𝑑𝑑𝑑𝑑), � (𝑎𝑎𝑎𝑎𝑎𝑎𝑎𝑎𝑎𝑎𝑎𝑎𝑎𝑎𝑎𝑎𝑎𝑎𝑎𝑎, ℎ𝑎𝑎𝑎𝑎𝑠𝑠𝑠𝑠_𝑎𝑎𝑎𝑎𝑎𝑎𝑎𝑎𝑎𝑎𝑎𝑎𝑎𝑎𝑎𝑎𝑎𝑎𝑎𝑎𝑎𝑎𝑎𝑎, 𝑟𝑟𝑟𝑟𝑎𝑎𝑎𝑎𝑎𝑎𝑎𝑎𝑟𝑟𝑟𝑟𝑑𝑑𝑑𝑑𝑑𝑑𝑑𝑑𝑑𝑑𝑑𝑑𝑑𝑑𝑑𝑑) {}, {𝑎𝑎𝑎𝑎𝑎𝑎𝑎𝑎𝑎𝑎𝑎𝑎𝑎𝑎𝑎𝑎𝑎𝑎𝑎𝑎𝑎𝑎𝑎𝑎_𝑖𝑖𝑖𝑖𝑑𝑑𝑑𝑑 }, 𝑎𝑎𝑎𝑎𝑎𝑎𝑎𝑎𝑎𝑎𝑎𝑎𝑎𝑎𝑎𝑎𝑎𝑎𝑎𝑎𝑅𝑅𝑅𝑅 = � {𝑎𝑎𝑎𝑎𝑎𝑎𝑎𝑎𝑎𝑎𝑎𝑎𝑎𝑎𝑎𝑎𝑎𝑎𝑎𝑎𝑎𝑎𝑎𝑎_𝑖𝑖𝑖𝑖𝑑𝑑𝑑𝑑 , 𝑠𝑠𝑠𝑠𝑡𝑡𝑡𝑡𝑠𝑠𝑠𝑠𝑑𝑑𝑑𝑑𝑑𝑑𝑑𝑑𝑑𝑑𝑑𝑑𝑑𝑑𝑑𝑑_𝑖𝑖𝑖𝑖𝑑𝑑𝑑𝑑 }, {𝑎𝑎𝑎𝑎𝑎𝑎𝑎𝑎𝑎𝑎𝑎𝑎𝑎𝑎𝑎𝑎𝑎𝑎𝑎𝑎𝑎𝑎𝑎𝑎_𝑖𝑖𝑖𝑖𝑑𝑑𝑑𝑑 , 𝑠𝑠𝑠𝑠𝑡𝑡𝑡𝑡𝑠𝑠𝑠𝑠𝑑𝑑𝑑𝑑𝑑𝑑𝑑𝑑𝑑𝑑𝑑𝑑𝑑𝑑𝑑𝑑_𝑖𝑖𝑖𝑖𝑑𝑑𝑑𝑑 , 𝑎𝑎𝑎𝑎𝑒𝑒𝑒𝑒𝑎𝑎𝑎𝑎𝑎𝑎𝑎𝑎_𝑑𝑑𝑑𝑑𝑎𝑎𝑎𝑎𝑎𝑎𝑎𝑎𝑎𝑎𝑎𝑎} 𝑎𝑎𝑎𝑎𝑎𝑎𝑎𝑎𝑎𝑎𝑎𝑎𝑎𝑎𝑎𝑎𝑎𝑎𝑎𝑎𝑅𝑅𝑅𝑅 = 〈𝒜𝒜𝒜𝒜𝑅𝑅𝑅𝑅,𝑋𝑋𝑋𝑋 , 𝒜𝒜𝒜𝒜𝑅𝑅𝑅𝑅,𝑋𝑋𝑋𝑋 , 𝒜𝒜𝒜𝒜𝑅𝑅𝑅𝑅,𝑋𝑋𝑋𝑋 , 𝒜𝒜𝒜𝒜𝑅𝑅𝑅𝑅,𝑋𝑋𝑋𝑋 〉.
�
6
The algorithm produces the SQL statements shown in Table 2.
of relations �. The of relations � is theillustrates result of the transformation Theset following example the procedure of output sets using our algorithm it is necessary to apply inverse fragmenting two data sets having different sche- As it can be seen, the relation s(S) is not evaluated, we –1 �� ach instance of mas, the relation can state that � = � ��(�)�. The just used transformation τ when we needed it. shown �inwe Figure 1: not questionable if we adhere to the limitations specified in the Table 2 to exactly one record in a data source table). act table corresponds Steps in fragmenting and comparing tables having different schemas e the identity operators. ation is simply defined with the operation of relational algebra: Depth Source (RDB) Destination (DWH) 1
SELECT SUM(has_passed) AS sumPassed, AVG(has_passed) AS avgPassed, COUNT(has_passed) AS recCount FROM exam
)). SELECTrelation course_id, 2 we acquire dDate, dCourse}) �(�) which can be compared AS sumPassed, Section 3.1. More precisely, it isSUM(has_passed) not necessary to reconstruct �(�), AVG(has_passed) AS avgPassed, ll attributes contained in X and inCOUNT(has_passed) ��,� . Commonly,ASthe relation s(S) recCount FROM exam ll be incorporated into an SQL statement which serves to evaluate GROUP BY course_id
of fragmenting two data sets having different schemas, shown in
SELECT SUM(hasPassed) AS sumPassed, AVG(hasPassed) AS avgPassed, COUNT(hasPassed) AS recCount FROM fExam SELECT dCourse.course_id, SUM(hasPassed) AS sumPassed, AVG(hasPassed) AS avgPassed, COUNT(hasPassed) AS recCount FROM fExam JOIN dCourse ON fExam.courseId = dCourse.courseId GROUP BY dCourse.course_id
Let’s suppose we’ve found mismatch for the course_id=101 in the previous step:
SELECT course_id, 3 �������) student_id, SUM(has_passed) AS sumPassed, AVG(has_passed) AS avgPassed, �������,����������,���������,����������) COUNT(has_passed) AS recCount FROM exam WHERE course_id = 101 �)) GROUP BY course_id, student_id
6
SELECT dCourse.course_id, dStudent.student_id, SUM(hasPassed) AS sumPassed, AVG(hasPassed) AS avgPassed, COUNT(hasPassed) AS recCount FROM fExam JOIN dCourse ON fExam.courseId = dCourse.courseId JOIN dStudent ON fExam.studentId=dStudent.studentId WHERE course_id = 101 GROUP BY dCourse.course_id, dStudent.student_id
Information Technology and Control
Depth
Source (RDB)
2018/1/47
13
Destination (DWH)
Let’s suppose we’ve found mismatch for the student_id=36 and student_id=37 in the previous step:
4
SELECT course_id, student_id, exam_date, SUM(has_passed) AVG(has_passed) COUNT(has_passed) FROM exam WHERE (course_id = 101 OR (course_id = 101 GROUP BY course_id, student_id, exam_date
AS sumPassed, AS avgPassed, AS recCount AND student_id = 36) AND student_id = 37)
SELECT dCourse.course_id, dStudent.student_id, dDate.date AS exam_date, SUM(hasPassed) AS sumPassed, AVG(hasPassed) AS avgPassed, COUNT(hasPassed) AS recCount FROM fExam JOIN dStudent ON fExam.studentId=dStudent.studentId JOIN dDate ON fExam.dateId = dDate.dateId JOIN dCourse ON fExam.courseId = dCourse.courseId WHERE (course_id = 101 AND student_id = 36) OR (course_id = 101 AND student_id = 37) GROUP BY dCourse.course_id, dStudent.student_id, dDate.date,
Finally, after result sets from the previous steps are compared,3.3. theThe algorithm produces the following results: Overall TCFCe.g., Algorithm
3.3. The Overall TCFC Algorithm
3.3. The Overall TCFC Algorithm Missing: (101, 36, ‘2013-01-01’)
Missing: (101,two 37,sections, ‘2012-02-02’) In the previous we have formally described the algorithm at tab
In the previous(101, two sections, we have formally described the algorithm atoftable level. Using described algorithm, Excess: 37,two ‘2012-02-02’) Excess: (101, 36, ‘2013-01-01’) with help metadata, weUsing canthe now introduce a global, time-constrai In the previous sections, we have formally described thethe algorithm at table level. the described algorithm, with the help of metadata, we can now introduce a global, time-constrained algorithm for providing a “global of the differences betweenfor twoproviding sets of tables. with the help of metadata, we can now introduce aoverview” global, time-constrained algorithm a “global overview” of the differences between two sets tables. The metadata needed for comparing an input set (relation 𝑟𝑟𝑟𝑟(𝑅𝑅𝑅𝑅)) with an ou overview” of the differences between twoofsets of tables. � In general, a fact table schema does not have to conconstruct relation s(R),set thus harmonizing theisschema The Overall TCFC Algorithm The metadata needed for comparing an input set 𝑟𝑟𝑟𝑟(𝑅𝑅𝑅𝑅)) with an output (set asSince the transf (𝑟𝑟𝑟𝑟(𝑅𝑅𝑅𝑅), 𝑎𝑎𝑎𝑎𝕤𝕤𝕤𝕤)𝑎𝑎𝑎𝑎𝑎𝑎𝑎𝑎is𝑅𝑅𝑅𝑅 denoted ,denoted 𝑎𝑎𝑎𝑎𝑎𝑎𝑎𝑎𝑎𝑎𝑎𝑎𝑎𝑎𝑎𝑎𝑎𝑎𝑎𝑎𝑅𝑅𝑅𝑅 ).as the metadata quintuple 𝒞𝒞𝒞𝒞 = 𝕤𝕤𝕤𝕤, 𝜏𝜏𝜏𝜏 −1 , 𝑎𝑎𝑎𝑎𝑎𝑎𝑎𝑎𝕤𝕤𝕤𝕤) The metadata needed for comparing an input(relation set (relation 𝑟𝑟𝑟𝑟(𝑅𝑅𝑅𝑅)) with an output set (setofofrelations relations −1 tain business keys (primary keys) of the originating of the two data sets prior to comparison. The relations } −1 ). (𝑟𝑟𝑟𝑟(𝑅𝑅𝑅𝑅), Since the transformation 𝜏𝜏𝜏𝜏 is the transformation that has , 𝑎𝑎𝑎𝑎 𝑎𝑎𝑎𝑎 𝑎𝑎𝑎𝑎 𝑎𝑎𝑎𝑎𝑎𝑎𝑎𝑎 , 𝑎𝑎𝑎𝑎 𝑎𝑎𝑎𝑎 𝑎𝑎𝑎𝑎 𝑎𝑎𝑎𝑎𝑎𝑎𝑎𝑎 the metadata quintuple 𝒞𝒞𝒞𝒞 = 𝕤𝕤𝕤𝕤, 𝜏𝜏𝜏𝜏 been applied to relation 𝑟𝑟𝑟𝑟 to produce a set of relations 𝕤𝕤𝕤𝕤, 𝜏𝜏𝜏𝜏 −1 will reconst ). (𝑟𝑟𝑟𝑟(𝑅𝑅𝑅𝑅), 𝑅𝑅𝑅𝑅 𝑅𝑅𝑅𝑅 Since the transformation 𝜏𝜏𝜏𝜏 is the transformation that has , 𝑎𝑎𝑎𝑎 𝑎𝑎𝑎𝑎 𝑎𝑎𝑎𝑎 𝑎𝑎𝑎𝑎𝑎𝑎𝑎𝑎 , 𝑎𝑎𝑎𝑎 𝑎𝑎𝑎𝑎 𝑎𝑎𝑎𝑎 𝑎𝑎𝑎𝑎𝑎𝑎𝑎𝑎 the metadata quintuple 𝒞𝒞𝒞𝒞 = 𝕤𝕤𝕤𝕤, 𝜏𝜏𝜏𝜏 he previous two sections, we have formally described the algorithm at table 𝑅𝑅𝑅𝑅level. Using the described algorithm, 𝑅𝑅𝑅𝑅 −1 −1 table [26]. It is possible that the business key is comare then iteratively fragmented, aggregated and comreconstruct s(R), the applied relation 𝑟𝑟𝑟𝑟 atoglobal, produce a set of relations 𝕤𝕤𝕤𝕤,schema 𝜏𝜏𝜏𝜏 𝕤𝕤𝕤𝕤, 𝜏𝜏𝜏𝜏will of theproviding two datarelation prior tothus comparison. The relations are then will reconstruct relation s(R), thusharmonizing harmonizing the been applied to relation 𝑟𝑟𝑟𝑟 to produce a set of relations the help of metadata,been we can nowto introduce time-constrained algorithm for asets “global prisedschema of dimension tables’ business however, pared according tothen the fragmentation sets from of the sets two data sets prior to comparison. The relations are then iteratively fragmented, and and aggregate sets compared according toiteratively the fragmentation setsaggregated from 𝑎𝑎𝑎𝑎𝑎𝑎𝑎𝑎𝑎𝑎𝑎𝑎𝑎𝑎𝑎𝑎𝑎𝑎𝑎𝑎𝑅𝑅𝑅𝑅and schema of the two data setskeys; prior to comparison. The relations are fragmented, aggregated wn in Table view” of the2.differences between two of tables. all quintuples needed for. With adenote pair ofa databases. and aggregate from 𝑎𝑎𝑎𝑎𝑎𝑎𝑎𝑎𝑎𝑎𝑎𝑎𝑎𝑎𝑎𝑎 .comparing With𝒞𝒞𝒞𝒞𝒞𝒞𝒞𝒞we we set to the so, fragmentation sets from 𝑎𝑎𝑎𝑎𝑅𝑅𝑅𝑅𝑎𝑎𝑎𝑎𝑎𝑎𝑎𝑎and 𝑎𝑎𝑎𝑎𝑎𝑎𝑎𝑎aggregate aggregate setssets from 𝑎𝑎𝑎𝑎𝑎𝑎𝑎𝑎𝑎𝑎𝑎𝑎𝑎𝑎𝑎𝑎𝑎𝑎𝑎𝑎𝑎𝑎𝑎𝑎 set of according to theWhen fragmentation sets from 𝑎𝑎𝑎𝑎𝑎𝑎𝑎𝑎𝑎𝑎𝑎𝑎𝑎𝑎𝑎𝑎𝑎𝑎𝑎𝑎 that iscompared not always the case. positively and sets from With wedenote denote a of 𝑅𝑅𝑅𝑅metadata d, we just needed used transformation τ-1compared when weaccording needed it. metadata for comparing an input set (relation 𝑟𝑟𝑟𝑟(𝑅𝑅𝑅𝑅))to with an output set (set of relations 𝕤𝕤𝕤𝕤) is denoted𝑅𝑅𝑅𝑅 𝑅𝑅𝑅𝑅as all metadata quintuples needed for comparing a pair of databases. A comparison of two data sets, according to a metadata quintuple 𝒞𝒞𝒞𝒞, is an it all metadata quintuples needed for comparing a pair of databases. identify the tuples, we employ the data lineage mechset of all metadata quintuples needed for comparing contain business keys (primary of, the originating table [26]. (𝑟𝑟𝑟𝑟(𝑅𝑅𝑅𝑅), keys) Since theIttransformation 𝜏𝜏𝜏𝜏quintuple is the transformation that has that 𝑎𝑎𝑎𝑎𝑎𝑎𝑎𝑎𝑎𝑎𝑎𝑎𝑎𝑎𝑎𝑎𝑎𝑎𝑎𝑎 , 𝑎𝑎𝑎𝑎two 𝑎𝑎𝑎𝑎𝑎𝑎𝑎𝑎𝑎𝑎𝑎𝑎𝑎𝑎𝑎𝑎 metadata quintuple 𝒞𝒞𝒞𝒞 = 𝕤𝕤𝕤𝕤, 𝜏𝜏𝜏𝜏 −1 𝑅𝑅𝑅𝑅of 𝑅𝑅𝑅𝑅 ).sets, A comparison data according to a metadata 𝒞𝒞𝒞𝒞, is an iterative process can be illustrated by an unbalanced tree where each node represents a fragment based on the ag A comparison of two data sets, according to a metadata quintuple 𝒞𝒞𝒞𝒞, is an iterative process that can be illustrated by −1 anism inset [26]. In every fact table has arelation pair of s(R), databases. tables’ business keys; however, that isshort, not always the case. will thus harmonizing the ndimension applied to relation 𝑟𝑟𝑟𝑟 todescribed produce of relations 𝕤𝕤𝕤𝕤, 𝜏𝜏𝜏𝜏each an aunbalanced tree each where nodereconstruct represents a fragment based on the aggregation set andthe thefragmentation fragmentation set defined for that level (Figure 2). This means that comparing 𝑟𝑟𝑟𝑟 and 𝑠𝑠𝑠𝑠 accord an unbalanced tree where node represents a fragment based on the aggregation set and set mploy the data lineage mechanism described in [26]. In short, every a coupled lineage table linF with relation schema: A comparison two sets, according a metama of the two data sets prior to comparison. The relations are then that iteratively and represented with the defined for that level (Figure This means comparing 𝑟𝑟𝑟𝑟the and 𝑠𝑠𝑠𝑠ofaccording to root𝑟𝑟𝑟𝑟 fragmented, of tree. Ifaggregated thedata roottolevel results 1 and A1Aat1isisthe represented with thewith difference defined for that, level 2).where This2).means that comparing and 𝑠𝑠𝑠𝑠 according tocomparison 𝑋𝑋𝑋𝑋1𝑋𝑋𝑋𝑋and {𝑑𝑑𝑑𝑑𝑆𝑆𝑆𝑆𝐹𝐹𝐹𝐹 , 𝑠𝑠𝑠𝑠𝑠𝑠𝑠𝑠 where 𝑑𝑑𝑑𝑑𝑆𝑆𝑆𝑆 𝑠𝑠𝑠𝑠𝑠𝑠𝑠𝑠from , …(Figure , 𝑠𝑠𝑠𝑠𝑠𝑠𝑠𝑠 is the relation schema: to 𝐿𝐿𝐿𝐿𝑖𝑖𝑖𝑖𝑖𝑖𝑖𝑖𝐿𝐿𝐿𝐿 SK is the 1, … 𝑖𝑖𝑖𝑖tree. 𝑚𝑚𝑚𝑚 },comparison 𝐹𝐹𝐹𝐹at , 𝐿𝐿𝐿𝐿 ,…, 𝐿𝐿𝐿𝐿 , further root ofsets the If𝑎𝑎𝑎𝑎𝑎𝑎𝑎𝑎the root level results with differences in fragments 𝐿𝐿𝐿𝐿 and aggregate sets from 𝑎𝑎𝑎𝑎 𝑎𝑎𝑎𝑎 𝑎𝑎𝑎𝑎 𝑎𝑎𝑎𝑎𝑎𝑎𝑎𝑎 . With 𝒞𝒞𝒞𝒞 we denote a set of pared according the = fragmentation 𝑎𝑎𝑎𝑎 𝑎𝑎𝑎𝑎𝑎𝑎𝑎𝑎 F data quintuple , is an iterative process that can be ilout according to 𝑋𝑋𝑋𝑋2 and comparison of fragments 𝐿𝐿𝐿𝐿1 , 𝐿𝐿𝐿𝐿2 ,…, 𝐿𝐿𝐿𝐿𝐿𝐿𝐿𝐿 1 2be carried 𝑛𝑛𝑛𝑛 the 𝑅𝑅𝑅𝑅 𝑅𝑅𝑅𝑅 differences 𝑛𝑛𝑛𝑛 will , 𝐿𝐿𝐿𝐿 ,…, 𝐿𝐿𝐿𝐿 , the further root of the tree. If the comparison at the root level results with in fragments 1 2 the root’s 𝑛𝑛𝑛𝑛 the business keysurrogate attributes of the originating table. linF ,is 𝐿𝐿𝐿𝐿2simply ,…, will be carried out 𝑋𝑋𝑋𝑋2 and 𝐴𝐴𝐴𝐴2 andtree willwhere produce comparison ofpair fragments 𝐿𝐿𝐿𝐿i1are key of the fact atable and PK the𝐿𝐿𝐿𝐿𝑛𝑛𝑛𝑛business metadata quintuples needed for comparing databases. etc.according lustrated by antounbalanced each nodechildren, repcomparison of fragments 𝐿𝐿𝐿𝐿of 1 , 𝐿𝐿𝐿𝐿2 ,…, 𝐿𝐿𝐿𝐿𝑛𝑛𝑛𝑛 will be carried out according to 𝑋𝑋𝑋𝑋2 and 𝐴𝐴𝐴𝐴2 and will produce the root’s children, . etc. of the originating table. linF is simply In accordance with a request to examine as many tables as possible, perhaps a omparison of twokey dataattributes sets, according to a metadata quintuple 𝒞𝒞𝒞𝒞, is an iterative process that can be illustrated by resents a fragment based on the aggregation set and etc. In accordance with a request to examine as many tablesresult, as possible, perhaps should at the expense ofthe thecomparison completeness of the at the first le –1 the algorithm perform operations incorporated into τ transformation when needed. ving differenttree schemas nbalanced where each node represents a fragment based on the aggregation set and the fragmentation set fragmentation set for that level (Figure In accordance a requestshould to examine as the many tables the as operations possible, perhaps at thedefined expense of the completeness of(and the result,with the algorithm perform comparison atcomparison the first level tables, then all second assigned necessary) of for the all fragments on the level and so on. andat Athe represented the ned for that level (Figure 2). This means that comparing 𝑟𝑟𝑟𝑟fragments andcomparison 𝑠𝑠𝑠𝑠 according to 1 isfirst 1level 2).𝑋𝑋𝑋𝑋This means that comparing r andthen s according to X(and result, thenecessary) algorithm should perform the operations level for with all tables, all assigned Destination (DWH) comparison of the on the second and so on. 1 This can be ensured by traversing tree according to the breadth-first 3.3. The Overall TCFC Algorithm , the the further of the tree. IfSELECT the comparison at thecan root level results with on differences inlevel fragments 𝐿𝐿𝐿𝐿1 , 𝐿𝐿𝐿𝐿2 ,…, 𝐿𝐿𝐿𝐿𝑛𝑛𝑛𝑛order, necessary) comparison of the fragments the and on. and issorepresented with root thestraightforwardly tree. If the ed, SUM(hasPassed) AS be sumPassed, This ensured by traversing treesecond according toA breadth-first which canofbe 1the implemented using a queue. , previous 𝐿𝐿𝐿𝐿2 ,…,can 𝐿𝐿𝐿𝐿𝑛𝑛𝑛𝑛implemented will beAS carried according to 𝑋𝑋𝑋𝑋 and willbreadth-first produce the order, root’s children, parison of fragments 𝐿𝐿𝐿𝐿1This ed, AVG(hasPassed) avgPassed, using atraversing queue. 2 and betwo ensured by out tree according the which can be straightforwardly In the sections, we have formally de-𝐴𝐴𝐴𝐴2 to comparison atofthe root with Comparison two datalevel sets results (databases) is differences comprised of a number of in t COUNT(hasPassed) AS a recCount Comparison of two data sets (databases) is comprised of a number of individual table comparisons. table algorithm (Alg implemented using queue. scribed the algorithm at table level. Using the dein fragments F , F ..., F , the further comparison of comparison is a job to be performed. The idea of Each the TCFC 1 2, n FROM fExam comparison is a job to be performed. The idea of the TCFC algorithm (Algorithm 1) is to put all jobs in a priority ccordance with a request to examine as many tables as possible, perhaps at the expense of the completeness of the Comparison of two data sets (databases) is comprised of a number of individual table comparisons. Each table scribed algorithm, with the help of metadata, we can fragments (sorted) queue, and execute them one byout oneaccording until the time runs out (lines 5 t F1, F(lines will be carried to SELECT dCourse.course_id, 2, ..., F (sorted) queue, and execute them one by one until the time runs out 5nassigned to 7), 1) or all jobs getall executed (line 29). lt, the algorithm should perform the comparison operations at the first level for all tables, then all (and comparison is a job to be performed. The idea of the TCFC algorithm (Algorithm is to put jobs in a priority ed, AS sumPassed, nowSUM(hasPassed) introduce a global, time-constrained algorithm X2 and A2 and will produce the root’s children, etc. ssary) comparison ofproviding the fragments onand theoverview” second them level and sodifferences on. until the time runs outAlgorithm (sorted) queue, execute one one (lines 5 to1:7), orTime-Constrained all jobs get executed (line 29). ed, AVG(hasPassed) AS avgPassed, Fragment and Compare (TCFC for a “global ofTime-Constrained theby Algorithm 1:to the Fragment and Compare (TCFC) In which accordance with a request to examine as many taThe Overall TCFC Algorithm t can COUNT(hasPassed) AS recCount be relation ensured traversing tree according breadth-first order, can be straightforwardly Input : 𝒞𝒞𝒞𝒞 1 ut set (any rbetween inby the source database or in the staging area) with an output set (a two sets of tables. Input : 𝒞𝒞𝒞𝒞 1 fExam bles possible, perhaps at the expense thecompletion comemented aFROM queue. Algorithm 1:� will: Time-Constrained Fragment and2as Compare (TCFC) or in theusing DW).sections, For givenwe � and ��,� , the relation bethe fragmented and Output : differences reportofand status erea previous two have formally described algorithm atspecified table level. the described algorithm, JOIN dCourse 2 needed Output differences report and Using completion status The metadata for comparing an input pleteness of the result, the algorithm should perform 𝑟𝑟𝑟𝑟𝑎𝑎𝑎𝑎𝑎𝑎𝑎𝑎𝑎𝑎𝑎𝑎𝑟𝑟𝑟𝑟𝑡𝑡𝑡𝑡 ← 𝑎𝑎𝑎𝑎𝑎𝑎𝑎𝑎𝑎𝑎𝑎𝑎𝑎𝑎𝑎𝑎𝑒𝑒𝑒𝑒 𝑎𝑎𝑎𝑎 𝑎𝑎𝑎𝑎 𝑎𝑎𝑎𝑎 𝑎𝑎𝑎𝑎 // list of differences 3 � will be evaluated in accordance with the valuated fragments i.e.1���, �,now �Input : 𝒞𝒞𝒞𝒞 mparison data sets (databases) is comprised of a number of individual table comparisons. Each table the helpforof ofthetwo metadata, we can introduce a global, time-constrained algorithm for providing a “global �,� ON fExam.courseId = dCourse.courseId 𝑟𝑟𝑟𝑟𝑎𝑎𝑎𝑎𝑎𝑎𝑎𝑎𝑎𝑎𝑎𝑎𝑟𝑟𝑟𝑟𝑡𝑡𝑡𝑡 ← 𝑎𝑎𝑎𝑎𝑎𝑎𝑎𝑎𝑎𝑎𝑎𝑎𝑎𝑎𝑎𝑎𝑒𝑒𝑒𝑒 𝑎𝑎𝑎𝑎𝑎𝑎𝑎𝑎𝑎𝑎𝑎𝑎𝑎𝑎𝑎𝑎 // list of differences 3 set (relation r(R)) with output set (setrelation of rethe comparison operations at ta- jobs queue on 3.1. of The here isperformed. that relation does not exist. However, 𝑎𝑎𝑎𝑎𝑄𝑄𝑄𝑄𝑠𝑠𝑠𝑠𝑠𝑠𝑠𝑠𝑠𝑠𝑠𝑠𝑠𝑠𝑠𝑠 ← 𝑎𝑎𝑎𝑎𝑎𝑎𝑎𝑎𝑎𝑎𝑎𝑎𝑎𝑎𝑎𝑎𝑒𝑒𝑒𝑒 𝑎𝑎𝑎𝑎𝑎𝑎𝑎𝑎𝑎𝑎𝑎𝑎the 𝑎𝑎𝑎𝑎 first level for //all compare 4 isstatus dCourse.course_id view” the differences between two sets�(�) of: 𝑎𝑎𝑎𝑎𝑄𝑄𝑄𝑄𝑠𝑠𝑠𝑠𝑠𝑠𝑠𝑠𝑠𝑠𝑠𝑠𝑠𝑠𝑠𝑠 tables. 2 the Output differences and completion parison isInproblem ageneral, jobGROUP to beBY idea ofanthe algorithm (Algorithm 1) tojobs put all jobs in a priority ←rTCFC 𝑎𝑎𝑎𝑎𝑎𝑎𝑎𝑎𝑎𝑎𝑎𝑎𝑎𝑎𝑎𝑎𝑒𝑒𝑒𝑒 𝑎𝑎𝑎𝑎𝑎𝑎𝑎𝑎𝑎𝑎𝑎𝑎report 𝑎𝑎𝑎𝑎 database // compare 4The we compare an input set (any relation in the source or in the staging area) withqueue an output set (a nstructed from a set of relations �. The set of relations � is the result of the transformation lations ) is denoted as the metadata quintuple 5 on event (time frame has expired): bles, then all assigned (and necessary) comparison of 𝑟𝑟𝑟𝑟𝑎𝑎𝑎𝑎𝑎𝑎𝑎𝑎𝑎𝑎𝑎𝑎𝑟𝑟𝑟𝑟𝑡𝑡𝑡𝑡 ← 𝑎𝑎𝑎𝑎𝑎𝑎𝑎𝑎𝑎𝑎𝑎𝑎𝑎𝑎𝑎𝑎𝑒𝑒𝑒𝑒 𝑎𝑎𝑎𝑎 𝑎𝑎𝑎𝑎 𝑎𝑎𝑎𝑎 𝑎𝑎𝑎𝑎 // list of differences 3 metadata needed for comparing an area input set (relation 𝑟𝑟𝑟𝑟(𝑅𝑅𝑅𝑅)) with an output set (set�orof relations is and denoted as 29). ed) queue, execute them one one until theFor time runs out to 7), all get𝕤𝕤𝕤𝕤)executed (line 5by or on event (time frame has expired): rse_id=101 in the previous step: setand ofand relations the staging in the DW). given �toand �(lines , the5relation will bejobs fragmented specified �,� compare input outputinsets using our it is necessary apply inverse −1 algorithm 6 jobs cancel running job(s) . Since the transfor𝑎𝑎𝑎𝑎𝑄𝑄𝑄𝑄𝑠𝑠𝑠𝑠𝑠𝑠𝑠𝑠𝑠𝑠𝑠𝑠𝑠𝑠𝑠𝑠 ← 𝑎𝑎𝑎𝑎𝑎𝑎𝑎𝑎𝑎𝑎𝑎𝑎𝑎𝑎𝑎𝑎𝑒𝑒𝑒𝑒 𝑎𝑎𝑎𝑎 𝑎𝑎𝑎𝑎 𝑎𝑎𝑎𝑎 𝑎𝑎𝑎𝑎 // compare queue 4 the fragments on the second level and so on. ). (𝑟𝑟𝑟𝑟(𝑅𝑅𝑅𝑅), Since the transformation 𝜏𝜏𝜏𝜏 is the transformation that has , 𝑎𝑎𝑎𝑎 𝑎𝑎𝑎𝑎 𝑎𝑎𝑎𝑎 𝑎𝑎𝑎𝑎𝑎𝑎𝑎𝑎 , 𝑎𝑎𝑎𝑎 𝑎𝑎𝑎𝑎 𝑎𝑎𝑎𝑎 𝑎𝑎𝑎𝑎𝑎𝑎𝑎𝑎 metadata quintuple 𝒞𝒞𝒞𝒞 = 𝕤𝕤𝕤𝕤, 𝜏𝜏𝜏𝜏 6 cancel running job(s) 𝑅𝑅𝑅𝑅 the fragments 𝑅𝑅𝑅𝑅 dCourse.course_id, �� �, ��,� � will be evaluated in accordance with the aggregate functions will be relation evaluated for i.e. set, such that forSELECT each instance of the � we can state that = ����, ��(�)�. The −1 �has return 𝑟𝑟𝑟𝑟𝑎𝑎𝑎𝑎𝑎𝑎𝑎𝑎𝑎𝑎𝑎𝑎𝑟𝑟𝑟𝑟𝑡𝑡𝑡𝑡, UNCOMPLETED 7 thus harmonizing return 𝑟𝑟𝑟𝑟𝑎𝑎𝑎𝑎𝑎𝑎𝑎𝑎𝑎𝑎𝑎𝑎𝑟𝑟𝑟𝑟𝑡𝑡𝑡𝑡, UNCOMPLETED 7setevent 5τ in (time frame expired): mation is Section the transformation that been dStudent.student_id, will reconstruct relation s(R), applied toalgorithm relation 𝑟𝑟𝑟𝑟questionable to produce a on of The relations 𝕤𝕤𝕤𝕤, 𝜏𝜏𝜏𝜏here isCompare that the applied relation does not However, relation Algorithm Time-Constrained Fragment andhas (TCFC) canexist. beBegin ensured by the traversing tree according to transformation is 1: notdescribed if we 3.1. adhere toproblem the limitations specified in the �(�) This 8 –1 ed, SUM(hasPassed) AS sumPassed, 8to Begin ma of Input theequivalent two sets prior comparison. The relations are iteratively aggregated and 6 be cancel running job(s) �(�) can reconstructed arecord setrelations of relations �.source set of relations �fragmented, is the result of the transformation tototable relation r to to produce a one set of , The τ then will re- the (each record fact exactlyfrom in a data table). :in adata 𝒞𝒞𝒞𝒞 corresponds breadth-first order, which can be straightforwardinitialization ed, AVG(hasPassed) ASinput avgPassed, 9sets //𝑎𝑎𝑎𝑎𝑎𝑎𝑎𝑎initialization �� to τ over �, the i.e. identity � = 7�(�). To compare and𝑅𝑅𝑅𝑅 output sets usingsets ourfrom algorithm necessary applyainverse and aggregate 𝑎𝑎𝑎𝑎𝑎𝑎𝑎𝑎𝑎𝑎𝑎𝑎𝑎𝑎𝑎𝑎𝑎𝑎𝑎𝑎it𝑅𝑅𝑅𝑅 .is9With 𝒞𝒞𝒞𝒞 we//to denote set of ared according fragmentation from 𝑎𝑎𝑎𝑎𝑎𝑎𝑎𝑎𝑎𝑎𝑎𝑎 return 𝑟𝑟𝑟𝑟𝑎𝑎𝑎𝑎𝑎𝑎𝑎𝑎𝑎𝑎𝑎𝑎𝑟𝑟𝑟𝑟𝑡𝑡𝑡𝑡, UNCOMPLETED a, both � and � are the operators. Output : differences report and completion status t COUNT(hasPassed) AS recCount �� -1 𝑡𝑡𝑡𝑡 ← 𝑎𝑎𝑎𝑎𝑎𝑎𝑎𝑎𝑎𝑎𝑎𝑎𝑎𝑎𝑎𝑎𝑒𝑒𝑒𝑒 𝑡𝑡𝑡𝑡𝑠𝑠𝑠𝑠𝑠𝑠𝑠𝑠𝑠𝑠𝑠𝑠𝑠𝑠𝑠𝑠 10 𝑡𝑡𝑡𝑡𝑒𝑒𝑒𝑒 of ←fordatabases. 𝑎𝑎𝑎𝑎𝑎𝑎𝑎𝑎𝑎𝑎𝑎𝑎𝑎𝑎𝑎𝑎𝑒𝑒𝑒𝑒 𝑡𝑡𝑡𝑡𝑠𝑠𝑠𝑠𝑠𝑠𝑠𝑠𝑠𝑠𝑠𝑠𝑠𝑠𝑠𝑠 of 10 over outputBegin set, that each instance the relation � we can state that � =𝑒𝑒𝑒𝑒 � ��(�)�. The transformation needed for defined comparing a pair 8 eetadata inverse quintuples transformation is τsimply withsuch of relational algebra: FROM fExam 𝑟𝑟𝑟𝑟𝑎𝑎𝑎𝑎𝑎𝑎𝑎𝑎𝑎𝑎𝑎𝑎𝑟𝑟𝑟𝑟𝑡𝑡𝑡𝑡 ← 𝑎𝑎𝑎𝑎𝑎𝑎𝑎𝑎𝑎𝑎𝑎𝑎𝑎𝑎𝑎𝑎𝑒𝑒𝑒𝑒 𝑎𝑎𝑎𝑎𝑎𝑎𝑎𝑎𝑎𝑎𝑎𝑎𝑎𝑎𝑎𝑎inverse // the listoperation of differences for each c in ∈ 𝑟𝑟𝑟𝑟the for each c ∈questionable 𝑟𝑟𝑟𝑟 𝒞𝒞𝒞𝒞, is anifiterative existence of dCourse such isquintuple not we adhere to the11 limitations dCourse) = mparison of twoJOIN data sets, 9an according11transformation to initialization a metadata process that can bespecified illustrated by // −1 (𝕤𝕤𝕤𝕤), (𝑎𝑎𝑎𝑎. 𝑟𝑟𝑟𝑟, 𝜏𝜏𝜏𝜏 −1 (𝕤𝕤𝕤𝕤), 𝑎𝑎𝑎𝑎. 𝑎𝑎𝑎𝑎𝑎𝑎𝑎𝑎𝑎𝑎𝑎𝑎𝑎𝑎𝑎𝑎𝑎𝑎𝑎𝑎𝑅𝑅𝑅𝑅 , 𝑎𝑎𝑎𝑎. 𝑎𝑎𝑎𝑎𝑎𝑎𝑎𝑎𝑎𝑎𝑎𝑎𝑎𝑎𝑎𝑎𝑎𝑎𝑎𝑎𝑅𝑅𝑅𝑅 , 𝑡𝑡𝑡𝑡𝑒𝑒𝑒𝑒 ) 𝑎𝑎𝑎𝑎𝑄𝑄𝑄𝑄𝑠𝑠𝑠𝑠𝑠𝑠𝑠𝑠𝑠𝑠𝑠𝑠𝑠𝑠𝑠𝑠. enqueue 12 𝑎𝑎𝑎𝑎𝑄𝑄𝑄𝑄𝑠𝑠𝑠𝑠𝑠𝑠𝑠𝑠𝑠𝑠𝑠𝑠𝑠𝑠𝑠𝑠 ←ON 𝑎𝑎𝑎𝑎𝑎𝑎𝑎𝑎𝑎𝑎𝑎𝑎𝑎𝑎𝑎𝑎𝑒𝑒𝑒𝑒 𝑎𝑎𝑎𝑎 𝑎𝑎𝑎𝑎 𝑎𝑎𝑎𝑎 𝑎𝑎𝑎𝑎 // compare jobs queue (𝑎𝑎𝑎𝑎. ) 𝑎𝑎𝑎𝑎𝑄𝑄𝑄𝑄𝑠𝑠𝑠𝑠𝑠𝑠𝑠𝑠𝑠𝑠𝑠𝑠𝑠𝑠𝑠𝑠. enqueue 𝑟𝑟𝑟𝑟, 𝜏𝜏𝜏𝜏 𝑎𝑎𝑎𝑎. 𝑎𝑎𝑎𝑎 𝑎𝑎𝑎𝑎 𝑎𝑎𝑎𝑎 𝑎𝑎𝑎𝑎𝑎𝑎𝑎𝑎 , 𝑎𝑎𝑎𝑎. 𝑎𝑎𝑎𝑎 𝑎𝑎𝑎𝑎 𝑎𝑎𝑎𝑎 𝑎𝑎𝑎𝑎𝑎𝑎𝑎𝑎 , 𝑡𝑡𝑡𝑡 12 introductory part of Section 3 (each record in a fact table corresponds to exactly one record in a data source table). 𝑅𝑅𝑅𝑅 𝑅𝑅𝑅𝑅 𝑒𝑒𝑒𝑒 dCourse.courseId nbalanced tree where fExam.courseId each10 node represents a fragment 𝑡𝑡𝑡𝑡𝑒𝑒𝑒𝑒= ← 𝑎𝑎𝑎𝑎𝑎𝑎𝑎𝑎𝑎𝑎𝑎𝑎𝑎𝑎𝑎𝑎𝑒𝑒𝑒𝑒 �����,����������) ��𝑡𝑡𝑡𝑡𝑠𝑠𝑠𝑠𝑠𝑠𝑠𝑠𝑠𝑠𝑠𝑠𝑠𝑠𝑠𝑠based on the aggregation set and the fragmentation set 13 // computing Note that, for identical schema, both � and � are the identity operators. 13 // computing on eventJOIN (time frame hasmeans expired): dStudent with the ed comparing 𝑟𝑟𝑟𝑟isand 𝑠𝑠𝑠𝑠 according to 𝑋𝑋𝑋𝑋 and A1 isof represented for that each c ∈ 𝑟𝑟𝑟𝑟 11This ����for that level (Figure 2). In this running example (Figure 1), the14 inverse transformation simply defined with the1operation algebra: repeat 14 relational repeat ON fExam.studentId=dStudent.studentId cancel job(s) −1 (𝕤𝕤𝕤𝕤), Date dCourse)). , 𝐿𝐿𝐿𝐿 ,…, 𝐿𝐿𝐿𝐿 , the further of the⊳⊲tree. at the root level results with differences in fragments 𝐿𝐿𝐿𝐿 (𝑎𝑎𝑎𝑎. ) 𝑎𝑎𝑎𝑎𝑄𝑄𝑄𝑄𝑠𝑠𝑠𝑠𝑠𝑠𝑠𝑠𝑠𝑠𝑠𝑠𝑠𝑠𝑠𝑠. enqueue 𝑟𝑟𝑟𝑟, 𝜏𝜏𝜏𝜏 𝑎𝑎𝑎𝑎. 𝑎𝑎𝑎𝑎 𝑎𝑎𝑎𝑎 𝑎𝑎𝑎𝑎 𝑎𝑎𝑎𝑎𝑎𝑎𝑎𝑎 , 𝑎𝑎𝑎𝑎. 𝑎𝑎𝑎𝑎 𝑎𝑎𝑎𝑎 𝑎𝑎𝑎𝑎 𝑎𝑎𝑎𝑎𝑎𝑎𝑎𝑎 𝑡𝑡𝑡𝑡 12 ��If the comparison 1 2 𝑛𝑛𝑛𝑛 𝑅𝑅𝑅𝑅 𝑅𝑅𝑅𝑅 𝑒𝑒𝑒𝑒 dStudent, dDate, dCourse) =𝑎𝑎𝑎𝑎𝑄𝑄𝑄𝑄𝑠𝑠𝑠𝑠𝑠𝑠𝑠𝑠𝑠𝑠𝑠𝑠𝑠𝑠𝑠𝑠.dequeue into(𝑟𝑟𝑟𝑟, 𝑠𝑠𝑠𝑠, 𝑎𝑎𝑎𝑎𝑎𝑎𝑎𝑎𝑎𝑎𝑎𝑎𝑎𝑎𝑎𝑎𝑎𝑎𝑎𝑎𝑅𝑅𝑅𝑅 , 𝑎𝑎𝑎𝑎𝑎𝑎𝑎𝑎𝑎𝑎𝑎𝑎𝑎𝑎𝑎𝑎𝑎𝑎𝑎𝑎𝑅𝑅𝑅𝑅15 τ (fExam, WHERE course_id = 101 15 𝑎𝑎𝑎𝑎𝑄𝑄𝑄𝑄𝑠𝑠𝑠𝑠𝑠𝑠𝑠𝑠𝑠𝑠𝑠𝑠𝑠𝑠𝑠𝑠. dequeue into(𝑟𝑟𝑟𝑟, 𝑠𝑠𝑠𝑠, 𝑎𝑎𝑎𝑎𝑎𝑎𝑎𝑎𝑎𝑎𝑎𝑎𝑎𝑎𝑎𝑎𝑎𝑎𝑎𝑎𝑅𝑅𝑅𝑅 , 𝑎𝑎𝑎𝑎𝑎𝑎𝑎𝑎𝑎𝑎𝑎𝑎𝑎𝑎𝑎𝑎𝑎𝑎𝑎𝑎𝑅𝑅𝑅𝑅 , 𝑡𝑡𝑡𝑡𝑒𝑒𝑒𝑒 ) , 𝑡𝑡𝑡𝑡𝑒𝑒𝑒𝑒 ) return 𝑟𝑟𝑟𝑟𝑎𝑎𝑎𝑎𝑎𝑎𝑎𝑎𝑎𝑎𝑎𝑎𝑟𝑟𝑟𝑟𝑡𝑡𝑡𝑡, ({fExam, dStudent, dDate, we acquire relation �(�) which can be2 compared , dCourse}) 𝐿𝐿𝐿𝐿2UNCOMPLETED ,…, 𝐿𝐿𝐿𝐿𝑛𝑛𝑛𝑛 will be computing carried out← according to 𝑋𝑋𝑋𝑋 and 𝐴𝐴𝐴𝐴2 and will produce the root’s children, arison of 𝐿𝐿𝐿𝐿1BY 13 // GROUP dCourse.course_id, �fragments ) 𝑋𝑋𝑋𝑋 ℎ𝑎𝑎𝑎𝑎𝑎𝑎𝑎𝑎𝑎𝑎𝑎𝑎(𝑎𝑎𝑎𝑎 𝑎𝑎𝑎𝑎 𝑎𝑎𝑎𝑎 𝑎𝑎𝑎𝑎𝑎𝑎𝑎𝑎 16 𝑋𝑋𝑋𝑋 ← ℎ𝑎𝑎𝑎𝑎𝑎𝑎𝑎𝑎𝑎𝑎𝑎𝑎(𝑎𝑎𝑎𝑎 𝑎𝑎𝑎𝑎𝑎𝑎𝑎𝑎𝑎𝑎𝑎𝑎𝑎𝑎𝑎𝑎𝑅𝑅𝑅𝑅 ) 16 ����(���������,����������,���������,����������) 𝑅𝑅𝑅𝑅 𝑅𝑅𝑅𝑅 𝑅𝑅𝑅𝑅 Begin orithm described in Section 3.1. it is not necessary to reconstruct �(�), dStudent.student_id repeat 14More precisely,
14
Information Technology and Control
ly implemented using a queue. Comparison of two data sets (databases) is comprised of a number of individual table comparisons. Each table comparison is a job to be performed. The idea of
2018/1/47
the TCFC algorithm (Algorithm 1) is to put all jobs in a priority (sorted) queue, and execute them one by one until the time runs out (lines 5 to 7), or all jobs get executed (line 29).
Algorithm 1: Time-Constrained Fragment and Compare (TCFC) Input: 𝒞𝒞𝒞𝒞 1 2 Output: differences report and completion status 𝑟𝑟𝑟𝑟𝑎𝑎𝑎𝑎𝑎𝑎𝑎𝑎𝑎𝑎𝑎𝑎𝑟𝑟𝑟𝑟𝑡𝑡𝑡𝑡 ← 𝑎𝑎𝑎𝑎𝑎𝑎𝑎𝑎𝑎𝑎𝑎𝑎𝑎𝑎𝑎𝑎𝑒𝑒𝑒𝑒 𝑎𝑎𝑎𝑎𝑎𝑎𝑎𝑎𝑎𝑎𝑎𝑎𝑎𝑎𝑎𝑎 // list of differences 3 𝑎𝑎𝑎𝑎𝑄𝑄𝑄𝑄𝑠𝑠𝑠𝑠𝑠𝑠𝑠𝑠𝑠𝑠𝑠𝑠𝑠𝑠𝑠𝑠 ← 𝑎𝑎𝑎𝑎𝑎𝑎𝑎𝑎𝑎𝑎𝑎𝑎𝑎𝑎𝑎𝑎𝑒𝑒𝑒𝑒 𝑎𝑎𝑎𝑎𝑎𝑎𝑎𝑎𝑎𝑎𝑎𝑎𝑎𝑎𝑎𝑎 // compare jobs queue 4 5 on event (time frame has expired): 6 cancel running job(s) return 𝑟𝑟𝑟𝑟𝑎𝑎𝑎𝑎𝑎𝑎𝑎𝑎𝑎𝑎𝑎𝑎𝑟𝑟𝑟𝑟𝑡𝑡𝑡𝑡, UNCOMPLETED 7 8 Begin 9 // initialization 𝑡𝑡𝑡𝑡𝑒𝑒𝑒𝑒 ← 𝑎𝑎𝑎𝑎𝑎𝑎𝑎𝑎𝑎𝑎𝑎𝑎𝑎𝑎𝑎𝑎𝑒𝑒𝑒𝑒 𝑡𝑡𝑡𝑡𝑠𝑠𝑠𝑠𝑠𝑠𝑠𝑠𝑠𝑠𝑠𝑠𝑠𝑠𝑠𝑠 10 for each c ∈ 𝑟𝑟𝑟𝑟 11 𝑎𝑎𝑎𝑎𝑄𝑄𝑄𝑄𝑠𝑠𝑠𝑠𝑠𝑠𝑠𝑠𝑠𝑠𝑠𝑠𝑠𝑠𝑠𝑠.enqueue(𝑎𝑎𝑎𝑎. 𝑟𝑟𝑟𝑟, 𝜏𝜏𝜏𝜏 −1 (𝕤𝕤𝕤𝕤), 𝑎𝑎𝑎𝑎. 𝑎𝑎𝑎𝑎𝑎𝑎𝑎𝑎𝑎𝑎𝑎𝑎𝑎𝑎𝑎𝑎𝑎𝑎𝑎𝑎𝑅𝑅𝑅𝑅 , 𝑎𝑎𝑎𝑎. 𝑎𝑎𝑎𝑎𝑎𝑎𝑎𝑎𝑎𝑎𝑎𝑎𝑎𝑎𝑎𝑎𝑎𝑎𝑎𝑎𝑅𝑅𝑅𝑅 , 𝑡𝑡𝑡𝑡𝑒𝑒𝑒𝑒 ) 12 13 // computing repeat 14 15 𝑎𝑎𝑎𝑎𝑄𝑄𝑄𝑄𝑠𝑠𝑠𝑠𝑠𝑠𝑠𝑠𝑠𝑠𝑠𝑠𝑠𝑠𝑠𝑠.dequeue into(𝑟𝑟𝑟𝑟, 𝑠𝑠𝑠𝑠, 𝑎𝑎𝑎𝑎𝑎𝑎𝑎𝑎𝑎𝑎𝑎𝑎𝑎𝑎𝑎𝑎𝑎𝑎𝑎𝑎𝑅𝑅𝑅𝑅 , 𝑎𝑎𝑎𝑎𝑎𝑎𝑎𝑎𝑎𝑎𝑎𝑎𝑎𝑎𝑎𝑎𝑎𝑎𝑎𝑎𝑅𝑅𝑅𝑅 , 𝑡𝑡𝑡𝑡𝑒𝑒𝑒𝑒 ) 𝑋𝑋𝑋𝑋𝑅𝑅𝑅𝑅 ← ℎ𝑎𝑎𝑎𝑎𝑎𝑎𝑎𝑎𝑎𝑎𝑎𝑎(𝑎𝑎𝑎𝑎𝑎𝑎𝑎𝑎𝑎𝑎𝑎𝑎𝑎𝑎𝑎𝑎𝑎𝑎𝑎𝑎𝑅𝑅𝑅𝑅 ) 16 𝒜𝒜𝒜𝒜𝑅𝑅𝑅𝑅 ← ℎ𝑎𝑎𝑎𝑎𝑎𝑎𝑎𝑎𝑎𝑎𝑎𝑎(𝑎𝑎𝑎𝑎𝑎𝑎𝑎𝑎𝑎𝑎𝑎𝑎𝑎𝑎𝑎𝑎𝑎𝑎𝑎𝑎𝑅𝑅𝑅𝑅 ) 17 𝑞𝑞𝑞𝑞𝑟𝑟𝑟𝑟 ← Compute Aggregates(𝑟𝑟𝑟𝑟, 𝑋𝑋𝑋𝑋𝑅𝑅𝑅𝑅 , 𝒜𝒜𝒜𝒜𝑅𝑅𝑅𝑅 , 𝑡𝑡𝑡𝑡𝑒𝑒𝑒𝑒 ) 18 𝑞𝑞𝑞𝑞𝑠𝑠𝑠𝑠 ← Compute Aggregates(𝑠𝑠𝑠𝑠, 𝑋𝑋𝑋𝑋𝑅𝑅𝑅𝑅 , 𝒜𝒜𝒜𝒜𝑅𝑅𝑅𝑅 , 𝑡𝑡𝑡𝑡𝑒𝑒𝑒𝑒 ) 19 20 for each 𝑡𝑡𝑡𝑡 ∈ �𝜋𝜋𝜋𝜋𝑋𝑋𝑋𝑋 (𝑞𝑞𝑞𝑞𝑟𝑟𝑟𝑟 ) ∖ 𝜋𝜋𝜋𝜋𝑋𝑋𝑋𝑋 (𝑞𝑞𝑞𝑞𝑠𝑠𝑠𝑠 )� 21 𝑟𝑟𝑟𝑟𝑎𝑎𝑎𝑎𝑎𝑎𝑎𝑎𝑎𝑎𝑎𝑎𝑟𝑟𝑟𝑟𝑡𝑡𝑡𝑡.add(𝑟𝑟𝑟𝑟, 𝑡𝑡𝑡𝑡, MISSING) // meaning: for input set r, t is missing from output set 22 for each t ∈ �𝜋𝜋𝜋𝜋𝑋𝑋𝑋𝑋 (𝑞𝑞𝑞𝑞𝑠𝑠𝑠𝑠 ) ∖ 𝜋𝜋𝜋𝜋𝑋𝑋𝑋𝑋 (𝑞𝑞𝑞𝑞𝑟𝑟𝑟𝑟 )� 23 𝑟𝑟𝑟𝑟𝑎𝑎𝑎𝑎𝑎𝑎𝑎𝑎𝑎𝑎𝑎𝑎𝑟𝑟𝑟𝑟𝑡𝑡𝑡𝑡.add(𝑟𝑟𝑟𝑟, 𝑡𝑡𝑡𝑡, EXCESS) // meaning: for input set r, t is excessive in output set for each 𝑡𝑡𝑡𝑡𝑟𝑟𝑟𝑟 ∈ 𝑞𝑞𝑞𝑞𝑟𝑟𝑟𝑟 , 𝑡𝑡𝑡𝑡𝑠𝑠𝑠𝑠 ∈ 𝑞𝑞𝑞𝑞𝑠𝑠𝑠𝑠 ∶ 𝑡𝑡𝑡𝑡𝑟𝑟𝑟𝑟 [𝑋𝑋𝑋𝑋] = 𝑡𝑡𝑡𝑡𝑠𝑠𝑠𝑠 [𝑋𝑋𝑋𝑋] ⋀ 𝑡𝑡𝑡𝑡𝑟𝑟𝑟𝑟 ≠ 𝑡𝑡𝑡𝑡𝑠𝑠𝑠𝑠 24 25 𝑟𝑟𝑟𝑟𝑎𝑎𝑎𝑎𝑎𝑎𝑎𝑎𝑎𝑎𝑎𝑎𝑟𝑟𝑟𝑟𝑡𝑡𝑡𝑡.add(𝑟𝑟𝑟𝑟, 𝑡𝑡𝑡𝑡𝑟𝑟𝑟𝑟 [𝑋𝑋𝑋𝑋], DIFF) //meaning: for input set r, 𝑡𝑡𝑡𝑡𝑟𝑟𝑟𝑟 [𝑋𝑋𝑋𝑋] is excessive in the output set if 𝑡𝑡𝑡𝑡𝑎𝑎𝑎𝑎𝑎𝑎𝑎𝑎𝑎𝑎𝑎𝑎 (𝑎𝑎𝑎𝑎𝑎𝑎𝑎𝑎𝑎𝑎𝑎𝑎𝑎𝑎𝑎𝑎𝑎𝑎𝑎𝑎𝑅𝑅𝑅𝑅 ) 𝑖𝑖𝑖𝑖𝑠𝑠𝑠𝑠 𝑛𝑛𝑛𝑛𝑑𝑑𝑑𝑑𝑑𝑑𝑑𝑑 𝑎𝑎𝑎𝑎𝑎𝑎𝑎𝑎𝑎𝑎𝑎𝑎𝑎𝑎𝑎𝑎𝑒𝑒𝑒𝑒 26 27 𝑎𝑎𝑎𝑎𝑄𝑄𝑄𝑄𝑠𝑠𝑠𝑠𝑠𝑠𝑠𝑠𝑠𝑠𝑠𝑠𝑠𝑠𝑠𝑠.enqueue(𝑟𝑟𝑟𝑟, 𝑠𝑠𝑠𝑠, 𝑡𝑡𝑡𝑡𝑎𝑎𝑎𝑎𝑎𝑎𝑎𝑎𝑎𝑎𝑎𝑎 (𝑎𝑎𝑎𝑎𝑎𝑎𝑎𝑎𝑎𝑎𝑎𝑎𝑎𝑎𝑎𝑎𝑎𝑎𝑎𝑎𝑅𝑅𝑅𝑅 ), 𝑡𝑡𝑡𝑡𝑎𝑎𝑎𝑎𝑎𝑎𝑎𝑎𝑎𝑎𝑎𝑎 (𝑎𝑎𝑎𝑎𝑎𝑎𝑎𝑎𝑎𝑎𝑎𝑎𝑎𝑎𝑎𝑎𝑎𝑎𝑎𝑎𝑅𝑅𝑅𝑅 ), 𝑡𝑡𝑡𝑡𝑟𝑟𝑟𝑟 [𝑋𝑋𝑋𝑋]) until 𝑎𝑎𝑎𝑎𝑄𝑄𝑄𝑄𝑠𝑠𝑠𝑠𝑠𝑠𝑠𝑠𝑠𝑠𝑠𝑠𝑠𝑠𝑠𝑠. 𝑖𝑖𝑖𝑖𝑠𝑠𝑠𝑠𝑠𝑠𝑠𝑠𝑠𝑠𝑠𝑠𝑠𝑠𝑠𝑠𝑠𝑠𝑠𝑠𝑠𝑠𝑠𝑠 28 29 return report, COMPLETED bal overview, tables are30compared level of detailoverview, in a roundtables robinare fashion. We use Endwith an increasing To achieve a global compared with an increasing level of detail in a round robin fashi In general, we compare input set (any relation r in the source database or in th s an appropriate data structure for storing and managing the jobs. If, for example, we have to compare a list (𝑎𝑎𝑎𝑎𝑄𝑄𝑄𝑄𝑠𝑠𝑠𝑠𝑠𝑠𝑠𝑠𝑠𝑠𝑠𝑠𝑠𝑠𝑠𝑠) as an appropriate data structure for an storing and managing the jobs. If, for example, we have set of relations in the staging area or in the DW). For given � and ��,� , the relatio s, this list will initially contain 10 elements (jobs). Theofcontent based on the set 10 pairs tables, of this𝑎𝑎𝑎𝑎𝑄𝑄𝑄𝑄𝑠𝑠𝑠𝑠𝑠𝑠𝑠𝑠𝑠𝑠𝑠𝑠𝑠𝑠𝑠𝑠 list willisinitially contain 10 of elements (jobs). The content of 𝑎𝑎𝑎𝑎𝑄𝑄𝑄𝑄𝑠𝑠𝑠𝑠𝑠𝑠𝑠𝑠𝑠𝑠𝑠𝑠𝑠𝑠𝑠𝑠 is based on a global tables are compared that repository for will b aggregate functions will as be the this fragments i.e. ���, �,of�the report, metadata initialized the beginning oftabase theThe algorithm (lines 3aevaluated uples 𝒞𝒞𝒞𝒞 (line 1). To Theachieve lists 𝑎𝑎𝑎𝑎𝑄𝑄𝑄𝑄𝑠𝑠𝑠𝑠𝑠𝑠𝑠𝑠𝑠𝑠𝑠𝑠𝑠𝑠𝑠𝑠 and overview, �,� �algorith report, for initialized atalgorithm, the beginning – at quintuples 𝒞𝒞𝒞𝒞 (line 1). lists serves 𝑎𝑎𝑎𝑎𝑄𝑄𝑄𝑄𝑠𝑠𝑠𝑠𝑠𝑠𝑠𝑠𝑠𝑠𝑠𝑠𝑠𝑠𝑠𝑠 and –1 To achieve a global overview, tables are compared with an increasing level of detail in a round robin fashion. We use with an increasing level of detail in a round robin include: schema of the relation r; transformation τ attotable level. Using the described algorithm, algorithm described in Section 3.1. The problem here is that the relation �(�) store the metadata for the tables to be compared 12) and to store output data. Metadata, and 4),(line are used to store the metadata for the tables to be compared (line 12) and to store output data. 8 fortostoring strained for providing a “global list (𝑎𝑎𝑎𝑎𝑄𝑄𝑄𝑄𝑠𝑠𝑠𝑠𝑠𝑠𝑠𝑠𝑠𝑠𝑠𝑠𝑠𝑠𝑠𝑠) as an appropriate data structure and managing the jobs. If, for example, we have to compare equivalent �(�) can be reconstructed from a set of relations �. The set of relation fashion. We use list ( ) serves as appropriate data used to obtain relation s from the set of relations ; pare twoalgorithm data sets and stored in aaa database thatrequired as a repository for this algorithm, include: to compare two data sets and stored in a database that serves as a repository for this algorithm pairs of tables, this list will initially The content of 𝑎𝑎𝑎𝑎𝑄𝑄𝑄𝑄𝑠𝑠𝑠𝑠𝑠𝑠𝑠𝑠𝑠𝑠𝑠𝑠𝑠𝑠𝑠𝑠 is based the set oli τ contain over �, 10 i.e.𝜏𝜏𝜏𝜏elements �−1 =used To input and output sets using𝕤𝕤𝕤𝕤;on our algorith structure for storing and managing the jobs. If, for exto10 obtain relation 𝑠𝑠𝑠𝑠 from set of relations 𝕤𝕤𝕤𝕤; nonempty 𝑎𝑎𝑎𝑎�(�). 𝑎𝑎𝑎𝑎𝑎𝑎𝑎𝑎𝑎𝑎𝑎𝑎𝑎𝑎𝑎𝑎 of ation 𝑟𝑟𝑟𝑟; transformation 𝜏𝜏𝜏𝜏 −1 used nonempty list of compare fragmentation sets; nonempty to(jobs). relation 𝑠𝑠𝑠𝑠 from the set of relations nonempty schema ofthe the relation 𝑟𝑟𝑟𝑟; transformation 𝑅𝑅𝑅𝑅obtain -1 report, initialized at the beginning of the algorithm (lines 3 nts;output set (setlist of relations 𝕤𝕤𝕤𝕤) is denoted as sets.– quintuples 𝒞𝒞𝒞𝒞 (line 1). The lists metadata 𝑎𝑎𝑎𝑎𝑄𝑄𝑄𝑄𝑠𝑠𝑠𝑠𝑠𝑠𝑠𝑠𝑠𝑠𝑠𝑠𝑠𝑠𝑠𝑠 and over output set, such that for each instance of the relation �w τ of aggregation nonempty 𝑎𝑎𝑎𝑎𝑎𝑎𝑎𝑎𝑎𝑎𝑎𝑎𝑎𝑎𝑎𝑎𝒜𝒜𝒜𝒜𝑅𝑅𝑅𝑅 we ample, have to compare 10fragmentation pairs of tables, list transformation of aggregation sets. sets;this nonempty list 𝑎𝑎𝑎𝑎 𝑎𝑎𝑎𝑎 𝑎𝑎𝑎𝑎 𝑎𝑎𝑎𝑎𝒜𝒜𝒜𝒜 list 𝑅𝑅𝑅𝑅 of aggregation To achievesets. a global overview, tables are compared with ansformation 𝜏𝜏𝜏𝜏 is the transformation that has4), are used to store the metadata existence and for the tables to be compared (line 12) and to store output data. Metadata of such an inverse transformation is not questionable if we adhere To achieve a global overview, tables are compared with an increasing level of detail in a round robin fashion. We use will initially contain 10 elements ( jobs). The content the 𝑎𝑎𝑎𝑎𝑄𝑄𝑄𝑄𝑠𝑠𝑠𝑠𝑠𝑠𝑠𝑠𝑠𝑠𝑠𝑠𝑠𝑠𝑠𝑠 list contains elements listX and listA being lists as well. Since we use 𝑎𝑎𝑎𝑎𝑎𝑎𝑎𝑎𝑎𝑎𝑎𝑎𝑎𝑎𝑎𝑎𝑎𝑎𝑎𝑎𝑎𝑎𝑎𝑎 list as Each contains elements listX being listselements as data well.structure Since wefor usestorin 𝑎𝑎𝑎𝑎𝑎𝑎𝑎𝑎𝑎𝑎𝑎𝑎𝑎𝑎𝑎𝑎𝑎𝑎𝑎𝑎𝑎𝑎𝑎𝑎 R element of the 𝑎𝑎𝑎𝑎𝑄𝑄𝑄𝑄𝑠𝑠𝑠𝑠𝑠𝑠𝑠𝑠𝑠𝑠𝑠𝑠𝑠𝑠𝑠𝑠 list R and listA Rcontains a list (𝑎𝑎𝑎𝑎𝑄𝑄𝑄𝑄𝑠𝑠𝑠𝑠𝑠𝑠𝑠𝑠𝑠𝑠𝑠𝑠𝑠𝑠𝑠𝑠) as an appropriate Each element of the list onstruct relation s(R), thus harmonizing the R to compare required two data sets and stored in apulled database that serves as a repository for this algorithm, include introductory part of Section 3 example, (each record in a fact table corresponds exactly afragmented, list (𝑎𝑎𝑎𝑎𝑄𝑄𝑄𝑄𝑠𝑠𝑠𝑠𝑠𝑠𝑠𝑠𝑠𝑠𝑠𝑠𝑠𝑠𝑠𝑠) asbased an appropriate data structure for storing managing the jobs. If, for we have to compare priority queue, first element the job with thetables, highest priority that will be next totolevel be pulle the iteratively first element the job with the highest priority that will beand next to represents be out from ofrepresents is on the set of metadata – the quintuTo achieve aaglobal overview, tables are compared with an increasing level of detail in a round robin fashion. We hen aggregated and 10 pairs of this list will initially contain 10 To achieve a global overview, tables are compared with an increasing ofo �� listX and listA being lists as well. Since we use −1 R to R schema, Note that, for identical boththe � is and � relations the identity operators. used obtain relation 𝑠𝑠𝑠𝑠𝑎𝑎𝑎𝑎𝑄𝑄𝑄𝑄𝑠𝑠𝑠𝑠𝑠𝑠𝑠𝑠𝑠𝑠𝑠𝑠𝑠𝑠𝑠𝑠 setbased of 𝕤𝕤𝕤𝕤; nonempty list 𝑎𝑎𝑎𝑎𝑎𝑎𝑎𝑎𝑎𝑎𝑎𝑎𝑎𝑎𝑎𝑎𝑎𝑎𝑎𝑎𝑅𝑅𝑅𝑅ele schema of theinitially relation 𝑟𝑟𝑟𝑟; transformation 𝜏𝜏𝜏𝜏 (jobs). the queue (line 15) processed. One job include afrom comparison on a are number of levels (that number is d 5)sets andfrom processed. One 𝒞𝒞𝒞𝒞job may include a comparison onan acontain number ofand levels (that number ismay determined pairs of tables, list will 10 elements The content on theexample, setThe of lists 𝑎𝑎𝑎𝑎𝑎𝑎𝑎𝑎𝑎𝑎𝑎𝑎𝑎𝑎𝑎𝑎𝑎𝑎𝑎𝑎10 we denote athis set of ples (line 1). The and report, initialized a lists list (𝑎𝑎𝑎𝑎𝑄𝑄𝑄𝑄𝑠𝑠𝑠𝑠𝑠𝑠𝑠𝑠𝑠𝑠𝑠𝑠𝑠𝑠𝑠𝑠) as appropriate data structure for storing andofmanaging the jobs. If, for we have tothe com 𝑅𝑅𝑅𝑅 . With metadata – quintuples 𝒞𝒞𝒞𝒞 (line 1). 𝑎𝑎𝑎𝑎𝑄𝑄𝑄𝑄𝑠𝑠𝑠𝑠𝑠𝑠𝑠𝑠𝑠𝑠𝑠𝑠𝑠𝑠𝑠𝑠 and a list (𝑎𝑎𝑎𝑎𝑄𝑄𝑄𝑄𝑠𝑠𝑠𝑠𝑠𝑠𝑠𝑠𝑠𝑠𝑠𝑠𝑠𝑠𝑠𝑠) as an appropriate data structure for storing and managing joo list as a priority queue, the first element repIn thisaggregation example (Figure 1), the inverse transformation is simply defined withand the of sets. fragmentation sets; nonempty list 𝑎𝑎𝑎𝑎𝑎𝑎𝑎𝑎𝑎𝑎𝑎𝑎R𝑎𝑎𝑎𝑎𝑎𝑎𝑎𝑎𝑎𝑎𝑎𝑎 𝑎𝑎𝑎𝑎𝒜𝒜𝒜𝒜 𝑅𝑅𝑅𝑅 listX elements). Thus, the next step is to pull first elements from 𝑎𝑎𝑎𝑎 𝑎𝑎𝑎𝑎 𝑎𝑎𝑎𝑎 𝑎𝑎𝑎𝑎𝑎𝑎𝑎𝑎 (line 16) 𝑎𝑎𝑎𝑎se 𝑎𝑎𝑎𝑎 by the number of listXR elements). Thus, the next step is to pull first elements from 𝑎𝑎𝑎𝑎 𝑎𝑎𝑎𝑎 (line 16) and 𝑎𝑎𝑎𝑎 𝑎𝑎𝑎𝑎 𝑎𝑎𝑎𝑎 𝑎𝑎𝑎𝑎𝒜𝒜𝒜𝒜 (line report, initialized at the beginning of the algorithm (lines 3 metadata – quintuples 𝒞𝒞𝒞𝒞 (line 1). The lists 𝑎𝑎𝑎𝑎𝑄𝑄𝑄𝑄𝑠𝑠𝑠𝑠𝑠𝑠𝑠𝑠𝑠𝑠𝑠𝑠𝑠𝑠𝑠𝑠 and 𝑅𝑅𝑅𝑅 at the beginning of algorithm (lines 4),initially are 𝑅𝑅𝑅𝑅 pairs 𝑅𝑅𝑅𝑅list 4), 10the pairs of tables, this 3 listand will contain 10 elements (jobs). The content of 𝑎𝑎𝑎𝑎𝑄𝑄𝑄𝑄𝑠𝑠𝑠𝑠𝑠𝑠𝑠𝑠𝑠𝑠𝑠𝑠𝑠𝑠𝑠𝑠 is based on the and are used to store the metadata for the tables to 10 of tables, this will initially contain 10 elements (jobs). The con ��resents the job with theRdCourse) highest priority that will beuseis 𝑎𝑎𝑎𝑎𝑎𝑎𝑎𝑎𝑎𝑎𝑎𝑎𝑎𝑎𝑎𝑎𝑎𝑎𝑎𝑎𝑎𝑎𝑎𝑎 (fExam, dStudent, dDate, =aggregate τ compared Each element of the 𝑎𝑎𝑎𝑎𝑄𝑄𝑄𝑄𝑠𝑠𝑠𝑠𝑠𝑠𝑠𝑠𝑠𝑠𝑠𝑠𝑠𝑠𝑠𝑠 list contains elements listX and listA being lists as well. Since we list as R12) 17) using function head. Based on the metadata, fragmentation and calculation performed for an iterative process that be illustrated by n head. Based onused the can metadata, fragmentation and aggregate calculation is performed for relations 𝑟𝑟𝑟𝑟 and 4), are used to store the metadata for the tables to be (line and to store output data. Metadata, initialized at 𝑎𝑎𝑎𝑎𝑄𝑄𝑄𝑄𝑠𝑠𝑠𝑠𝑠𝑠𝑠𝑠𝑠𝑠𝑠𝑠𝑠𝑠𝑠𝑠 the of thestored algorithm (lin quintuples 𝒞𝒞𝒞𝒞 (line The lists 𝑎𝑎𝑎𝑎𝑄𝑄𝑄𝑄𝑠𝑠𝑠𝑠𝑠𝑠𝑠𝑠𝑠𝑠𝑠𝑠𝑠𝑠𝑠𝑠 and report, to store the metadata metadata–for the tables to be1). comrequired compare twobeginning data setsproand in a dat initialized at t metadata –of quintuples 𝒞𝒞𝒞𝒞out (line 1).topriority The lists next to be with pulled from the queue (line 15) and �����(���������,����������,���������,����������) atwo priority the first represents the job the highest that will be and nextreport, toisbe pulled out from eneaggregation set and set dataqueue, (line 18) andelement 𝑠𝑠𝑠𝑠in (line 19). The result the Compute Agregates algorithm (Algorithm 2) a set tuples who −1of required compare setsused and a metadata database that serves as astore repository for thisfor algorithm, include: 19). The result ofthe thetofragmentation Compute Agregates algorithm (Algorithm 2) isand a set ofare tuples whose schema and 4),store are tostored store the for the tables to be compared (line 12) and to store output data. Metad pared (line 12) and to output data. Metadata, used to obta schema of the relation 𝑟𝑟𝑟𝑟; transformation 𝜏𝜏𝜏𝜏 4), used to the metadata the tables to be compared (line 1 cessed. One may include anumber comparison on a numA1 is represented with the cording to 𝑋𝑋𝑋𝑋1 and the𝑟𝑟𝑟𝑟; queue (line and One job may ajob comparison onset a 𝕤𝕤𝕤𝕤; of levels (that number is determined is15) determined by attributes contained in fragmentation and aggregation The resulting sets ofincl tup (�����,����������,���������,��������� the attributes contained into fragmentation setdata andcompare aggregation set. The resulting sets ofatuples 𝑞𝑞𝑞𝑞of used tothe obtain relation 𝑠𝑠𝑠𝑠include from the set relations nonempty list 𝑎𝑎𝑎𝑎set. 𝑎𝑎𝑎𝑎list 𝑎𝑎𝑎𝑎𝑎𝑎𝑎𝑎𝑎𝑎𝑎𝑎 of schema of the relation transformation 𝜏𝜏𝜏𝜏 −1processed. 𝑟𝑟𝑟𝑟 and required to two data sets and stored in database that serves as a repository for this algorithm, 𝑅𝑅𝑅𝑅 required compare two sets and stored in a daof aggregation fragmentation sets; nonempty 𝑎𝑎𝑎𝑎 𝑎𝑎𝑎𝑎 𝑎𝑎𝑎𝑎 𝑎𝑎𝑎𝑎𝒜𝒜𝒜𝒜 required to compare two data sets and stored in a database that serves as a 𝑅𝑅𝑅𝑅 ences in fragments 𝐿𝐿𝐿𝐿1 , 𝐿𝐿𝐿𝐿2 ,…, 𝐿𝐿𝐿𝐿𝑛𝑛𝑛𝑛 , the further ber of levels number is ⊳⊲ determined numlistX Thus, the step is(that totopull first elements from 𝑎𝑎𝑎𝑎𝑎𝑎𝑎𝑎𝑎𝑎𝑎𝑎by 𝑎𝑎𝑎𝑎𝑎𝑎𝑎𝑎difference (line 16)isand 𝑎𝑎𝑎𝑎𝑎𝑎𝑎𝑎𝑎𝑎𝑎𝑎𝑎𝑎𝑎𝑎𝒜𝒜𝒜𝒜 (line by differences. the number are being compared (lines 20next through 25) find differences. Each tuple added to the re 𝑞𝑞𝑞𝑞𝑎𝑎𝑎𝑎𝑎𝑎𝑎𝑎𝑠𝑠𝑠𝑠of R elements). 𝑅𝑅𝑅𝑅the ⊳⊲ dStudent ⊳⊲ dDate dCourse)). pared (lines 20 through 25)sets; to find Each difference is(fExam added to the resulting list of sets. fragmentation nonempty listthe 𝑎𝑎𝑎𝑎relation 𝑎𝑎𝑎𝑎𝒜𝒜𝒜𝒜 −1set of relations to obtain𝑟𝑟𝑟𝑟; relation 𝑠𝑠𝑠𝑠 from 𝕤𝕤𝕤𝕤;relation nonempty list𝑅𝑅𝑅𝑅the 𝑎𝑎𝑎𝑎listX 𝑎𝑎𝑎𝑎𝑎𝑎𝑎𝑎𝑎𝑎𝑎𝑎𝑎𝑎𝑎𝑎 schema of 𝑟𝑟𝑟𝑟;aggregation transformation 𝜏𝜏𝜏𝜏 −1ofused 𝑅𝑅𝑅𝑅tuple usedthe to obtain 𝑠𝑠𝑠𝑠 from se schema the relation transformation 𝜏𝜏𝜏𝜏calculation Each element ofthe the 𝑎𝑎𝑎𝑎𝑄𝑄𝑄𝑄𝑠𝑠𝑠𝑠𝑠𝑠𝑠𝑠𝑠𝑠𝑠𝑠𝑠𝑠𝑠𝑠 listperformed contains elements and 𝐴𝐴𝐴𝐴2 and will produce the root’s children, -1 aggregate report (lines 21, 23 and 25). Instantly processed job will be removed from list cQueue (lines 26 and 27) 17) using function head. Based on the metadata, fragmentation and is for relations Performing transformation τ ({fExam, dStudent, dDate,list dCourse}) we acquire re𝑟𝑟𝑟𝑟 23 and 25). Instantly processed job𝑎𝑎𝑎𝑎𝑄𝑄𝑄𝑄𝑠𝑠𝑠𝑠𝑠𝑠𝑠𝑠𝑠𝑠𝑠𝑠𝑠𝑠𝑠𝑠 will be removed from the list cQueue (lines 26aggregation 27).lists This way Each element of the list contains elements listX listA being as well. Since we use 𝑎𝑎𝑎𝑎𝑎𝑎𝑎𝑎𝑎𝑎𝑎𝑎𝑎𝑎𝑎𝑎𝑎𝑎𝑎𝑎𝑎𝑎𝑎𝑎 as R𝑎𝑎𝑎𝑎and Rand of sets. fragmentation sets; nonempty list 𝑎𝑎𝑎𝑎 𝑎𝑎𝑎𝑎 𝑎𝑎𝑎𝑎𝒜𝒜𝒜𝒜 𝑅𝑅𝑅𝑅 of aggregation sets. fragmentation sets; nonempty list 𝑎𝑎𝑎𝑎 𝑎𝑎𝑎𝑎 𝑎𝑎𝑎𝑎 𝑎𝑎𝑎𝑎𝒜𝒜𝒜𝒜 a priority queue, the first element represents the job wi 𝑅𝑅𝑅𝑅 while (jobs) removed fromusing the priority(Algorithm 2) queue elements (jobs) relating toitui 18) and 𝑠𝑠𝑠𝑠processed (line 19). elements The of the Compute Agregates algorithm a out set of tuples schema toare the relation algorithm described in is Section 3.1. Morewhose precisely, nts at(jobs) area priority removed from the the(line priority queue while elements (jobs) relating to �(�) unprocessed queue, first represents the result joblistwith the highest priority that will be(line next tolists be pulled from aps the expense of the completeness of the element Each element ofthe theattributes 𝑎𝑎𝑎𝑎𝑄𝑄𝑄𝑄𝑠𝑠𝑠𝑠𝑠𝑠𝑠𝑠𝑠𝑠𝑠𝑠𝑠𝑠𝑠𝑠 contains elements listX and listA being as well. Since we use lia Rthe Rcontains queue 15) and processed. job may include Each element oftothe 𝑎𝑎𝑎𝑎𝑄𝑄𝑄𝑄𝑠𝑠𝑠𝑠𝑠𝑠𝑠𝑠𝑠𝑠𝑠𝑠𝑠𝑠𝑠𝑠 list elements listX and listA being list ROne R𝑎𝑎𝑎𝑎𝑎𝑎𝑎𝑎𝑎𝑎𝑎𝑎𝑎𝑎𝑎𝑎𝑎𝑎𝑎𝑎𝑎𝑎𝑎𝑎 revealed between compared data sets are added to the priori comparisons remain in the list. Differences 𝑡𝑡𝑡𝑡 and is determined by contained in fragmentation set and aggregation set. The resulting sets of tuples 𝑞𝑞𝑞𝑞 𝑟𝑟𝑟𝑟 it is sufficient reconstruct the relation having all attributes contained in X and in 𝑟𝑟𝑟𝑟 revealed betweenqueue, compared datainclude sets area represents added to the priority queue as ainlevel in the Differences rst forlist. all the tables, then(line all 𝑡𝑡𝑡𝑡assigned queue and(and processed. One jobs job may comparison on a number of levels (that number iswill determined 𝑟𝑟𝑟𝑟 15) a priority the first element the job with the highest priority that be next to be pulled out listX elements). Thus, the next step by the number of R a priority queue, the first element represents the job with the highest priority -1 new for further inspections. It is evident that this algorithm can generate children jobs – each tuple 𝑡𝑡𝑡𝑡if are being compared (lines 20 through 25) to find differences. Each tuple difference is added to the resulting lis 𝑞𝑞𝑞𝑞 will be incorporated into an SQL will not be evaluated. The transformation τ 𝑠𝑠𝑠𝑠 her inspections. evident of thatlistX this can15) generate children jobs – each 𝑡𝑡𝑡𝑡𝑟𝑟𝑟𝑟 generates elements). the processed. next step isthe to pull firsttuple elements from 𝑎𝑎𝑎𝑎𝑎𝑎𝑎𝑎𝑎𝑎𝑎𝑎𝑎𝑎𝑎𝑎𝑎𝑎𝑎𝑎function (line 16) andof 𝑎𝑎𝑎𝑎𝑎𝑎𝑎𝑎levels 𝑎𝑎𝑎𝑎𝑎𝑎𝑎𝑎𝒜𝒜𝒜𝒜𝑅𝑅𝑅𝑅on (line by It theisnumber R algorithm the queue and job may include a comparison on a job number isThis determ 𝑅𝑅𝑅𝑅One 17) using head. Based the metadata, fragme a Thus, new job. queue 15) processed. may include a(that comparison a numb report (lines(line 21, 23 and 25). InstantlyOne processed job willand be removed from the list cQueue (lines 26 number and 27).on way �(�, �).(line rst order, which be function straightforwardly 17)can using head. Based onThe theofCompute Agregates metadata, fragmentation and aggregate calculation is performed for relations 𝑟𝑟𝑟𝑟pull listX elements). Thus, the next step is to pull first elements from 𝑎𝑎𝑎𝑎 𝑎𝑎𝑎𝑎 𝑎𝑎𝑎𝑎 𝑎𝑎𝑎𝑎𝑎𝑎𝑎𝑎 (line 16) and 𝑎𝑎𝑎𝑎 𝑎𝑎𝑎𝑎 𝑎𝑎𝑎𝑎 𝑎𝑎𝑎𝑎𝒜𝒜𝒜𝒜 by the number R (line 18) and 𝑠𝑠𝑠𝑠 (line 19). The result of the Compute Agre 𝑅𝑅𝑅𝑅 listX elements). Thus, the next step is to first elements by the number of algorithm constructs an SQL statement similar to the statements from Table 2. 𝑅𝑅𝑅𝑅 h R processed elements (jobs) are removed from the priority queue while elements (jobs) relating to unprocessed The following example illustrates the procedure of fragmenting two data sets regates algorithm constructs an SQL statement similar to the statements from Table 2.
To achieve a global overview, tables are compared with an increasing level of detail in a round robin fashion. We use list (𝑎𝑎𝑎𝑎𝑄𝑄𝑄𝑄𝑠𝑠𝑠𝑠𝑠𝑠𝑠𝑠𝑠𝑠𝑠𝑠𝑠𝑠𝑠𝑠) as use an appropriate data structure for storing and managing the jobs. If, for example, we have to compare level of detail in a round arobin fashion. We 10we pairs tables, list will content of 𝑎𝑎𝑎𝑎𝑄𝑄𝑄𝑄𝑠𝑠𝑠𝑠𝑠𝑠𝑠𝑠𝑠𝑠𝑠𝑠𝑠𝑠𝑠𝑠 is based on the 15 set of ng the jobs. If, for example, haveofto compare Informationthis Technology andinitially Control contain 10 elements (jobs). The 2018/1/47 metadata – quintuples The content of 𝑎𝑎𝑎𝑎𝑄𝑄𝑄𝑄𝑠𝑠𝑠𝑠𝑠𝑠𝑠𝑠𝑠𝑠𝑠𝑠𝑠𝑠𝑠𝑠 is based on the set of 𝒞𝒞𝒞𝒞 (line 1). The lists 𝑎𝑎𝑎𝑎𝑄𝑄𝑄𝑄𝑠𝑠𝑠𝑠𝑠𝑠𝑠𝑠𝑠𝑠𝑠𝑠𝑠𝑠𝑠𝑠 and report, initialized at the beginning of the algorithm (lines 3 4), are used to 3store the metadata for the tables to be compared (line 12) and to store output data. Metadata, lized at the beginning of and the algorithm (lines required to Metadata, compare two data sets and stored in a database that serves as a repository for this algorithm, include: (line 12) and to store output data. berforofthis listX Thus,𝑟𝑟𝑟𝑟;the next step is 𝜏𝜏𝜏𝜏to−1pull 23 and 25). Instantly processed job will belist 𝑎𝑎𝑎𝑎𝑎𝑎𝑎𝑎𝑎𝑎𝑎𝑎𝑎𝑎𝑎𝑎𝑎𝑎𝑎𝑎𝑅𝑅𝑅𝑅 of used to(lines obtain21, relation 𝑠𝑠𝑠𝑠 from the set of relations 𝕤𝕤𝕤𝕤; nonempty schema of theinclude: relation transformation ves as a repository algorithm, R elements). removed from the list cQueue (lines 26 and 27). This aggregation sets. fragmentation nonempty list 𝑎𝑎𝑎𝑎𝑎𝑎𝑎𝑎𝑎𝑎𝑎𝑎𝑎𝑎𝑎𝑎𝒜𝒜𝒜𝒜𝑅𝑅𝑅𝑅 of om the set of relations nonempty list 𝑎𝑎𝑎𝑎𝑎𝑎𝑎𝑎𝑎𝑎𝑎𝑎sets; 𝑎𝑎𝑎𝑎𝑎𝑎𝑎𝑎𝑅𝑅𝑅𝑅 of first 𝕤𝕤𝕤𝕤; elements from (line 16) and (line processed elements ( jobs) are removed from Each element of the 𝑎𝑎𝑎𝑎𝑄𝑄𝑄𝑄𝑠𝑠𝑠𝑠𝑠𝑠𝑠𝑠𝑠𝑠𝑠𝑠𝑠𝑠𝑠𝑠 contains fragelementsway listX as well. Since we use the 𝑎𝑎𝑎𝑎𝑎𝑎𝑎𝑎𝑎𝑎𝑎𝑎𝑎𝑎𝑎𝑎𝑎𝑎𝑎𝑎𝑎𝑎𝑎𝑎 list as 17) using function head. Based on thelist metadata, R and listA R being lists priority queue while elements ( jobs) to pulled un- out from being lists as well.mentation Since we use asfirst element a priority queue,list the representsfor the job with the highest priority that will be relating next to be and𝑎𝑎𝑎𝑎𝑎𝑎𝑎𝑎𝑎𝑎𝑎𝑎𝑎𝑎𝑎𝑎𝑎𝑎𝑎𝑎𝑎𝑎𝑎𝑎 aggregate calculation is performed priority that will relations be next the torbe pulled out from queue (line 15) processed. jobofmay a comparison on a number (that number is determined processed comparisons remainofinlevels the list. Differences (line 18) and s and (line 19). The One result the include n a number of levels (that number is determined listX elements). Thus, the next step is to pull first elements from 𝑎𝑎𝑎𝑎 𝑎𝑎𝑎𝑎 𝑎𝑎𝑎𝑎 𝑎𝑎𝑎𝑎𝑎𝑎𝑎𝑎 (line 16) andto𝑎𝑎𝑎𝑎𝑎𝑎𝑎𝑎𝑎𝑎𝑎𝑎𝑎𝑎𝑎𝑎𝒜𝒜𝒜𝒜𝑅𝑅𝑅𝑅 (line by the number of R t revealed between compared data sets are added 𝑅𝑅𝑅𝑅 r Compute Agregates algorithm (Algorithm 2) is a set of lements from 𝑎𝑎𝑎𝑎𝑎𝑎𝑎𝑎𝑎𝑎𝑎𝑎𝑎𝑎𝑎𝑎𝑎𝑎𝑎𝑎𝑅𝑅𝑅𝑅 (line17) 16)using and 𝑎𝑎𝑎𝑎𝑎𝑎𝑎𝑎function 𝑎𝑎𝑎𝑎𝑎𝑎𝑎𝑎𝒜𝒜𝒜𝒜𝑅𝑅𝑅𝑅 (line head. Based on the metadata, fragmentation and aggregate calculation is performed for relations 𝑟𝑟𝑟𝑟 the priority queue as new jobs for further inspections. tuples whose schema is determined by the attributes gregate calculation is performed for relations 𝑟𝑟𝑟𝑟19). The result of the Compute Agregates (line 18) and 𝑠𝑠𝑠𝑠 (line algorithm (Algorithm 2) is a set of tuples whose schema It is evident that this algorithm can generate children contained in fragmentation set and aggregation set. m (Algorithm 2) is a set ofistuples whose schema determined by the attributes contained in fragmentation set and aggregation set. The resulting sets of tuples 𝑞𝑞𝑞𝑞𝑟𝑟𝑟𝑟 and jobs – each tuple t generates a new job. r resulting sets of tuples and qs are being comregation set. The The resulting tuples 𝑞𝑞𝑞𝑞𝑟𝑟𝑟𝑟 and qr (lines areofbeing compared 20 through 25) to find differences. Each tuple difference is added to the resulting list 𝑞𝑞𝑞𝑞𝑠𝑠𝑠𝑠sets Compute Agregates algorithm constructs an SQL (lines 20(lines through 25) to 25). find Instantly differences. Each jobThe h tuple differencepared is added to the resulting list report 21, 23 and processed will be removed from the list cQueue (lines 26 and 27). This way statement similar to the statements from Table 2. tuple difference iselements added to(jobs) the resulting list report rom the list cQueue (lines 26 and 27). This way processed are removed from the priority queue while elements (jobs) relating to unprocessed while elements (jobs) relating to unprocessed comparisons remain in the list. Differences 𝑡𝑡𝑡𝑡𝑟𝑟𝑟𝑟 revealed between compared data sets are added to the priority queue as ared data sets are added tonew the jobs priority queue asinspections. It is evident that this algorithm can generate children jobs – each tuple 𝑡𝑡𝑡𝑡 generates for further 𝑟𝑟𝑟𝑟 Algorithm 2: Compute Aggregates generates enerate children jobs – each tuple 𝑡𝑡𝑡𝑡 𝑟𝑟𝑟𝑟 a new job. (�, �, �, �) 1 Input: // r is an relation or relational algebra expression algorithm 2 The Compute Agregates Output: ��� �� ������ constructs an SQL statement similar to the statements from Table 2. ar to the statements from 2. 3 TableBegin 4 ������������ fromAggregates � and list of aggregate functions from � , renamed accordingly Algorithm 2:←attributes Compute 5 1 ���������� ← r (𝑟𝑟𝑟𝑟, 𝑋𝑋𝑋𝑋, 𝒜𝒜𝒜𝒜, 𝑡𝑡𝑡𝑡) Input: // r is an relation or relational algebra expression n or relational algebra6 expression if � Output is empty: tuple 𝑠𝑠𝑠𝑠𝑎𝑎𝑎𝑎𝑎𝑎𝑎𝑎 𝑑𝑑𝑑𝑑𝑑𝑑𝑑𝑑 𝑡𝑡𝑡𝑡𝑠𝑠𝑠𝑠𝑠𝑠𝑠𝑠𝑠𝑠𝑠𝑠𝑠𝑠𝑠𝑠𝑠𝑠𝑠𝑠 2 7 �������������� ←true 3 Begin 8 else 4 𝑎𝑎𝑎𝑎𝑎𝑎𝑎𝑎𝑎𝑎𝑎𝑎𝑎𝑎𝑎𝑎𝑎𝑎𝑎𝑎of 𝑎𝑎𝑎𝑎𝑠𝑠𝑠𝑠𝑠𝑠𝑠𝑠𝑎𝑎𝑎𝑎 9 T←𝑠𝑠𝑠𝑠𝑎𝑎𝑎𝑎𝑎𝑎𝑎𝑎 schema tuple←�attributes from 𝑋𝑋𝑋𝑋 and list of aggregate functions from 𝒜𝒜𝒜𝒜 , renamed accordingly unctions from 𝒜𝒜𝒜𝒜 , renamed accordingly 5 𝑓𝑓𝑓𝑓𝑟𝑟𝑟𝑟𝑟𝑟𝑟𝑟𝑟𝑟𝑟𝑟𝑟𝑟𝑟𝑟𝑟𝑟𝑟𝑟𝑟𝑟𝑟𝑟𝑟𝑟𝑟𝑟𝑟𝑟𝑟𝑟𝑟𝑟𝑟𝑟 ← �r � �� A � t[A] 10 �������������� ← if 𝑡𝑡𝑡𝑡 is empty 11 6 ����������� ← listtuple of attributes from X 𝑎𝑎𝑎𝑎𝑎𝑎𝑎𝑎𝑎𝑎𝑎𝑎 𝑎𝑎𝑎𝑎 ������������ ←true 12 7 execute𝑤𝑤𝑤𝑤ℎ𝑎𝑎𝑎𝑎𝑎𝑎𝑎𝑎𝑎𝑎𝑎𝑎𝑎𝑎𝑎𝑎𝑎𝑎𝑎𝑎𝑎𝑎𝑎𝑎𝑎𝑎𝑎𝑎𝑎𝑎𝑎𝑎 sql statement for , ����������, ��������������, ����������� else 13 8 return resulting tuples 14 9 End T← schema of tuple 𝑡𝑡𝑡𝑡 10 𝑤𝑤𝑤𝑤ℎ𝑎𝑎𝑎𝑎𝑎𝑎𝑎𝑎𝑎𝑎𝑎𝑎𝑎𝑎𝑎𝑎𝑎𝑎𝑎𝑎𝑎𝑎𝑎𝑎𝑎𝑎𝑎𝑎𝑎𝑎𝑎𝑎𝑎𝑎𝑎𝑎𝑎𝑎𝑎𝑎𝑎𝑎𝑎𝑎𝑎𝑎𝑎𝑎 ← 𝐴𝐴𝐴𝐴 ∈ 𝑇𝑇𝑇𝑇⋀ A = t[A] 11 𝑎𝑎𝑎𝑎𝑎𝑎𝑎𝑎𝑎𝑎𝑎𝑎𝑎𝑎𝑎𝑎𝑎𝑎𝑎𝑎𝑎𝑎𝑎𝑎𝑎𝑎𝑎𝑎𝑎𝑎𝑎𝑎𝑎𝑎𝑎𝑎𝑎𝑎𝑎𝑎𝑎𝑎𝑎𝑎 ← list of attributes from X 12 𝑠𝑠𝑠𝑠𝑎𝑎𝑎𝑎𝑎𝑎𝑎𝑎the 𝑎𝑎𝑎𝑎𝑎𝑎𝑎𝑎𝑎𝑎𝑎𝑎𝑎𝑎𝑎𝑎𝑎𝑎𝑎𝑎 𝑓𝑓𝑓𝑓𝑟𝑟𝑟𝑟𝑟𝑟𝑟𝑟𝑟𝑟𝑟𝑟𝑟𝑟𝑟𝑟𝑟𝑟𝑟𝑟𝑟𝑟𝑟𝑟𝑟𝑟𝑟𝑟𝑟𝑟𝑟𝑟𝑟𝑟𝑟𝑟 , 𝑤𝑤𝑤𝑤ℎ𝑎𝑎𝑎𝑎𝑎𝑎𝑎𝑎𝑎𝑎𝑎𝑎𝑎𝑎𝑎𝑎𝑎𝑎𝑎𝑎𝑎𝑎𝑎𝑎𝑎𝑎𝑎𝑎𝑎𝑎𝑎𝑎 𝑎𝑎𝑎𝑎𝑎𝑎𝑎𝑎𝑎𝑎𝑎𝑎𝑎𝑎𝑎𝑎the , 𝑎𝑎𝑎𝑎𝑎𝑎𝑎𝑎𝑎𝑎𝑎𝑎𝑎𝑎𝑎𝑎𝑎𝑎𝑎𝑎𝑎𝑎𝑎𝑎𝑎𝑎𝑎𝑎 𝑎𝑎𝑎𝑎𝑎𝑎𝑎𝑎𝑎𝑎𝑎𝑎𝑎𝑎𝑎𝑎will SELECT clauseexecute containssql allstatement attributes for from X 𝑎𝑎𝑎𝑎𝑠𝑠𝑠𝑠𝑠𝑠𝑠𝑠𝑎𝑎𝑎𝑎 2 ,Depth: if there are no errors, algorithm 𝑤𝑤𝑤𝑤ℎ𝑎𝑎𝑎𝑎𝑎𝑎𝑎𝑎𝑎𝑎𝑎𝑎𝑎𝑎𝑎𝑎𝑎𝑎𝑎𝑎𝑎𝑎𝑎𝑎𝑎𝑎𝑎𝑎𝑎𝑎𝑎𝑎𝑎𝑎𝑎𝑎𝑎𝑎𝑎𝑎𝑎𝑎𝑎𝑎𝑎𝑎𝑎𝑎 ,The 𝑎𝑎𝑎𝑎𝑎𝑎𝑎𝑎𝑎𝑎𝑎𝑎𝑎𝑎𝑎𝑎𝑎𝑎𝑎𝑎𝑎𝑎𝑎𝑎𝑎𝑎𝑎𝑎 𝑎𝑎𝑎𝑎𝑎𝑎𝑎𝑎𝑎𝑎𝑎𝑎𝑎𝑎𝑎𝑎 return resulting tuples consider job depth (level) and thus uniformly list, and a13list of aggregate functions with accompa14 end.associated names (line 4). The spread the execution over all tables (compare jobs nying arguments and with depth 1 for all tables, then jobs with depth 2 WHERE part contains specific conditions, but only when for input tuple t is not an empty tuple. It is not empty when The SELECT clause contains all attributes from the X all list,tables, and aetc.). list of aggregate functions with accompanying st of aggregate functions with accompanying difference between compared tables is detected and arguments and associated names (line 4). The WHERE part contains specific conditions, buteach onlytable. whenTainput tuple t is 3 Priority: users can set priority for ecific conditions, but only when input tuple t is not an empty tuple. It is not empty when difference between compared tables is detected and further fragmentation is further fragmentation is done in order to find more debles with higher priority are inspected sooner d tables is detected and further fragmentation is done in order to find more detailed information. The join conditions (lines 9 and 10) are being built according to the tailed information. The join conditions (lines 9 and 10) within the same (error) depth. lines 9 and 10) are being built according to the . The outputfor of the metadata from mentioned repositoryfrom whichmentakes into account the attributes in Xtwo being built to the metadata X. The output ofaccording the algorithm utes contained inare Seek depths: algorithmcontained considers depths a algorithm is a relationwhich – a settakes of tuples with a known schemasingle (line 2). tioned repository into account the attrijob (comparison) that are defined and stored in Forbethe sake clarity, some implementation omittedrepository: in the pseudo-code. They will be described in the butes will contained in X.of The output of the algorithm is adetails he pseudo-code. They described in the the are metadata remainder of this section. relation – a set of tuples with a known schema (line 2). 1 Full depth is implicitly defined with the number of order: execution (tree, e.g., Figure 2) is defined by the ordering of jobs. Jobs are ordered according to three ing of jobs. Jobs For are ordered according to some three path the Job sake of clarity, implementation details levels (and according attribute sets) defined in the parameters, the following They order:will be deare omitted in theinpseudo-code. metadata. Full depth is used only when an error has ch errors are spotted. depth, branches in which errors are spotted. scribed in1.theError remainder ofthe thisalgorithm section. will first pursue thebeen pursued. depth (level) and thus uniformly spread the are no errors, the algorithm will consider job depth (level) and thus uniformly spread the 2. Depth: if there order: execution path (tree, e.g., Figure 2) is de- 2 Healthy job depth: the other, smaller depth, is s, then jobs with Job depth 2 for all tables, etc.). execution over all tables (compare jobs with depth 1 for all tables, then jobs with depth 2 for all tables, etc.). fined by the ordering of jobs. arepriority ordered defined forhigher the jobs where errors were r priority are inspected sooner within theusers sameJobs 3. Priority: can set foraccordeach table. Tables with priority areno inspected soonerfound within the same ing to three parameters, in the following order: (“healthy jobs”). (error) depth. omparison) that 1 areError defined and stored in algorithm the depth, the algorithm willconsiders first pursue two job depths allows us tothat findare precise differing Seek depths: two the depthsDefining for a single (comparison) defined and stored in the branches in which errors are spotted. rows, while abandoning the search sooner for tables metadata repository: ccording attribute sets) defined in thedepth metadata. 1. Full is implicitly defined with the number of levels (and according attribute sets) defined in the metadata. Full depth is used only when an error has been pursued. bs where no errors were found jobs”). 2. (“healthy Healthy job depth: the other, smaller depth, is defined for the jobs where no errors were found (“healthy jobs”).
9
16
Information Technology and Control
which show no differences in the early part of the algorithm. Comparing huge tables with no differences all the way to the primary key would be too slow and inefficient. Figure 2 shows the fragmentation of the yearEnroll table that pertains to the year enrolment process at a HEI (High(er) Education Institution): a student (stu‐ dent_id) enrolls in a year of study (yearOfStudy) in an academic year (acdmYear). The left-hand side shows a yearEnroll table in the source system, and the righthand side shows its copy – yearEnroll table in the staging area. The primary key is KyearEnroll= {HEI_id, acdm‐ Year, yearOfStudy, student_id}. At the first level, the fragmentation is carried out according to HEI_id, then by acdmYear and so forth. For the sake of simplicity, we show only the count aggregate function in green Figure 2 A tree representation of TCFC algorithm’s execution
2018/1/47
colour (on the left side) and in green and red (where they differ) on the right side. Healthy job depth is set to the second level. Had there been no errors, the comparison would have been carried out and stopped on {HEI_id, acdmYear} fragment/depth. In this example though, the difference in counts is found at the first level, for the HEI1 (109). Following on that, the algorithm focuses on the HEI1 and continues to fragment that branch. At the second level, the difference is narrowed to (HE1, 09/10), then to the (HE1, 09/10, 1st), and, finally, the exact tuples are found. The algorithm steps (ordered path) are denoted with numbers in circles. Note that, in accordance with the job ordering strategy described above, the algorithm primarily explores the erroneous branches.
Information Technology and Control
The algorithm will not further explore healthy branches if it finds an erroneous branch. Healthy children jobs are loaded only if there are no errors. This means that algorithm will not further explore branch (HEI1, 10/11) in Figure 2. This behaviour could be easily modified by loading the healthy branches into the queue with the lowest priority (to be executed last, if there is any time left). However, this would be suboptimal, since there could be a great number of healthy branches. Imagine we have additional 50 years (besides 2009 and 2010) in Figure 2 – this would spawn another 50 queries. In general, it would be better to execute one larger query (with all 51 years) and then ignore the already processed erroneous branches. This functionality implies a more significant change to the algorithm and is not presented here. Another feature of the algorithm that was omitted from the formal description is the ability to reuse the results from the previous run. If we accept the assumption that most of the errors between two ETL refresh cycles remain the same, especially when incremental loading of DW is employed, it is prudent to store results in the metadata repository and examine them first in the next run. These “narrow” queries are much faster than queries at the ground levels that are targeting the whole table. The results of those queries can be used to prune the execution tree as soon as the difference is accounted for. For instance, say we add one row to the (HEI3, 10/11, 5th) branch and run the algorithm again: what were steps 1 and 4 would now be carried out in the first step at level one. But the difference is now in fragments HEI1 and HEI3. The difference (one row) found in the leaf job (HEI1, 09/10, 1st) would account for the HE1 branch and it would be pruned. The algorithm would continue to drill down on HEI3 branch only, to find the newly added difference. In general: a branch can be pruned if there is a leaf job with matching prefix fragment values ((HEI1) matches (HEI1, 09/10, 1st)) and error counts. This feature of the TCFC algorithm gives the ability to benefit from previous runs (learn from the data, in a way) and drastically reduce the execution time. Note that, this way, it is possible to refine search results after being interrupted (because of the limited time) – a job that was interrupted today might finish tomorrow, or the day after. This feature was not included in the comparison with the reference implementation in Section 3.1. because it would give us an unfair advantage.
2018/1/47
3.4. Fragmentation Strategy Recommendations For any non-trivial table, a number of fragmentation paths is huge. For instance, for just four possible fragmentation attributes (e.g., Figure 2) there are 148 different fragmenting strategies: 1 for zero level (no grouping), 14 one level strategies, 49 two level strategies, 60 three level and 24 four level strategies. Based on our experience, we provide the following recommendations: _ _ Fragmentation strategy should be determined with the help of a domain expert – a person who has a good knowledge of the data semantics and business processes. _ _ Healthy job depth should be set for all relations,
except for low-cardinality relations where only one level should be used, i.e. where primary key is used at the first level.
_ _ Higher fragmentation levels must not include
attributes that are functionally dependent on the attributes from lower fragmentation levels.
_ _ The number of tuples in children fragments should
be for at least an order of magnitude less than the number of tuples in the parenting fragment. This is particularly important for the first fragmentation level – this is where a huge table is reduced to N smaller “tables” (fragments). Hopefully, if the data are relatively uniformly distributed over the first fragmentation attribute set (usually, data are uniformly distributed at least over the time attribute), then the number of tuples can be reduced by the chosen order of magnitude by creating tens or hundreds of fragments. On the other hand, the number of fragments should not be too big because this would facilitate error scattering over different fragments. The best-case scenario is if all the errors are in the same fragment, so that a single branch is pursued.
_ _ The total number of fragmentation levels should
not be too big or too small. Based on tests conducted in this paper, for the relations of 100 million tuples, we consider two to four to be the optimal number of levels.
_ _ If possible, build a composite index on the
corresponding attributes of the last level of fragmentation.
17
18
Information Technology and Control
In the case where DBMS keeps accurate statistics on the row count of tables, it is suitable to start comparing data sets with empty fragmentation set (at first level) with just one aggregate function – COUNT, since the result of the SELECT COUNT(attributeName) will be instantaneous. If statistics are not kept, such a statement would cause a full table scan and then it is better to perform the fragmentation with nonempty fragmentation set and multiple aggregate functions.
3.5. Algorithm Evaluation The TCFC algorithm was tested in terms of speed and accuracy. It is implemented in C# programming language. Testing was executed on a PC with Intel ® Core ™ i7-4770 CPU processor with 16 GB of RAM and Microsoft Windows 8 operating system. For database servers, two virtual machines with equal configurations were used, namely, Intel ® Xeon ® processor E7540 (2.00 GHz clock speed), 8 GB of RAM, Windows Server Standard operating system and SQL Server 2014
2018/1/47
DBMS (with auto update statistic option). Testing was carried out on data sets with cardinality between 50 million and 400 million tuples which we consider comparable to cardinality in a real-world data warehousing systems (at least for the incremental daily load) and for variable number of the differences between compared data sets. Figure 3 shows schemas of two data sets from different domains used for algorithm evaluation: a Real world data from the field of higher educa-
tion [25] (relation exam in Figure 3(a)) that was extrapolated (from initial 10 million) to relations exam100M, exam200M and exam400M with 100, 200 and 400 million tuples i.e. 8GB, 15GB and 30GB data, respectively.
b Well-known TPC Benchmark ™ H (TPC-H) pro-
grammatically generated data set [37] (relations orders and lineItem in Figure 3(b), containing 50 and 180 million tuples, i.e. 5GB and 25GB data, respectively).
Figure 3 Schemas of data sets used for algorithm evaluation
exam exam exam_date exam_date student_id student_id course_id course_id has_passed has_passed … … (a) HEIS data set, 100M-400M rows (a) HEIS data100M-400M set, 100M-400M (a) HEIS data set, rows rows
lineItem orders lineItem orders lineNumber orderKey lineNumber orderKey orderKey customerKey orderKey customerKey partKey partKey orderDate orderDate suppKey suppKey totalPrice quantity totalPrice quantity … … … … (b) TCP-H data set, 50M and 180M rows (b)(b)TCP-H TCP-Hdata dataset, set,50M 50Mand and180M 180Mrows rows
Figure 3 Schemas of data sets used for algorithm evaluation Figure 3 Schemas of data sets used for algorithm evaluation
Primary keys are are as follows: Primary asfollows: follows: Primary keys keys are as
the rest of the paper. In this experiment, we have deliber-
����� = {����������� ���������� ���������} ately used the same DBMS on both servers, because SQL ����� = {����������� ���������� ���������} ������� = {��������} Server provides the execution of queries involving tables {��������} ������� = ��������� = {��������� �������� �������}, stored on remote servers (via the linked server feature). {��������� ��������� = �������� �������}, where pArtKey is the article key. The SQL statement used to find the differences between where pArtKey is the article key. TCFC’s speed is compared to the execution speed of the referent SELECT statements, shown below whose execution where pArtKey the article key. theSELECT two instances of exam100M tables (and analogous TCFC’s speed isiscompared to the execution speed of the referent statements, shown below whose execution time is referred to as referent execution time in the rest of the paper. In this experiment, we have deliberately used the time is referred to as referenttoexecution time inspeed the rest of the paper. In this experiment, we have deliberately used the TCFC’s speed is compared the execution of the used for the tables remaining same DBMS on both servers, because SQL Server provides thestatements execution ofwere queries involving storedexam*M on remotetable same DBMS on both servers, because SQL Server provides thepairs) execution of queries involving tables stored on remote referent SELECT statements, shown below whose exis shown below. To connect to the stagingofarea servers (via the linked server feature). The SQL statement used to find the differences between the two instances servers time (via the linked server The SQL statement used to find the differences between the two instances of ecution is referred to asfeature). referent execution exam100M tables (and analogous statements weretime usedinfor the exam*M pairs) is shown below. To weremaining used linked servertable named “SASrv.ZPR.FER.HR”: exam100M tables (and analogous statements were used for the remaining exam*M table pairs) is shown below. To connect to the staging area we used linked server named “SASrv.ZPR.FER.HR”: connect to the staging area we used linked server named “SASrv.ZPR.FER.HR”: SELECT SELECT FROM FROM FULL FULL ON ON AND AND AND AND WHERE WHERE OR OR --
* *HEISsrc.dbo.exam100M src HEISsrc.dbo.exam100M src OUTER JOIN [SASrv.ZPR.FER.HR].HEISsa.dbo.exam100M dest OUTER JOIN [SASrv.ZPR.FER.HR].HEISsa.dbo.exam100M dest src.student_id = dest.student_id src.student_id dest.student_id src.course_id == dest.course_id src.course_id src.exam_date == dest.course_id dest.exam_date src.exam_date dest.exam_date src.student_id= IS NULL src.student_id dest.student_idISISNULL NULL dest.student_id IS OR (dest.NonKeyAttrib NULL src.NonKeyAttrib) , for each remaining Non-Key attribute
Information Technology and Control
2018/1/47
19
SELECT * FROM HEISsrc.dbo.exam100M src
FULL OUTER JOIN [SASrv.ZPR.FER.HR].HEISsa.dbo.exam100M dest ON src.student_id = dest.student_id
AND src.course_id = dest.course_id AND src.exam_date = dest.exam_date
WHERE src.student_id IS NULL
OR dest.student_id IS NULL
-- OR (dest.NonKeyAttrib src.NonKeyAttrib) , for each remaining Non-Key attribute
Similar statements were used to compare orders and lineItem pairs: SELECT *
FROM TPCHsrc.dbo.lineitem src
SELECT *
FULL OUTER JOIN
FROM TPCHsrc.dbo.orders src
[SASrv.ZPR.FER.HR].TPCHsa.dbo.lineitem dest
FULL OUTER JOIN
ON src.orderKey = dest.orderKey
[SASrv.ZPR.FER.HR].TPCHsa.dbo.orders dest
AND src.partKey
ON src.orderKey = dest.orderKey
WHERE src.orderKey IS NULL
OR dest.orderKey IS NULL
-- OR (dest.NonKeyAttrib -- src.NonKeyAttrib) , for each remaining --
Non-Key attribute
AND src.suppKey
WHERE src.orderKey
The fragmentation presented in Table 1 was used. The last fragmentation level for each relation includes all primary key attributes and consequently the comparison will pinpoint the exact missing/ excess tuples. Differences between the tables were generated by deleting tuples from the source table. Both, number and dispersion on differences across fragments were varied, since error dispersion significantly affects the performance. For instance, if a pair of exam100M relations differs in 1‰, i.e., 100.000 tuples, in the worst case, at the last level, an equal number of queries would be generated (though it is very unlikely errors would align with the fragmentation set in such way at the penultimate level) and in the best case a single query would detect all
= dest.suppKey IS NULL
OR dest.orderKey IS NULL
-- OR (dest.NonKeyAttrib -- src.NonKeyAttrib) , for each remaining --
For the sake of brevity, the above SQL statements do not list all OR statements that check the potential differences in non-key attributes; that part is represented as a comment.
= dest.partKey
Non-Key attribute
same fragment.same Dispersion wasDispersion varied using 20%, 50% and 20%, 100%50% disper fragment. was varied using an same fragment. Dispersion was using 20%, and 100% disper differences are scattered in are 20% ofvaried the total fragments in the penultimate fra differences scattered in 20% of the50% total fragments in the differences are scattered in 20% the total fragments in the fra same Dispersion was of varied using 20%, 50% andpenultimate 100% disper Table 1 fragment. same fragment. Dispersion was varied using 20%, 50% and 100% dispersion. same fragment. Dispersion was varied using 20%, 50% andpenultimate 100% dispers differences arefragmentation scattered in 20% of the total fragments in the fra HEIS and TPC-H strategy differences are scattered in 20% of the total fragments in the penultimate fragme Table 2 HEISDispersion andTable TPC-H fragmentation strategy 2 HEIS and TPC-H fragmentation samedifferences fragment. was varied using 20%, 50%strategy and 100% dispersion. scattered in 20% of the total fragments in the penultimate fra same fragment. are Dispersion was varied using 20%, 50% and 100% dispersion. Table 2are HEIS and TPC-H fragmentation strategy differences scattered in 20% of the total fragments in the penultimate fragmen differences are scattered in 20% of the total fragments in the penultimate fragme
Table 2 HEIS and strategy 𝑟𝑟𝑟𝑟 𝑋𝑋𝑋𝑋, 𝒜𝒜𝒜𝒜 𝑎𝑎𝑎𝑎𝑎𝑎𝑎𝑎𝑎𝑎𝑎𝑎𝑅𝑅𝑅𝑅fragmentation 𝑟𝑟𝑟𝑟,𝑎𝑎𝑎𝑎𝑎𝑎𝑎𝑎fragmentation 𝑋𝑋𝑋𝑋, 𝒜𝒜𝒜𝒜𝑅𝑅𝑅𝑅,𝑋𝑋𝑋𝑋strategy ,𝑎𝑎𝑎𝑎𝑎𝑎𝑎𝑎𝑎𝑎𝑎𝑎𝑎𝑎𝑎𝑎𝑎𝑎𝑎𝑎 𝑅𝑅𝑅𝑅,𝑋𝑋𝑋𝑋TPC-H 𝑅𝑅𝑅𝑅 Table 2 HEIS and TPC-H Table TPC-H strategy 𝑟𝑟𝑟𝑟 2 HEIS 𝑋𝑋𝑋𝑋, and 𝒜𝒜𝒜𝒜𝑅𝑅𝑅𝑅,𝑋𝑋𝑋𝑋 ,𝑎𝑎𝑎𝑎𝑎𝑎𝑎𝑎𝑎𝑎𝑎𝑎𝑎𝑎𝑎𝑎𝑎𝑎𝑎𝑎fragmentation 𝑅𝑅𝑅𝑅 𝑋𝑋𝑋𝑋 TPC-H = {𝑠𝑠𝑠𝑠𝑡𝑡𝑡𝑡𝑠𝑠𝑠𝑠𝑑𝑑𝑑𝑑𝑑𝑑𝑑𝑑𝑑𝑑𝑑𝑑𝑑𝑑𝑑𝑑_𝑖𝑖𝑖𝑖 𝑑𝑑𝑑𝑑𝑋𝑋𝑋𝑋, 𝑎𝑎𝑎𝑎𝑎𝑎𝑎𝑎𝑎𝑎𝑎𝑎𝑎𝑎𝑎𝑎𝑎𝑎𝑎𝑎𝑎𝑎𝑎𝑎_𝑖𝑖𝑖𝑖 𝑑𝑑𝑑𝑑 , 𝑎𝑎𝑎𝑎𝑒𝑒𝑒𝑒𝑎𝑎𝑎𝑎𝑎𝑎𝑎𝑎_𝑑𝑑𝑑𝑑𝑎𝑎𝑎𝑎𝑎𝑎𝑎𝑎𝑎𝑎𝑎𝑎} = {𝑠𝑠𝑠𝑠𝑡𝑡𝑡𝑡𝑠𝑠𝑠𝑠𝑑𝑑𝑑𝑑𝑑𝑑𝑑𝑑𝑑𝑑𝑑𝑑𝑑𝑑𝑑𝑑_𝑖𝑖𝑖𝑖 𝑑𝑑𝑑𝑑 , 𝑎𝑎𝑎𝑎𝑎𝑎𝑎𝑎𝑎𝑎𝑎𝑎𝑎𝑎𝑎𝑎𝑎𝑎𝑎𝑎𝑎𝑎𝑎𝑎_𝑖𝑖𝑖𝑖𝑑𝑑𝑑𝑑 , 𝑎𝑎𝑎𝑎𝑒𝑒𝑒𝑒𝑎𝑎𝑎𝑎𝑎𝑎𝑎𝑎_𝑑𝑑𝑑𝑑𝑎𝑎𝑎𝑎𝑎𝑎𝑎𝑎𝑎𝑎𝑎𝑎} Table 2𝑎𝑎𝑎𝑎𝑒𝑒𝑒𝑒𝑎𝑎𝑎𝑎𝑎𝑎𝑎𝑎 HEIS and fragmentation strategy 𝑎𝑎𝑎𝑎𝑒𝑒𝑒𝑒𝑎𝑎𝑎𝑎𝑎𝑎𝑎𝑎 𝒜𝒜𝒜𝒜𝑅𝑅𝑅𝑅,𝑋𝑋𝑋𝑋 ,𝑎𝑎𝑎𝑎𝑎𝑎𝑎𝑎fragmentation 𝑎𝑎𝑎𝑎𝑎𝑎𝑎𝑎𝑎𝑎𝑎𝑎𝑅𝑅𝑅𝑅 Table 2𝑟𝑟𝑟𝑟HEIS and𝑋𝑋𝑋𝑋,TPC-H strategy 𝑋𝑋𝑋𝑋 = 𝑑𝑑𝑑𝑑𝒜𝒜𝒜𝒜 ,ℎ𝑎𝑎𝑎𝑎𝑠𝑠𝑠𝑠_𝑎𝑎𝑎𝑎𝑎𝑎𝑎𝑎𝑎𝑎𝑎𝑎𝑎𝑎𝑎𝑎𝑎𝑎𝑎𝑎𝑎𝑎𝑎𝑎, 𝑎𝑎𝑎𝑎𝑎𝑎𝑎𝑎𝑎𝑎𝑎𝑎𝑎𝑎𝑎𝑎𝑎𝑎𝑎𝑎𝑎𝑎𝑎𝑎_𝑖𝑖𝑖𝑖 𝑑𝑑𝑑𝑑 , 𝑎𝑎𝑎𝑎𝑒𝑒𝑒𝑒𝑎𝑎𝑎𝑎𝑎𝑎𝑎𝑎_𝑑𝑑𝑑𝑑𝑎𝑎𝑎𝑎𝑎𝑎𝑎𝑎𝑎𝑎𝑎𝑎} 𝑟𝑟𝑟𝑟 𝑋𝑋𝑋𝑋, 𝒜𝒜𝒜𝒜𝒜𝒜𝒜𝒜 ,𝑎𝑎𝑎𝑎𝑎𝑎𝑎𝑎{𝑠𝑠𝑠𝑠𝑡𝑡𝑡𝑡𝑠𝑠𝑠𝑠𝑑𝑑𝑑𝑑𝑑𝑑𝑑𝑑𝑑𝑑𝑑𝑑𝑑𝑑𝑑𝑑_𝑖𝑖𝑖𝑖 𝑎𝑎𝑎𝑎=𝑎𝑎𝑎𝑎𝑎𝑎𝑎𝑎{(𝑎𝑎𝑎𝑎𝑎𝑎𝑎𝑎𝑎𝑎𝑎𝑎𝑎𝑎𝑎𝑎𝑎𝑎𝑎𝑎, 𝑎𝑎𝑎𝑎𝑒𝑒𝑒𝑒𝑎𝑎𝑎𝑎𝑎𝑎𝑎𝑎 {(𝑎𝑎𝑎𝑎𝑎𝑎𝑎𝑎𝑎𝑎𝑎𝑎𝑎𝑎𝑎𝑎𝑎𝑎𝑎𝑎, 𝑅𝑅𝑅𝑅,𝑋𝑋𝑋𝑋 𝑅𝑅𝑅𝑅 𝑟𝑟𝑟𝑟𝑎𝑎𝑎𝑎𝑎𝑎𝑎𝑎𝑟𝑟𝑟𝑟𝑑𝑑𝑑𝑑𝑑𝑑𝑑𝑑𝑑𝑑𝑑𝑑𝑑𝑑𝑑𝑑)} = ℎ𝑎𝑎𝑎𝑎𝑠𝑠𝑠𝑠_𝑎𝑎𝑎𝑎𝑎𝑎𝑎𝑎𝑎𝑎𝑎𝑎𝑎𝑎𝑎𝑎𝑎𝑎𝑎𝑎𝑎𝑎𝑎𝑎, 𝑟𝑟𝑟𝑟𝑎𝑎𝑎𝑎𝑎𝑎𝑎𝑎𝑟𝑟𝑟𝑟𝑑𝑑𝑑𝑑𝑑𝑑𝑑𝑑𝑑𝑑𝑑𝑑𝑑𝑑𝑑𝑑)} 𝑅𝑅𝑅𝑅,𝑋𝑋𝑋𝑋 𝑅𝑅𝑅𝑅,𝑋𝑋𝑋𝑋 𝑟𝑟𝑟𝑟 𝑋𝑋𝑋𝑋, 𝒜𝒜𝒜𝒜𝑅𝑅𝑅𝑅,𝑋𝑋𝑋𝑋 ,𝑎𝑎𝑎𝑎𝑎𝑎𝑎𝑎𝑎𝑎𝑎𝑎𝑎𝑎𝑎𝑎𝑎𝑎𝑎𝑎𝑅𝑅𝑅𝑅 𝑋𝑋𝑋𝑋 = 𝑑𝑑𝑑𝑑 ,ℎ𝑎𝑎𝑎𝑎𝑠𝑠𝑠𝑠_𝑎𝑎𝑎𝑎𝑎𝑎𝑎𝑎𝑎𝑎𝑎𝑎𝑎𝑎𝑎𝑎𝑎𝑎𝑎𝑎𝑎𝑎𝑎𝑎, 𝑎𝑎𝑎𝑎𝑎𝑎𝑎𝑎𝑎𝑎𝑎𝑎𝑎𝑎𝑎𝑎𝑎𝑎𝑎𝑎𝑎𝑎𝑎𝑎_𝑖𝑖𝑖𝑖 𝑑𝑑𝑑𝑑 ,𝑑𝑑𝑑𝑑𝑎𝑎𝑎𝑎𝑒𝑒𝑒𝑒𝑎𝑎𝑎𝑎𝑎𝑎𝑎𝑎_𝑑𝑑𝑑𝑑𝑎𝑎𝑎𝑎𝑎𝑎𝑎𝑎𝑎𝑎𝑎𝑎} 𝑎𝑎𝑎𝑎𝑒𝑒𝑒𝑒𝑎𝑎𝑎𝑎𝑎𝑎𝑎𝑎 𝒜𝒜𝒜𝒜𝑅𝑅𝑅𝑅,𝑋𝑋𝑋𝑋 = {(𝑎𝑎𝑎𝑎𝑎𝑎𝑎𝑎𝑎𝑎𝑎𝑎𝑎𝑎𝑎𝑎𝑎𝑎𝑎𝑎, 𝑟𝑟𝑟𝑟 𝑋𝑋𝑋𝑋, 𝒜𝒜𝒜𝒜𝑅𝑅𝑅𝑅,𝑋𝑋𝑋𝑋 ,𝑎𝑎𝑎𝑎𝑎𝑎𝑎𝑎𝑎𝑎𝑎𝑎{𝑠𝑠𝑠𝑠𝑡𝑡𝑡𝑡𝑠𝑠𝑠𝑠𝑑𝑑𝑑𝑑𝑑𝑑𝑑𝑑𝑑𝑑𝑑𝑑𝑑𝑑𝑑𝑑_𝑖𝑖𝑖𝑖 𝑎𝑎𝑎𝑎𝑎𝑎𝑎𝑎 {𝑠𝑠𝑠𝑠𝑡𝑡𝑡𝑡𝑠𝑠𝑠𝑠 𝑑𝑑𝑑𝑑𝑑𝑑𝑑𝑑𝑑𝑑𝑑𝑑𝑑𝑑𝑑𝑑_𝑖𝑖𝑖𝑖 },𝑟𝑟𝑟𝑟𝑎𝑎𝑎𝑎𝑎𝑎𝑎𝑎𝑟𝑟𝑟𝑟𝑑𝑑𝑑𝑑𝑑𝑑𝑑𝑑𝑑𝑑𝑑𝑑𝑑𝑑𝑑𝑑)} {𝑠𝑠𝑠𝑠𝑡𝑡𝑡𝑡𝑠𝑠𝑠𝑠𝑑𝑑𝑑𝑑𝑑𝑑𝑑𝑑𝑑𝑑𝑑𝑑𝑑𝑑𝑑𝑑_𝑖𝑖𝑖𝑖𝑑𝑑𝑑𝑑 }, 𝑅𝑅𝑅𝑅 𝑑𝑑𝑑𝑑 , 𝑎𝑎𝑎𝑎𝑎𝑎𝑎𝑎𝑎𝑎𝑎𝑎𝑎𝑎𝑎𝑎𝑎𝑎𝑎𝑎𝑎𝑎𝑎𝑎_𝑖𝑖𝑖𝑖 {𝑠𝑠𝑠𝑠𝑡𝑡𝑡𝑡𝑠𝑠𝑠𝑠𝑑𝑑𝑑𝑑𝑑𝑑𝑑𝑑𝑑𝑑𝑑𝑑𝑑𝑑𝑑𝑑_𝑖𝑖𝑖𝑖 𝑋𝑋𝑋𝑋 = 𝑑𝑑𝑑𝑑 , 𝑎𝑎𝑎𝑎𝑒𝑒𝑒𝑒𝑎𝑎𝑎𝑎𝑎𝑎𝑎𝑎_𝑑𝑑𝑑𝑑𝑎𝑎𝑎𝑎𝑎𝑎𝑎𝑎𝑎𝑎𝑎𝑎} 𝑟𝑟𝑟𝑟𝑎𝑎𝑎𝑎𝑒𝑒𝑒𝑒𝑎𝑎𝑎𝑎𝑎𝑎𝑎𝑎 𝑋𝑋𝑋𝑋, 𝒜𝒜𝒜𝒜𝑋𝑋𝑋𝑋 ,𝑎𝑎𝑎𝑎 𝑎𝑎𝑎𝑎 𝑎𝑎𝑎𝑎 𝑎𝑎𝑎𝑎𝑎𝑎𝑎𝑎 𝑎𝑎𝑎𝑎𝑅𝑅𝑅𝑅,𝑋𝑋𝑋𝑋 𝑎𝑎𝑎𝑎𝑎𝑎𝑎𝑎𝑎𝑎𝑎𝑎𝑎𝑎𝑎𝑎𝑅𝑅𝑅𝑅{𝑠𝑠𝑠𝑠𝑡𝑡𝑡𝑡𝑠𝑠𝑠𝑠𝑑𝑑𝑑𝑑𝑑𝑑𝑑𝑑𝑑𝑑𝑑𝑑𝑑𝑑𝑑𝑑_𝑖𝑖𝑖𝑖 = � 𝑅𝑅𝑅𝑅 𝑎𝑎𝑎𝑎𝑎𝑎𝑎𝑎𝑎𝑎𝑎𝑎𝑅𝑅𝑅𝑅 = � 𝑑𝑑𝑑𝑑 , 𝑎𝑎𝑎𝑎𝑒𝑒𝑒𝑒𝑎𝑎𝑎𝑎𝑎𝑎𝑎𝑎_𝑑𝑑𝑑𝑑𝑎𝑎𝑎𝑎𝑎𝑎𝑎𝑎𝑎𝑎𝑎𝑎} � � 𝑑𝑑𝑑𝑑𝑎𝑎𝑎𝑎,𝑎𝑎𝑎𝑎𝑎𝑎𝑎𝑎𝑎𝑎𝑎𝑎𝑎𝑎𝑎𝑎𝑎𝑎𝑎𝑎𝑎𝑎𝑎𝑎𝑎𝑎𝑎𝑎_𝑖𝑖𝑖𝑖 𝑎𝑎𝑎𝑎𝑒𝑒𝑒𝑒𝑎𝑎𝑎𝑎𝑎𝑎𝑎𝑎 {𝑠𝑠𝑠𝑠𝑡𝑡𝑡𝑡𝑠𝑠𝑠𝑠𝑑𝑑𝑑𝑑𝑑𝑑𝑑𝑑𝑑𝑑𝑑𝑑𝑑𝑑𝑑𝑑_𝑖𝑖𝑖𝑖 𝑑𝑑𝑑𝑑{𝑠𝑠𝑠𝑠𝑡𝑡𝑡𝑡 , 𝑎𝑎𝑎𝑎𝑎𝑎𝑎𝑎𝑎𝑎𝑎𝑎𝑎𝑎𝑎𝑎𝑎𝑎𝑎𝑎𝑎𝑎𝑎𝑎_𝑖𝑖𝑖𝑖 , }, 𝑎𝑎𝑎𝑎𝑒𝑒𝑒𝑒𝑎𝑎𝑎𝑎𝑎𝑎𝑎𝑎_𝑑𝑑𝑑𝑑𝑎𝑎𝑎𝑎𝑎𝑎𝑎𝑎 𝑎𝑎𝑎𝑎} 𝒜𝒜𝒜𝒜= = {(𝑎𝑎𝑎𝑎𝑎𝑎𝑎𝑎𝑎𝑎𝑎𝑎𝑎𝑎𝑎𝑎𝑎𝑎𝑎𝑎, ℎ𝑎𝑎𝑎𝑎𝑠𝑠𝑠𝑠_𝑎𝑎𝑎𝑎𝑎𝑎𝑎𝑎𝑎𝑎𝑎𝑎𝑎𝑎𝑎𝑎𝑎𝑎𝑎𝑎𝑎𝑎𝑎𝑎, 𝑟𝑟𝑟𝑟𝑎𝑎𝑎𝑎𝑎𝑎𝑎𝑎𝑟𝑟𝑟𝑟𝑑𝑑𝑑𝑑𝑑𝑑𝑑𝑑𝑑𝑑𝑑𝑑𝑑𝑑𝑑𝑑)} {𝑠𝑠𝑠𝑠𝑡𝑡𝑡𝑡𝑠𝑠𝑠𝑠𝑑𝑑𝑑𝑑𝑑𝑑𝑑𝑑 𝑑𝑑𝑑𝑑𝑑𝑑𝑑𝑑𝑑𝑑𝑑𝑑𝑑𝑑𝑑𝑑_𝑖𝑖𝑖𝑖 𝑑𝑑𝑑𝑑 , 𝑎𝑎𝑎𝑎𝑎𝑎𝑎𝑎𝑎𝑎𝑎𝑎𝑎𝑎𝑎𝑎𝑎𝑎𝑎𝑎𝑎𝑎𝑎𝑎_𝑖𝑖𝑖𝑖 𝑑𝑑𝑑𝑑 , 𝑎𝑎𝑎𝑎𝑒𝑒𝑒𝑒𝑎𝑎𝑎𝑎𝑎𝑎𝑎𝑎_𝑑𝑑𝑑𝑑𝑎𝑎𝑎𝑎𝑎𝑎𝑎𝑎𝑎𝑎𝑎𝑎} 𝑠𝑠𝑠𝑠𝑑𝑑𝑑𝑑𝑑𝑑𝑑𝑑𝑑𝑑𝑑𝑑𝑑𝑑𝑑𝑑_𝑖𝑖𝑖𝑖 𝑅𝑅𝑅𝑅,𝑋𝑋𝑋𝑋 {𝑠𝑠𝑠𝑠𝑡𝑡𝑡𝑡𝑠𝑠𝑠𝑠𝑑𝑑𝑑𝑑𝑑𝑑𝑑𝑑𝑑𝑑𝑑𝑑𝑑𝑑𝑑𝑑_𝑖𝑖𝑖𝑖 𝑑𝑑𝑑𝑑 , 𝑎𝑎𝑎𝑎𝑎𝑎𝑎𝑎𝑎𝑎𝑎𝑎𝑎𝑎𝑎𝑎𝑎𝑎𝑎𝑎𝑎𝑎𝑎𝑎_𝑖𝑖𝑖𝑖 𝑑𝑑𝑑𝑑 , 𝑎𝑎𝑎𝑎𝑒𝑒𝑒𝑒𝑎𝑎𝑎𝑎𝑎𝑎𝑎𝑎_𝑑𝑑𝑑𝑑𝑎𝑎𝑎𝑎𝑎𝑎𝑎𝑎𝑎𝑎𝑎𝑎} {(𝑎𝑎𝑎𝑎𝑎𝑎𝑎𝑎𝑎𝑎𝑎𝑎𝑎𝑎𝑎𝑎𝑎𝑎𝑎𝑎, 𝒜𝒜𝒜𝒜= = ℎ𝑎𝑎𝑎𝑎𝑠𝑠𝑠𝑠_𝑎𝑎𝑎𝑎𝑎𝑎𝑎𝑎𝑎𝑎𝑎𝑎𝑎𝑎𝑎𝑎𝑎𝑎𝑎𝑎𝑎𝑎𝑎𝑎, 𝑟𝑟𝑟𝑟𝑎𝑎𝑎𝑎𝑎𝑎𝑎𝑎𝑟𝑟𝑟𝑟𝑑𝑑𝑑𝑑𝑑𝑑𝑑𝑑𝑑𝑑𝑑𝑑𝑑𝑑𝑑𝑑)} 𝑎𝑎𝑎𝑎 𝑎𝑎𝑎𝑎 𝑎𝑎𝑎𝑎 𝑎𝑎𝑎𝑎 𝑎𝑎𝑎𝑎 = � � 𝑎𝑎𝑎𝑎𝑒𝑒𝑒𝑒𝑎𝑎𝑎𝑎𝑎𝑎𝑎𝑎 𝑋𝑋𝑋𝑋 𝑅𝑅𝑅𝑅,𝑋𝑋𝑋𝑋 𝑑𝑑𝑑𝑑𝑠𝑠𝑠𝑠, 𝑎𝑎𝑎𝑎𝑎𝑎𝑎𝑎𝑎𝑎𝑎𝑎𝑎𝑎𝑎𝑎𝑎𝑎𝑎𝑎𝑎𝑎𝑎𝑎_𝑖𝑖𝑖𝑖 𝑑𝑑𝑑𝑑𝑠𝑠𝑠𝑠,𝑑𝑑𝑑𝑑𝑑𝑑𝑑𝑑𝑑𝑑𝑑𝑑𝑑𝑑𝑑𝑑_𝑖𝑖𝑖𝑖 𝑎𝑎𝑎𝑎𝑒𝑒𝑒𝑒𝑎𝑎𝑎𝑎𝑎𝑎𝑎𝑎_𝑑𝑑𝑑𝑑𝑎𝑎𝑎𝑎𝑎𝑎𝑎𝑎𝑎𝑎𝑎𝑎} {𝑠𝑠𝑠𝑠𝑡𝑡𝑡𝑡 𝑑𝑑𝑑𝑑𝑑𝑑𝑑𝑑𝑑𝑑𝑑𝑑𝑑𝑑𝑑𝑑_𝑖𝑖𝑖𝑖 𝑑𝑑𝑑𝑑{𝑠𝑠𝑠𝑠𝑡𝑡𝑡𝑡 , 𝑎𝑎𝑎𝑎𝑎𝑎𝑎𝑎𝑎𝑎𝑎𝑎𝑎𝑎𝑎𝑎𝑎𝑎𝑎𝑎𝑎𝑎𝑎𝑎_𝑖𝑖𝑖𝑖 𝑑𝑑𝑑𝑑𝑑𝑑𝑑𝑑,𝑟𝑟𝑟𝑟𝑎𝑎𝑎𝑎𝑎𝑎𝑎𝑎𝑟𝑟𝑟𝑟𝑑𝑑𝑑𝑑𝑑𝑑𝑑𝑑𝑑𝑑𝑑𝑑𝑑𝑑𝑑𝑑)} 𝑎𝑎𝑎𝑎𝑒𝑒𝑒𝑒𝑎𝑎𝑎𝑎𝑎𝑎𝑎𝑎_𝑑𝑑𝑑𝑑𝑎𝑎𝑎𝑎𝑎𝑎𝑎𝑎 𝑎𝑎𝑎𝑎 } 𝑎𝑎𝑎𝑎𝑒𝑒𝑒𝑒𝑎𝑎𝑎𝑎𝑎𝑎𝑎𝑎 𝑋𝑋𝑋𝑋 = {𝑠𝑠𝑠𝑠𝑡𝑡𝑡𝑡𝑠𝑠𝑠𝑠𝑑𝑑𝑑𝑑𝑑𝑑𝑑𝑑𝑑𝑑𝑑𝑑𝑑𝑑𝑑𝑑_𝑖𝑖𝑖𝑖 𝒜𝒜𝒜𝒜𝑅𝑅𝑅𝑅,𝑋𝑋𝑋𝑋𝑅𝑅𝑅𝑅= {(𝑎𝑎𝑎𝑎𝑎𝑎𝑎𝑎𝑎𝑎𝑎𝑎𝑎𝑎𝑎𝑎𝑎𝑎𝑎𝑎, ℎ𝑎𝑎𝑎𝑎𝑠𝑠𝑠𝑠_𝑎𝑎𝑎𝑎𝑎𝑎𝑎𝑎𝑎𝑎𝑎𝑎𝑎𝑎𝑎𝑎𝑎𝑎𝑎𝑎𝑎𝑎𝑎𝑎, }, {𝑎𝑎𝑎𝑎𝑎𝑎𝑎𝑎𝑎𝑎𝑎𝑎𝑎𝑎𝑎𝑎𝑎𝑎𝑎𝑎𝑎𝑎𝑎𝑎𝑎𝑎𝑎𝑎𝑎𝑎𝑎𝑎𝑎𝑎𝑎𝑎𝑎𝑎𝑎𝑎𝑎𝑎𝑎𝑎, {𝑎𝑎𝑎𝑎𝑎𝑎𝑎𝑎𝑎𝑎𝑎𝑎𝑎𝑎𝑎𝑎𝑎𝑎𝑎𝑎𝑎𝑎𝑎𝑎𝑎𝑎𝑎𝑎𝑎𝑎𝑎𝑎𝑎𝑎𝑎𝑎𝑎𝑎𝑎𝑎𝑎𝑎𝑎𝑎, = 𝑑𝑑𝑑𝑑𝑑𝑑𝑑𝑑𝑑𝑑𝑑𝑑𝑑𝑑𝑑𝑑𝑑𝑑𝑑𝑑𝑑𝑑𝑑𝑑𝑑𝑑𝑑𝑑𝑑𝑑𝑑𝑑} 𝑑𝑑𝑑𝑑𝑑𝑑𝑑𝑑𝑑𝑑𝑑𝑑𝑑𝑑𝑑𝑑𝑑𝑑𝑑𝑑𝑑𝑑𝑑𝑑𝑑𝑑𝑑𝑑𝑑𝑑𝑑𝑑} 𝑑𝑑𝑑𝑑𝑑𝑑𝑑𝑑𝑑𝑑𝑑𝑑𝑑𝑑𝑑𝑑𝑑𝑑𝑑𝑑𝑑𝑑𝑑𝑑 𝑎𝑎𝑎𝑎= 𝑎𝑎𝑎𝑎𝑎𝑎𝑎𝑎= 𝑎𝑎𝑎𝑎𝑎𝑎𝑎𝑎 � ℎ𝑎𝑎𝑎𝑎𝑠𝑠𝑠𝑠_𝑎𝑎𝑎𝑎𝑎𝑎𝑎𝑎𝑎𝑎𝑎𝑎𝑎𝑎𝑎𝑎𝑎𝑎𝑎𝑎𝑎𝑎𝑎𝑎, � {𝑠𝑠𝑠𝑠𝑡𝑡𝑡𝑡𝑋𝑋𝑋𝑋𝑠𝑠𝑠𝑠𝑑𝑑𝑑𝑑𝑑𝑑𝑑𝑑𝑑𝑑𝑑𝑑𝑑𝑑𝑑𝑑_𝑖𝑖𝑖𝑖 𝑑𝑑𝑑𝑑𝑟𝑟𝑟𝑟𝑎𝑎𝑎𝑎𝑎𝑎𝑎𝑎𝑟𝑟𝑟𝑟𝑑𝑑𝑑𝑑𝑑𝑑𝑑𝑑𝑑𝑑𝑑𝑑𝑑𝑑𝑑𝑑)} }, {(𝑎𝑎𝑎𝑎𝑎𝑎𝑎𝑎𝑎𝑎𝑎𝑎𝑎𝑎𝑎𝑎𝑎𝑎𝑎𝑎, 𝒜𝒜𝒜𝒜𝑅𝑅𝑅𝑅,𝑋𝑋𝑋𝑋 𝑋𝑋𝑋𝑋 𝑅𝑅𝑅𝑅 =𝑑𝑑𝑑𝑑𝑑𝑑𝑑𝑑𝑑𝑑𝑑𝑑𝑑𝑑𝑑𝑑𝑑𝑑𝑑𝑑𝑑𝑑𝑑𝑑 {𝑠𝑠𝑠𝑠𝑡𝑡𝑡𝑡𝑠𝑠𝑠𝑠ℎ𝑎𝑎𝑎𝑎𝑠𝑠𝑠𝑠_𝑎𝑎𝑎𝑎𝑎𝑎𝑎𝑎𝑎𝑎𝑎𝑎𝑎𝑎𝑎𝑎𝑎𝑎𝑎𝑎𝑎𝑎𝑎𝑎, 𝑑𝑑𝑑𝑑𝑑𝑑𝑑𝑑𝑑𝑑𝑑𝑑𝑑𝑑𝑑𝑑_𝑖𝑖𝑖𝑖𝑑𝑑𝑑𝑑{𝑠𝑠𝑠𝑠𝑡𝑡𝑡𝑡 , 𝑎𝑎𝑎𝑎𝑎𝑎𝑎𝑎𝑎𝑎𝑎𝑎𝑎𝑎𝑎𝑎𝑎𝑎𝑎𝑎𝑎𝑎𝑎𝑎_𝑖𝑖𝑖𝑖 , 𝑎𝑎𝑎𝑎𝑒𝑒𝑒𝑒𝑎𝑎𝑎𝑎𝑎𝑎𝑎𝑎_𝑑𝑑𝑑𝑑𝑎𝑎𝑎𝑎𝑎𝑎𝑎𝑎�𝑎𝑎𝑎𝑎} 𝑎𝑎𝑎𝑎𝑎𝑎𝑎𝑎𝑎𝑎𝑎𝑎𝑎𝑎𝑎𝑎𝑎𝑎𝑎𝑎 𝑋𝑋𝑋𝑋 ==�{(𝑎𝑎𝑎𝑎𝑎𝑎𝑎𝑎𝑎𝑎𝑎𝑎𝑎𝑎𝑎𝑎𝑎𝑎𝑎𝑎, 𝒜𝒜𝒜𝒜 = 𝑟𝑟𝑟𝑟𝑎𝑎𝑎𝑎𝑎𝑎𝑎𝑎𝑟𝑟𝑟𝑟𝑑𝑑𝑑𝑑𝑑𝑑𝑑𝑑𝑑𝑑𝑑𝑑𝑑𝑑𝑑𝑑)} 𝑠𝑠𝑠𝑠𝑑𝑑𝑑𝑑𝑑𝑑𝑑𝑑𝑑𝑑𝑑𝑑𝑑𝑑𝑑𝑑_𝑖𝑖𝑖𝑖 𝑑𝑑𝑑𝑑 }, {𝑎𝑎𝑎𝑎𝑎𝑎𝑎𝑎𝑎𝑎𝑎𝑎𝑎𝑎𝑎𝑎𝑎𝑎𝑎𝑎𝑎𝑎𝑎𝑎𝑎𝑎𝑎𝑎𝑎𝑎𝑎𝑎𝑎𝑎𝑎𝑎𝑎𝑎𝑎𝑎𝑎𝑎𝑎𝑎, 𝑑𝑑𝑑𝑑𝑑𝑑𝑑𝑑𝑑𝑑𝑑𝑑𝑑𝑑𝑑𝑑𝑑𝑑𝑑𝑑𝑑𝑑𝑑𝑑𝑑𝑑𝑑𝑑𝑑𝑑𝑑𝑑} 𝑠𝑠𝑠𝑠 𝑑𝑑𝑑𝑑𝑑𝑑𝑑𝑑𝑑𝑑𝑑𝑑𝑑𝑑𝑑𝑑_𝑖𝑖𝑖𝑖 𝑑𝑑𝑑𝑑 , 𝑎𝑎𝑎𝑎𝑎𝑎𝑎𝑎𝑎𝑎𝑎𝑎𝑎𝑎𝑎𝑎𝑎𝑎𝑎𝑎𝑎𝑎𝑎𝑎_𝑖𝑖𝑖𝑖 𝑑𝑑𝑑𝑑 , 𝑎𝑎𝑎𝑎𝑒𝑒𝑒𝑒𝑎𝑎𝑎𝑎𝑎𝑎𝑎𝑎_𝑑𝑑𝑑𝑑𝑎𝑎𝑎𝑎𝑎𝑎𝑎𝑎 𝑎𝑎𝑎𝑎} 𝑑𝑑𝑑𝑑𝑑𝑑𝑑𝑑𝑑𝑑𝑑𝑑𝑑𝑑𝑑𝑑𝑑𝑑𝑑𝑑𝑑𝑑𝑑𝑑𝑅𝑅𝑅𝑅,𝑋𝑋𝑋𝑋𝑅𝑅𝑅𝑅𝑎𝑎𝑎𝑎𝒜𝒜𝒜𝒜 𝑎𝑎𝑎𝑎𝑎𝑎𝑎𝑎𝑅𝑅𝑅𝑅,𝑋𝑋𝑋𝑋 𝑎𝑎𝑎𝑎𝑎𝑎𝑎𝑎{𝑠𝑠𝑠𝑠𝑡𝑡𝑡𝑡 = � � 𝑟𝑟𝑟𝑟𝑎𝑎𝑎𝑎𝑎𝑎𝑎𝑎𝑟𝑟𝑟𝑟𝑑𝑑𝑑𝑑𝑑𝑑𝑑𝑑𝑑𝑑𝑑𝑑𝑑𝑑𝑑𝑑)} {(𝑎𝑎𝑎𝑎𝑎𝑎𝑎𝑎𝑎𝑎𝑎𝑎𝑎𝑎𝑎𝑎𝑎𝑎𝑎𝑎, 𝑟𝑟𝑟𝑟𝑎𝑎𝑎𝑎𝑎𝑎𝑎𝑎𝑟𝑟𝑟𝑟𝑑𝑑𝑑𝑑𝑑𝑑𝑑𝑑𝑑𝑑𝑑𝑑𝑑𝑑𝑑𝑑)} =𝑑𝑑𝑑𝑑}, 𝑑𝑑𝑑𝑑𝑑𝑑𝑑𝑑𝑑𝑑𝑑𝑑𝑑𝑑𝑑𝑑𝑑𝑑𝑑𝑑𝑑𝑑𝑑𝑑𝑑𝑑𝑑𝑑𝑑𝑑𝑑𝑑, 𝑅𝑅𝑅𝑅 = {(𝑎𝑎𝑎𝑎𝑎𝑎𝑎𝑎𝑎𝑎𝑎𝑎𝑎𝑎𝑎𝑎𝑎𝑎𝑎𝑎, {𝑠𝑠𝑠𝑠𝑡𝑡𝑡𝑡𝒜𝒜𝒜𝒜 𝑠𝑠𝑠𝑠𝑑𝑑𝑑𝑑𝑑𝑑𝑑𝑑𝑑𝑑𝑑𝑑𝑑𝑑𝑑𝑑𝑑𝑑𝑑𝑑𝑑𝑑𝑑𝑑𝑑𝑑𝑑𝑑𝑑𝑑𝑑𝑑, 𝑑𝑑𝑑𝑑𝑑𝑑𝑑𝑑𝑑𝑑𝑑𝑑𝑑𝑑𝑑𝑑_𝑖𝑖𝑖𝑖 𝑅𝑅𝑅𝑅,𝑋𝑋𝑋𝑋 {𝑠𝑠𝑠𝑠𝑡𝑡𝑡𝑡 𝑠𝑠𝑠𝑠 𝑑𝑑𝑑𝑑𝑑𝑑𝑑𝑑𝑑𝑑𝑑𝑑𝑑𝑑𝑑𝑑_𝑖𝑖𝑖𝑖 𝑑𝑑𝑑𝑑 , 𝑎𝑎𝑎𝑎𝑎𝑎𝑎𝑎𝑎𝑎𝑎𝑎𝑎𝑎𝑎𝑎𝑎𝑎𝑎𝑎𝑎𝑎𝑎𝑎_𝑖𝑖𝑖𝑖 𝑑𝑑𝑑𝑑 , 𝑎𝑎𝑎𝑎𝑒𝑒𝑒𝑒𝑎𝑎𝑎𝑎𝑎𝑎𝑎𝑎_𝑑𝑑𝑑𝑑𝑎𝑎𝑎𝑎𝑎𝑎𝑎𝑎 𝑎𝑎𝑎𝑎 } {𝑠𝑠𝑠𝑠𝑡𝑡𝑡𝑡𝑠𝑠𝑠𝑠𝑑𝑑𝑑𝑑𝑑𝑑𝑑𝑑𝑑𝑑𝑑𝑑𝑑𝑑𝑑𝑑_𝑖𝑖𝑖𝑖 𝑑𝑑𝑑𝑑 }, 𝑎𝑎𝑎𝑎𝑎𝑎𝑎𝑎𝑎𝑎𝑎𝑎𝑎𝑎𝑎𝑎𝑎𝑎𝑎𝑎𝑅𝑅𝑅𝑅𝑋𝑋𝑋𝑋== � {𝑎𝑎𝑎𝑎𝑎𝑎𝑎𝑎𝑎𝑎𝑎𝑎𝑎𝑎𝑎𝑎𝑎𝑎𝑎𝑎𝑎𝑎𝑎𝑎𝑎𝑎𝑎𝑎𝑎𝑎𝑎𝑎𝑎𝑎𝑎𝑎𝑎𝑎𝑎𝑎𝑎𝑎𝑎𝑎, � 𝑑𝑑𝑑𝑑𝑑𝑑𝑑𝑑𝑑𝑑𝑑𝑑𝑑𝑑𝑑𝑑𝑑𝑑𝑑𝑑𝑑𝑑𝑑𝑑𝑑𝑑𝑑𝑑𝑑𝑑𝑑𝑑} 𝑑𝑑𝑑𝑑𝑑𝑑𝑑𝑑𝑑𝑑𝑑𝑑𝑑𝑑𝑑𝑑𝑑𝑑𝑑𝑑𝑑𝑑𝑑𝑑 {(𝑎𝑎𝑎𝑎𝑎𝑎𝑎𝑎𝑎𝑎𝑎𝑎𝑎𝑎𝑎𝑎𝑎𝑎𝑎𝑎, 𝒜𝒜𝒜𝒜 𝑑𝑑𝑑𝑑𝑑𝑑𝑑𝑑𝑑𝑑𝑑𝑑𝑑𝑑𝑑𝑑𝑑𝑑𝑑𝑑𝑑𝑑𝑑𝑑𝑑𝑑𝑑𝑑𝑑𝑑𝑑𝑑, 𝑟𝑟𝑟𝑟𝑎𝑎𝑎𝑎𝑎𝑎𝑎𝑎𝑟𝑟𝑟𝑟𝑑𝑑𝑑𝑑𝑑𝑑𝑑𝑑𝑑𝑑𝑑𝑑𝑑𝑑𝑑𝑑)} 𝑠𝑠𝑠𝑠𝑑𝑑𝑑𝑑𝑑𝑑𝑑𝑑𝑑𝑑𝑑𝑑𝑑𝑑𝑑𝑑_𝑖𝑖𝑖𝑖 𝑑𝑑𝑑𝑑 , {𝑎𝑎𝑎𝑎𝑎𝑎𝑎𝑎𝑎𝑎𝑎𝑎𝑎𝑎𝑎𝑎𝑎𝑎𝑎𝑎𝑎𝑎𝑎𝑎𝑎𝑎𝑎𝑎𝑎𝑎𝑎𝑎𝑎𝑎𝑎𝑎𝑎𝑎𝑎𝑎𝑎𝑎𝑎𝑎}, 𝑎𝑎𝑎𝑎𝑎𝑎𝑎𝑎𝑎𝑎𝑎𝑎𝑎𝑎𝑎𝑎𝑎𝑎𝑎𝑎𝑎𝑎𝑎𝑎_𝑖𝑖𝑖𝑖 𝑑𝑑𝑑𝑑 , 𝑎𝑎𝑎𝑎𝑒𝑒𝑒𝑒𝑎𝑎𝑎𝑎𝑎𝑎𝑎𝑎_𝑑𝑑𝑑𝑑𝑎𝑎𝑎𝑎𝑎𝑎𝑎𝑎 𝑎𝑎𝑎𝑎} � =𝑅𝑅𝑅𝑅,𝑋𝑋𝑋𝑋 �{𝑠𝑠𝑠𝑠𝑡𝑡𝑡𝑡= {𝑎𝑎𝑎𝑎𝑎𝑎𝑎𝑎𝑎𝑎𝑎𝑎𝑎𝑎𝑎𝑎𝑎𝑎𝑎𝑎𝑎𝑎𝑎𝑎𝑎𝑎𝑎𝑎𝑎𝑎𝑎𝑎𝑎𝑎𝑎𝑎𝑎𝑎𝑎𝑎𝑎𝑎𝑎𝑎}, 𝑑𝑑𝑑𝑑𝑑𝑑𝑑𝑑𝑑𝑑𝑑𝑑𝑑𝑑𝑑𝑑𝑑𝑑𝑑𝑑𝑑𝑑𝑑𝑑𝑑𝑑𝑑𝑑𝑑𝑑𝑑𝑑} 𝑑𝑑𝑑𝑑𝑑𝑑𝑑𝑑𝑑𝑑𝑑𝑑𝑑𝑑𝑑𝑑𝑑𝑑𝑑𝑑𝑑𝑑𝑑𝑑 𝑎𝑎𝑎𝑎𝑋𝑋𝑋𝑋𝑎𝑎𝑎𝑎𝑎𝑎𝑎𝑎𝑎𝑎𝑎𝑎=𝑎𝑎𝑎𝑎𝑅𝑅𝑅𝑅{𝑎𝑎𝑎𝑎𝑎𝑎𝑎𝑎𝑎𝑎𝑎𝑎𝑎𝑎𝑎𝑎𝑎𝑎𝑎𝑎𝑎𝑎𝑎𝑎𝑎𝑎𝑎𝑎𝑎𝑎𝑎𝑎𝑎𝑎𝑎𝑎𝑎𝑎𝑎𝑎𝑎𝑎𝑎𝑎, 𝑠𝑠𝑠𝑠 𝑑𝑑𝑑𝑑𝑑𝑑𝑑𝑑𝑑𝑑𝑑𝑑𝑑𝑑𝑑𝑑_𝑖𝑖𝑖𝑖 𝑑𝑑𝑑𝑑 , 𝑎𝑎𝑎𝑎𝑎𝑎𝑎𝑎𝑎𝑎𝑎𝑎𝑎𝑎𝑎𝑎𝑎𝑎𝑎𝑎𝑎𝑎𝑎𝑎_𝑖𝑖𝑖𝑖 𝑑𝑑𝑑𝑑 , 𝑎𝑎𝑎𝑎𝑒𝑒𝑒𝑒𝑎𝑎𝑎𝑎𝑎𝑎𝑎𝑎_𝑑𝑑𝑑𝑑𝑎𝑎𝑎𝑎𝑎𝑎𝑎𝑎 𝑎𝑎𝑎𝑎} � 𝑎𝑎𝑎𝑎𝒜𝒜𝒜𝒜 𝑎𝑎𝑎𝑎𝑎𝑎𝑎𝑎= 𝑎𝑎𝑎𝑎𝑎𝑎𝑎𝑎{𝑠𝑠𝑠𝑠𝑡𝑡𝑡𝑡 = � 𝑎𝑎𝑎𝑎 𝑎𝑎𝑎𝑎 𝑎𝑎𝑎𝑎 𝑎𝑎𝑎𝑎𝑎𝑎𝑎𝑎 = � {𝑎𝑎𝑎𝑎𝑎𝑎𝑎𝑎𝑎𝑎𝑎𝑎𝑎𝑎𝑎𝑎𝑎𝑎𝑎𝑎𝑎𝑎𝑎𝑎𝑎𝑎𝑎𝑎𝑎𝑎𝑎𝑎𝑎𝑎𝑎𝑎𝑎𝑎𝑎𝑎𝑎𝑎𝑎𝑎, 𝑑𝑑𝑑𝑑𝑑𝑑𝑑𝑑𝑑𝑑𝑑𝑑𝑑𝑑𝑑𝑑𝑑𝑑𝑑𝑑𝑑𝑑𝑑𝑑𝑑𝑑𝑑𝑑𝑑𝑑𝑑𝑑} 𝑅𝑅𝑅𝑅 𝑑𝑑𝑑𝑑𝑑𝑑𝑑𝑑𝑑𝑑𝑑𝑑𝑑𝑑𝑑𝑑𝑑𝑑𝑑𝑑𝑑𝑑𝑑𝑑 𝑋𝑋𝑋𝑋 𝑅𝑅𝑅𝑅 = {(𝑎𝑎𝑎𝑎𝑎𝑎𝑎𝑎𝑎𝑎𝑎𝑎𝑎𝑎𝑎𝑎𝑎𝑎𝑎𝑎, 𝑑𝑑𝑑𝑑𝑑𝑑𝑑𝑑𝑑𝑑𝑑𝑑𝑑𝑑𝑑𝑑𝑑𝑑𝑑𝑑𝑑𝑑𝑑𝑑𝑑𝑑𝑑𝑑𝑑𝑑𝑑𝑑, 𝑟𝑟𝑟𝑟𝑎𝑎𝑎𝑎𝑎𝑎𝑎𝑎𝑟𝑟𝑟𝑟𝑑𝑑𝑑𝑑𝑑𝑑𝑑𝑑𝑑𝑑𝑑𝑑𝑑𝑑𝑑𝑑)} 𝑑𝑑𝑑𝑑𝑑𝑑𝑑𝑑𝑑𝑑𝑑𝑑𝑑𝑑𝑑𝑑𝑑𝑑𝑑𝑑𝑑𝑑𝑑𝑑𝑑𝑑𝑑𝑑𝑑𝑑𝑑𝑑} � {𝑎𝑎𝑎𝑎𝑎𝑎𝑎𝑎𝑎𝑎𝑎𝑎𝑎𝑎𝑎𝑎𝑎𝑎𝑎𝑎𝑎𝑎𝑎𝑎𝑎𝑎𝑎𝑎𝑎𝑎𝑎𝑎𝑎𝑎𝑎𝑎𝑎𝑎𝑎𝑎𝑎𝑎𝑎𝑎}, 𝑅𝑅𝑅𝑅,𝑋𝑋𝑋𝑋 {𝑎𝑎𝑎𝑎𝑎𝑎𝑎𝑎𝑎𝑎𝑎𝑎𝑎𝑎𝑎𝑎𝑎𝑎𝑎𝑎𝑎𝑎𝑎𝑎𝑎𝑎𝑎𝑎𝑎𝑎𝑎𝑎𝑎𝑎𝑎𝑎𝑎𝑎𝑎𝑎𝑎𝑎𝑎𝑎, 𝑑𝑑𝑑𝑑𝑑𝑑𝑑𝑑𝑑𝑑𝑑𝑑𝑑𝑑𝑑𝑑𝑑𝑑𝑑𝑑𝑑𝑑𝑑𝑑𝑑𝑑𝑑𝑑𝑑𝑑𝑑𝑑} {𝑎𝑎𝑎𝑎𝑎𝑎𝑎𝑎𝑎𝑎𝑎𝑎𝑎𝑎𝑎𝑎𝑎𝑎𝑎𝑎𝑎𝑎𝑎𝑎𝑎𝑎𝑎𝑎𝑎𝑎𝑎𝑎𝑎𝑎𝑎𝑎𝑎𝑎𝑎𝑎𝑎𝑎𝑎𝑎, 𝑑𝑑𝑑𝑑𝑑𝑑𝑑𝑑𝑑𝑑𝑑𝑑𝑑𝑑𝑑𝑑𝑑𝑑𝑑𝑑𝑑𝑑𝑑𝑑𝑑𝑑𝑑𝑑𝑑𝑑𝑑𝑑} {(𝑎𝑎𝑎𝑎𝑎𝑎𝑎𝑎𝑎𝑎𝑎𝑎𝑎𝑎𝑎𝑎𝑎𝑎𝑎𝑎, 𝒜𝒜𝒜𝒜= 𝑟𝑟𝑟𝑟𝑎𝑎𝑎𝑎𝑎𝑎𝑎𝑎𝑟𝑟𝑟𝑟𝑑𝑑𝑑𝑑𝑑𝑑𝑑𝑑𝑑𝑑𝑑𝑑𝑑𝑑𝑑𝑑)} 𝑑𝑑𝑑𝑑𝑑𝑑𝑑𝑑𝑑𝑑𝑑𝑑𝑑𝑑𝑑𝑑𝑑𝑑𝑑𝑑𝑑𝑑𝑑𝑑 𝑋𝑋𝑋𝑋 𝑅𝑅𝑅𝑅,𝑋𝑋𝑋𝑋{𝑎𝑎𝑎𝑎𝑎𝑎𝑎𝑎𝑎𝑎𝑎𝑎𝑎𝑎𝑎𝑎𝑎𝑎𝑎𝑎𝑎𝑎𝑎𝑎𝑎𝑎𝑎𝑎𝑎𝑎𝑎𝑎𝑎𝑎𝑎𝑎𝑎𝑎𝑎𝑎𝑎𝑎𝑎𝑎, 𝑎𝑎𝑎𝑎= 𝑎𝑎𝑎𝑎𝑎𝑎𝑎𝑎𝑎𝑎𝑎𝑎𝑎𝑎𝑎𝑎 ={(𝑎𝑎𝑎𝑎𝑎𝑎𝑎𝑎𝑎𝑎𝑎𝑎𝑎𝑎𝑎𝑎𝑎𝑎𝑎𝑎, � 𝑑𝑑𝑑𝑑𝑑𝑑𝑑𝑑𝑑𝑑𝑑𝑑𝑑𝑑𝑑𝑑𝑑𝑑𝑑𝑑𝑑𝑑𝑑𝑑𝑑𝑑𝑑𝑑𝑑𝑑𝑑𝑑, � 𝑅𝑅𝑅𝑅 {𝑎𝑎𝑎𝑎𝑎𝑎𝑎𝑎𝑎𝑎𝑎𝑎𝑎𝑎𝑎𝑎𝑎𝑎𝑎𝑎𝑎𝑎𝑎𝑎𝑎𝑎𝑎𝑎𝑎𝑎𝑎𝑎𝑎𝑎𝑎𝑎𝑎𝑎𝑎𝑎𝑎𝑎𝑎𝑎, 𝑑𝑑𝑑𝑑𝑑𝑑𝑑𝑑𝑑𝑑𝑑𝑑𝑑𝑑𝑑𝑑𝑑𝑑𝑑𝑑𝑑𝑑𝑑𝑑𝑑𝑑𝑑𝑑𝑑𝑑𝑑𝑑} 𝑑𝑑𝑑𝑑𝑑𝑑𝑑𝑑𝑑𝑑𝑑𝑑𝑑𝑑𝑑𝑑𝑑𝑑𝑑𝑑𝑑𝑑𝑑𝑑 𝑋𝑋𝑋𝑋 = 𝒜𝒜𝒜𝒜 = 𝑑𝑑𝑑𝑑𝑑𝑑𝑑𝑑𝑑𝑑𝑑𝑑𝑑𝑑𝑑𝑑𝑑𝑑𝑑𝑑𝑑𝑑𝑑𝑑𝑑𝑑𝑑𝑑𝑑𝑑𝑑𝑑, 𝑟𝑟𝑟𝑟𝑎𝑎𝑎𝑎𝑎𝑎𝑎𝑎𝑟𝑟𝑟𝑟𝑑𝑑𝑑𝑑𝑑𝑑𝑑𝑑𝑑𝑑𝑑𝑑𝑑𝑑𝑑𝑑)} {𝑎𝑎𝑎𝑎𝑎𝑎𝑎𝑎𝑎𝑎𝑎𝑎𝑎𝑎𝑎𝑎𝑎𝑎𝑎𝑎𝑎𝑎𝑎𝑎𝑎𝑎𝑎𝑎𝑎𝑎𝑎𝑎𝑎𝑎𝑎𝑎𝑎𝑎𝑎𝑎𝑎𝑎𝑎𝑎, 𝑑𝑑𝑑𝑑𝑑𝑑𝑑𝑑𝑑𝑑𝑑𝑑𝑑𝑑𝑑𝑑𝑑𝑑𝑑𝑑𝑑𝑑𝑑𝑑𝑑𝑑𝑑𝑑𝑑𝑑𝑑𝑑} 𝑅𝑅𝑅𝑅,𝑋𝑋𝑋𝑋 {𝑎𝑎𝑎𝑎𝑎𝑎𝑎𝑎𝑎𝑎𝑎𝑎𝑎𝑎𝑎𝑎𝑎𝑎𝑎𝑎𝑎𝑎𝑎𝑎𝑎𝑎𝑎𝑎𝑎𝑎𝑎𝑎𝑎𝑎𝑎𝑎𝑎𝑎𝑎𝑎𝑎𝑎𝑎𝑎}, {(𝑎𝑎𝑎𝑎𝑎𝑎𝑎𝑎𝑎𝑎𝑎𝑎𝑎𝑎𝑎𝑎𝑎𝑎𝑎𝑎, {𝑎𝑎𝑎𝑎𝑎𝑎𝑎𝑎𝑎𝑎𝑎𝑎𝑎𝑎𝑎𝑎𝑎𝑎𝑎𝑎𝑎𝑎𝑎𝑎𝑎𝑎𝑎𝑎, = 𝑑𝑑𝑑𝑑𝑑𝑑𝑑𝑑𝑑𝑑𝑑𝑑𝑑𝑑𝑑𝑑𝑑𝑑𝑑𝑑𝑑𝑑𝑑𝑑𝑑𝑑𝑑𝑑𝑑𝑑𝑑𝑑, 𝑟𝑟𝑟𝑟𝑎𝑎𝑎𝑎𝑎𝑎𝑎𝑎𝑟𝑟𝑟𝑟𝑑𝑑𝑑𝑑𝑑𝑑𝑑𝑑𝑑𝑑𝑑𝑑𝑑𝑑𝑑𝑑)} {𝑎𝑎𝑎𝑎𝑎𝑎𝑎𝑎𝑎𝑎𝑎𝑎𝑎𝑎𝑎𝑎𝑎𝑎𝑎𝑎𝑎𝑎𝑎𝑎𝑎𝑎𝑎𝑎, {𝑎𝑎𝑎𝑎𝑎𝑎𝑎𝑎𝑎𝑎𝑎𝑎𝑎𝑎𝑎𝑎𝑎𝑎𝑎𝑎𝑎𝑎𝑎𝑎𝑎𝑎𝑎𝑎𝑎𝑎𝑎𝑎𝑎𝑎𝑎𝑎𝑎𝑎𝑎𝑎𝑎𝑎𝑎𝑎}, =𝑎𝑎𝑎𝑎𝑎𝑎𝑎𝑎 𝑠𝑠𝑠𝑠𝑠𝑠𝑠𝑠𝑎𝑎𝑎𝑎𝑎𝑎𝑎𝑎𝑎𝑎𝑎𝑎𝑎𝑎𝑎𝑎𝑎𝑎𝑎𝑎, 𝑑𝑑𝑑𝑑𝑑𝑑𝑑𝑑𝑑𝑑𝑑𝑑𝑑𝑑𝑑𝑑𝑑𝑑𝑑𝑑𝑑𝑑𝑑𝑑𝑑𝑑𝑑𝑑𝑑𝑑𝑑𝑑} 𝑋𝑋𝑋𝑋 = 𝑠𝑠𝑠𝑠𝑠𝑠𝑠𝑠𝑎𝑎𝑎𝑎𝑎𝑎𝑎𝑎𝑎𝑎𝑎𝑎𝑎𝑎𝑎𝑎𝑎𝑎𝑎𝑎, 𝑑𝑑𝑑𝑑𝑑𝑑𝑑𝑑𝑑𝑑𝑑𝑑𝑑𝑑𝑑𝑑𝑑𝑑𝑑𝑑𝑑𝑑𝑑𝑑𝑑𝑑𝑑𝑑𝑑𝑑𝑑𝑑} 𝑎𝑎𝑎𝑎 𝑎𝑎𝑎𝑎 𝑎𝑎𝑎𝑎 = � � 𝑎𝑎𝑎𝑎𝑎𝑎𝑎𝑎𝑎𝑎𝑎𝑎𝑎𝑎𝑎𝑎 𝒜𝒜𝒜𝒜 𝑎𝑎𝑎𝑎 𝑎𝑎𝑎𝑎 𝑎𝑎𝑎𝑎 𝑎𝑎𝑎𝑎 𝑅𝑅𝑅𝑅,𝑋𝑋𝑋𝑋 𝑋𝑋𝑋𝑋 𝑅𝑅𝑅𝑅 𝒜𝒜𝒜𝒜 𝑑𝑑𝑑𝑑𝑑𝑑𝑑𝑑𝑑𝑑𝑑𝑑𝑑𝑑𝑑𝑑𝑑𝑑𝑑𝑑𝑑𝑑𝑑𝑑𝑑𝑑𝑑𝑑𝑑𝑑𝑑𝑑, 𝑟𝑟𝑟𝑟𝑎𝑎𝑎𝑎𝑎𝑎𝑎𝑎𝑟𝑟𝑟𝑟𝑑𝑑𝑑𝑑𝑑𝑑𝑑𝑑𝑑𝑑𝑑𝑑𝑑𝑑𝑑𝑑)} {𝑎𝑎𝑎𝑎𝑎𝑎𝑎𝑎𝑎𝑎𝑎𝑎𝑎𝑎𝑎𝑎𝑎𝑎𝑎𝑎𝑎𝑎𝑎𝑎𝑎𝑎𝑎𝑎𝑎𝑎𝑎𝑎𝑎𝑎𝑎𝑎𝑎𝑎𝑎𝑎𝑎𝑎𝑎𝑎, 𝑑𝑑𝑑𝑑𝑑𝑑𝑑𝑑𝑑𝑑𝑑𝑑𝑑𝑑𝑑𝑑𝑑𝑑𝑑𝑑𝑑𝑑𝑑𝑑𝑑𝑑𝑑𝑑𝑑𝑑𝑑𝑑} {𝑎𝑎𝑎𝑎𝑎𝑎𝑎𝑎𝑎𝑎𝑎𝑎𝑎𝑎𝑎𝑎𝑎𝑎𝑎𝑎𝑎𝑎𝑎𝑎𝑎𝑎𝑎𝑎𝑎𝑎𝑎𝑎𝑎𝑎𝑎𝑎𝑎𝑎𝑎𝑎𝑎𝑎𝑎𝑎}, 𝑎𝑎𝑎𝑎𝑎𝑎𝑎𝑎𝑎𝑎𝑎𝑎𝑅𝑅𝑅𝑅,𝑋𝑋𝑋𝑋 𝑎𝑎𝑎𝑎𝑎𝑎𝑎𝑎𝑅𝑅𝑅𝑅=={(𝑎𝑎𝑎𝑎𝑎𝑎𝑎𝑎𝑎𝑎𝑎𝑎𝑎𝑎𝑎𝑎𝑎𝑎𝑎𝑎, � � 𝑋𝑋𝑋𝑋 = 𝑅𝑅𝑅𝑅{𝑎𝑎𝑎𝑎𝑎𝑎𝑎𝑎𝑎𝑎𝑎𝑎𝑎𝑎𝑎𝑎𝑎𝑎𝑎𝑎𝑎𝑎𝑎𝑎𝑎𝑎𝑎𝑎, 𝑠𝑠𝑠𝑠𝑠𝑠𝑠𝑠𝑎𝑎𝑎𝑎𝑎𝑎𝑎𝑎𝑎𝑎𝑎𝑎𝑎𝑎𝑎𝑎𝑎𝑎𝑎𝑎, 𝑑𝑑𝑑𝑑𝑑𝑑𝑑𝑑𝑑𝑑𝑑𝑑𝑑𝑑𝑑𝑑𝑑𝑑𝑑𝑑𝑑𝑑𝑑𝑑𝑑𝑑𝑑𝑑𝑑𝑑𝑑𝑑} {𝑎𝑎𝑎𝑎𝑎𝑎𝑎𝑎𝑎𝑎𝑎𝑎𝑎𝑎𝑎𝑎𝑎𝑎𝑎𝑎𝑎𝑎𝑎𝑎𝑎𝑎𝑎𝑎𝑎𝑎𝑎𝑎𝑎𝑎𝑎𝑎𝑎𝑎𝑎𝑎𝑎𝑎𝑎𝑎, 𝑑𝑑𝑑𝑑𝑑𝑑𝑑𝑑𝑑𝑑𝑑𝑑𝑑𝑑𝑑𝑑𝑑𝑑𝑑𝑑𝑑𝑑𝑑𝑑𝑑𝑑𝑑𝑑𝑑𝑑𝑑𝑑} 𝐼𝐼𝐼𝐼𝑎𝑎𝑎𝑎𝑡𝑡𝑡𝑡𝑡𝑡𝑡𝑡𝑡𝑡𝑡𝑡 𝑎𝑎𝑎𝑎𝑎𝑎𝑎𝑎𝑎𝑎𝑎𝑎 𝐼𝐼𝐼𝐼𝑡𝑡𝑡𝑡𝑡𝑡𝑡𝑡𝑡𝑡𝑡𝑡 𝑎𝑎𝑎𝑎𝒜𝒜𝒜𝒜 𝑎𝑎𝑎𝑎𝑎𝑎𝑎𝑎𝑅𝑅𝑅𝑅,𝑋𝑋𝑋𝑋 𝑎𝑎𝑎𝑎𝑎𝑎𝑎𝑎 � {𝑎𝑎𝑎𝑎𝑎𝑎𝑎𝑎𝑎𝑎𝑎𝑎𝑎𝑎𝑎𝑎𝑎𝑎𝑎𝑎𝑎𝑎𝑎𝑎𝑎𝑎𝑎𝑎𝑎𝑎𝑎𝑎𝑎𝑎𝑎𝑎𝑎𝑎𝑎𝑎𝑎𝑎𝑎𝑎}, � {(𝑎𝑎𝑎𝑎𝑎𝑎𝑎𝑎𝑎𝑎𝑎𝑎𝑎𝑎𝑎𝑎𝑎𝑎𝑎𝑎, {(𝑎𝑎𝑎𝑎𝑎𝑎𝑎𝑎𝑎𝑎𝑎𝑎𝑎𝑎𝑎𝑎𝑎𝑎𝑎𝑎, == 𝑑𝑑𝑑𝑑𝑑𝑑𝑑𝑑𝑑𝑑𝑑𝑑𝑑𝑑𝑑𝑑𝑑𝑑𝑑𝑑𝑑𝑑𝑑𝑑𝑑𝑑𝑑𝑑𝑑𝑑𝑑𝑑, 𝑟𝑟𝑟𝑟𝑎𝑎𝑎𝑎𝑎𝑎𝑎𝑎𝑟𝑟𝑟𝑟𝑑𝑑𝑑𝑑𝑑𝑑𝑑𝑑𝑑𝑑𝑑𝑑𝑑𝑑𝑑𝑑)} 𝒜𝒜𝒜𝒜 = 𝑑𝑑𝑑𝑑𝑑𝑑𝑑𝑑𝑑𝑑𝑑𝑑𝑑𝑑𝑑𝑑𝑑𝑑𝑑𝑑𝑑𝑑𝑑𝑑𝑑𝑑𝑑𝑑𝑑𝑑𝑑𝑑, 𝑟𝑟𝑟𝑟𝑎𝑎𝑎𝑎𝑎𝑎𝑎𝑎𝑟𝑟𝑟𝑟𝑑𝑑𝑑𝑑𝑑𝑑𝑑𝑑𝑑𝑑𝑑𝑑𝑑𝑑𝑑𝑑)} 𝑅𝑅𝑅𝑅,𝑋𝑋𝑋𝑋 {𝑎𝑎𝑎𝑎𝑎𝑎𝑎𝑎𝑎𝑎𝑎𝑎𝑎𝑎𝑎𝑎𝑎𝑎𝑎𝑎𝑎𝑎𝑎𝑎𝑎𝑎𝑎𝑎𝑎𝑎𝑎𝑎𝑎𝑎𝑎𝑎𝑎𝑎𝑎𝑎𝑎𝑎𝑎𝑎, {𝑎𝑎𝑎𝑎𝑎𝑎𝑎𝑎𝑎𝑎𝑎𝑎𝑎𝑎𝑎𝑎𝑎𝑎𝑎𝑎𝑎𝑎𝑎𝑎𝑎𝑎𝑎𝑎𝑎𝑎𝑎𝑎𝑎𝑎𝑎𝑎𝑎𝑎𝑎𝑎𝑎𝑎𝑎𝑎},𝑑𝑑𝑑𝑑𝑑𝑑𝑑𝑑𝑑𝑑𝑑𝑑𝑑𝑑𝑑𝑑𝑑𝑑𝑑𝑑𝑑𝑑𝑑𝑑𝑑𝑑𝑑𝑑𝑑𝑑𝑑𝑑} 𝑎𝑎𝑎𝑎𝑎𝑎𝑎𝑎𝑎𝑎𝑎𝑎𝑎𝑎𝑎𝑎𝑎𝑎𝑎𝑎𝑅𝑅𝑅𝑅𝑋𝑋𝑋𝑋==�{𝑎𝑎𝑎𝑎𝑎𝑎𝑎𝑎𝑎𝑎𝑎𝑎𝑎𝑎𝑎𝑎𝑎𝑎𝑎𝑎𝑎𝑎𝑎𝑎𝑎𝑎𝑎𝑎, � 𝑠𝑠𝑠𝑠𝑠𝑠𝑠𝑠𝑎𝑎𝑎𝑎𝑎𝑎𝑎𝑎𝑎𝑎𝑎𝑎𝑎𝑎𝑎𝑎𝑎𝑎𝑎𝑎, 𝑑𝑑𝑑𝑑𝑑𝑑𝑑𝑑𝑑𝑑𝑑𝑑𝑑𝑑𝑑𝑑𝑑𝑑𝑑𝑑𝑑𝑑𝑑𝑑𝑑𝑑𝑑𝑑𝑑𝑑𝑑𝑑} 𝑎𝑎𝑎𝑎𝐼𝐼𝐼𝐼𝑎𝑎𝑎𝑎𝑡𝑡𝑡𝑡𝑡𝑡𝑡𝑡𝑡𝑡𝑡𝑡 𝑎𝑎𝑎𝑎𝑎𝑎𝑎𝑎𝑎𝑎𝑎𝑎𝑋𝑋𝑋𝑋𝑎𝑎𝑎𝑎𝑎𝑎𝑎𝑎= 𝑎𝑎𝑎𝑎𝑎𝑎𝑎𝑎{𝑎𝑎𝑎𝑎𝑎𝑎𝑎𝑎𝑎𝑎𝑎𝑎𝑎𝑎𝑎𝑎𝑎𝑎𝑎𝑎𝑎𝑎𝑎𝑎𝑎𝑎𝑎𝑎, � {𝑎𝑎𝑎𝑎𝑟𝑟𝑟𝑟𝑟𝑟𝑟𝑟𝑟𝑟𝑟𝑟𝑎𝑎𝑎𝑎𝑒𝑒𝑒𝑒}, 𝒜𝒜𝒜𝒜= = {(𝑎𝑎𝑎𝑎𝑎𝑎𝑎𝑎𝑎𝑎𝑎𝑎𝑎𝑎𝑎𝑎𝑎𝑎𝑎𝑎, 𝑑𝑑𝑑𝑑𝑑𝑑𝑑𝑑𝑑𝑑𝑑𝑑𝑑𝑑𝑑𝑑𝑑𝑑𝑑𝑑𝑑𝑑𝑑𝑑𝑑𝑑𝑑𝑑𝑑𝑑𝑑𝑑, 𝑟𝑟𝑟𝑟𝑎𝑎𝑎𝑎𝑎𝑎𝑎𝑎𝑟𝑟𝑟𝑟𝑑𝑑𝑑𝑑𝑑𝑑𝑑𝑑𝑑𝑑𝑑𝑑𝑑𝑑𝑑𝑑)} 𝑑𝑑𝑑𝑑𝑑𝑑𝑑𝑑𝑑𝑑𝑑𝑑𝑑𝑑𝑑𝑑𝑑𝑑𝑑𝑑𝑑𝑑𝑑𝑑𝑑𝑑𝑑𝑑𝑑𝑑𝑑𝑑} 𝑅𝑅𝑅𝑅 𝑅𝑅𝑅𝑅,𝑋𝑋𝑋𝑋�{𝑎𝑎𝑎𝑎𝑎𝑎𝑎𝑎𝑎𝑎𝑎𝑎𝑎𝑎𝑎𝑎𝑎𝑎𝑎𝑎𝑎𝑎𝑎𝑎𝑎𝑎𝑎𝑎𝑎𝑎𝑎𝑎𝑎𝑎𝑎𝑎𝑎𝑎𝑎𝑎𝑎𝑎𝑎𝑎, {𝑎𝑎𝑎𝑎𝑟𝑟𝑟𝑟𝑟𝑟𝑟𝑟𝑟𝑟𝑟𝑟𝑎𝑎𝑎𝑎𝑒𝑒𝑒𝑒}, 𝑠𝑠𝑠𝑠𝑠𝑠𝑠𝑠𝑎𝑎𝑎𝑎𝑎𝑎𝑎𝑎𝑎𝑎𝑎𝑎𝑎𝑎𝑎𝑎𝑎𝑎𝑎𝑎, 𝑑𝑑𝑑𝑑𝑑𝑑𝑑𝑑𝑑𝑑𝑑𝑑𝑑𝑑𝑑𝑑𝑑𝑑𝑑𝑑𝑑𝑑𝑑𝑑𝑑𝑑𝑑𝑑𝑑𝑑𝑑𝑑} 𝑎𝑎𝑎𝑎𝑎𝑎𝑎𝑎𝑎𝑎𝑎𝑎𝑎𝑎𝑎𝑎 {𝑎𝑎𝑎𝑎𝑎𝑎𝑎𝑎𝑎𝑎𝑎𝑎𝑎𝑎𝑎𝑎𝑎𝑎𝑎𝑎𝑎𝑎𝑎𝑎𝑎𝑎𝑎𝑎𝑎𝑎𝑎𝑎𝑎𝑎𝑎𝑎𝑎𝑎𝑎𝑎𝑎𝑎𝑎𝑎, 𝑎𝑎𝑎𝑎𝒜𝒜𝒜𝒜 𝑎𝑎𝑎𝑎𝑎𝑎𝑎𝑎= 𝑎𝑎𝑎𝑎𝑎𝑎𝑎𝑎{𝑎𝑎𝑎𝑎𝑎𝑎𝑎𝑎𝑎𝑎𝑎𝑎𝑎𝑎𝑎𝑎𝑎𝑎𝑎𝑎𝑎𝑎𝑎𝑎𝑎𝑎𝑎𝑎, � � 𝑎𝑎𝑎𝑎𝑎𝑎𝑎𝑎𝑑𝑑𝑑𝑑𝑑𝑑𝑑𝑑𝑑𝑑𝑑𝑑𝑑𝑑𝑑𝑑𝑑𝑑𝑑𝑑𝑑𝑑𝑑𝑑𝑑𝑑𝑑𝑑𝑑𝑑𝑑𝑑, 𝑎𝑎𝑎𝑎𝑎𝑎𝑎𝑎𝑎𝑎𝑎𝑎𝑑𝑑𝑑𝑑𝑑𝑑𝑑𝑑𝑑𝑑𝑑𝑑𝑑𝑑𝑑𝑑𝑑𝑑𝑑𝑑𝑑𝑑𝑑𝑑𝑑𝑑𝑑𝑑𝑑𝑑𝑑𝑑} = 𝑑𝑑𝑑𝑑𝑑𝑑𝑑𝑑𝑑𝑑𝑑𝑑𝑑𝑑𝑑𝑑𝑑𝑑𝑑𝑑𝑑𝑑𝑑𝑑𝑑𝑑𝑑𝑑𝑑𝑑𝑑𝑑} � 𝑟𝑟𝑟𝑟𝑎𝑎𝑎𝑎𝑎𝑎𝑎𝑎𝑟𝑟𝑟𝑟𝑑𝑑𝑑𝑑𝑑𝑑𝑑𝑑𝑑𝑑𝑑𝑑𝑑𝑑𝑑𝑑)} � 𝑋𝑋𝑋𝑋 𝑠𝑠𝑠𝑠𝑠𝑠𝑠𝑠𝑎𝑎𝑎𝑎𝑎𝑎𝑎𝑎𝑎𝑎𝑎𝑎𝑎𝑎𝑎𝑎𝑎𝑎𝑎𝑎, 𝑅𝑅𝑅𝑅== {(𝑎𝑎𝑎𝑎𝑎𝑎𝑎𝑎𝑎𝑎𝑎𝑎𝑎𝑎𝑎𝑎𝑎𝑎𝑎𝑎, 𝑎𝑎𝑎𝑎𝐼𝐼𝐼𝐼𝑎𝑎𝑎𝑎𝑡𝑡𝑡𝑡𝑡𝑡𝑡𝑡𝑡𝑡𝑡𝑡 𝑎𝑎𝑎𝑎𝑎𝑎𝑎𝑎 𝑅𝑅𝑅𝑅 {𝑎𝑎𝑎𝑎𝑟𝑟𝑟𝑟𝑟𝑟𝑟𝑟𝑟𝑟𝑟𝑟𝑎𝑎𝑎𝑎𝑒𝑒𝑒𝑒}, 𝑅𝑅𝑅𝑅,𝑋𝑋𝑋𝑋 {𝑎𝑎𝑎𝑎𝑎𝑎𝑎𝑎𝑎𝑎𝑎𝑎𝑎𝑎𝑎𝑎 𝑎𝑎𝑎𝑎𝑎𝑎𝑎𝑎𝑎𝑎𝑎𝑎, 𝑠𝑠𝑠𝑠𝑠𝑠𝑠𝑠𝑎𝑎𝑎𝑎𝑎𝑎𝑎𝑎𝑎𝑎𝑎𝑎𝑎𝑎𝑎𝑎𝑎𝑎𝑎𝑎, 𝑑𝑑𝑑𝑑𝑑𝑑𝑑𝑑𝑑𝑑𝑑𝑑𝑑𝑑𝑑𝑑𝑑𝑑𝑑𝑑𝑑𝑑𝑑𝑑𝑑𝑑𝑑𝑑𝑑𝑑𝑑𝑑} {𝑎𝑎𝑎𝑎𝑎𝑎𝑎𝑎𝑎𝑎𝑎𝑎𝑎𝑎𝑎𝑎 𝑎𝑎𝑎𝑎𝑎𝑎𝑎𝑎𝑎𝑎𝑎𝑎, 𝑠𝑠𝑠𝑠𝑠𝑠𝑠𝑠𝑎𝑎𝑎𝑎𝑎𝑎𝑎𝑎𝑎𝑎𝑎𝑎𝑎𝑎𝑎𝑎𝑎𝑎𝑎𝑎, 𝑑𝑑𝑑𝑑𝑑𝑑𝑑𝑑𝑑𝑑𝑑𝑑𝑑𝑑𝑑𝑑𝑑𝑑𝑑𝑑𝑑𝑑𝑑𝑑𝑑𝑑𝑑𝑑𝑑𝑑𝑑𝑑} 𝑠𝑠𝑠𝑠𝑠𝑠𝑠𝑠𝑎𝑎𝑎𝑎𝑎𝑎𝑎𝑎𝑎𝑎𝑎𝑎𝑎𝑎𝑎𝑎𝑎𝑎𝑎𝑎, 𝑑𝑑𝑑𝑑𝑑𝑑𝑑𝑑𝑑𝑑𝑑𝑑𝑑𝑑𝑑𝑑𝑑𝑑𝑑𝑑𝑑𝑑𝑑𝑑𝑑𝑑𝑑𝑑𝑑𝑑𝑑𝑑} {(𝑎𝑎𝑎𝑎𝑎𝑎𝑎𝑎𝑎𝑎𝑎𝑎𝑎𝑎𝑎𝑎𝑎𝑎𝑎𝑎, 𝒜𝒜𝒜𝒜= = 𝑑𝑑𝑑𝑑𝑑𝑑𝑑𝑑𝑑𝑑𝑑𝑑𝑑𝑑𝑑𝑑𝑑𝑑𝑑𝑑𝑑𝑑𝑑𝑑𝑑𝑑𝑑𝑑𝑑𝑑𝑑𝑑, 𝑟𝑟𝑟𝑟𝑎𝑎𝑎𝑎𝑎𝑎𝑎𝑎𝑟𝑟𝑟𝑟𝑑𝑑𝑑𝑑𝑑𝑑𝑑𝑑𝑑𝑑𝑑𝑑𝑑𝑑𝑑𝑑)} 𝑎𝑎𝑎𝑎𝐼𝐼𝐼𝐼𝑎𝑎𝑎𝑎𝑡𝑡𝑡𝑡𝑡𝑡𝑡𝑡𝑡𝑡𝑡𝑡 𝑎𝑎𝑎𝑎𝑎𝑎𝑎𝑎 𝐼𝐼𝐼𝐼𝑡𝑡𝑡𝑡𝑡𝑡𝑡𝑡𝑡𝑡𝑡𝑡𝑋𝑋𝑋𝑋 𝑅𝑅𝑅𝑅,𝑋𝑋𝑋𝑋{𝑎𝑎𝑎𝑎𝑎𝑎𝑎𝑎𝑎𝑎𝑎𝑎𝑎𝑎𝑎𝑎𝑎𝑎𝑎𝑎𝑎𝑎𝑎𝑎𝑎𝑎𝑎𝑎, 𝑎𝑎𝑎𝑎 𝑎𝑎𝑎𝑎 𝑎𝑎𝑎𝑎 𝑎𝑎𝑎𝑎𝑎𝑎𝑎𝑎 = � � 𝑅𝑅𝑅𝑅 {𝑎𝑎𝑎𝑎𝑎𝑎𝑎𝑎𝑎𝑎𝑎𝑎𝑎𝑎𝑎𝑎𝑎𝑎𝑎𝑎𝑎𝑎𝑎𝑎𝑎𝑎𝑎𝑎, 𝑋𝑋𝑋𝑋 = 𝑠𝑠𝑠𝑠𝑠𝑠𝑠𝑠𝑎𝑎𝑎𝑎𝑎𝑎𝑎𝑎𝑎𝑎𝑎𝑎𝑎𝑎𝑎𝑎𝑎𝑎𝑎𝑎, 𝑑𝑑𝑑𝑑𝑑𝑑𝑑𝑑𝑑𝑑𝑑𝑑𝑑𝑑𝑑𝑑𝑑𝑑𝑑𝑑𝑑𝑑𝑑𝑑𝑑𝑑𝑑𝑑𝑑𝑑𝑑𝑑} 𝑎𝑎𝑎𝑎𝑎𝑎𝑎𝑎𝑎𝑎𝑎𝑎𝑎𝑎𝑎𝑎 𝒜𝒜𝒜𝒜𝑅𝑅𝑅𝑅,𝑋𝑋𝑋𝑋 = {(𝑎𝑎𝑎𝑎𝑎𝑎𝑎𝑎𝑎𝑎𝑎𝑎𝑎𝑎𝑎𝑎𝑎𝑎𝑎𝑎, 𝑟𝑟𝑟𝑟𝑎𝑎𝑎𝑎𝑎𝑎𝑎𝑎𝑟𝑟𝑟𝑟𝑑𝑑𝑑𝑑𝑑𝑑𝑑𝑑𝑑𝑑𝑑𝑑𝑑𝑑𝑑𝑑)} {𝑎𝑎𝑎𝑎𝑎𝑎𝑎𝑎𝑎𝑎𝑎𝑎𝑎𝑎𝑎𝑎𝑎𝑎𝑎𝑎𝑑𝑑𝑑𝑑𝑑𝑑𝑑𝑑𝑑𝑑𝑑𝑑𝑑𝑑𝑑𝑑𝑑𝑑𝑑𝑑𝑑𝑑𝑑𝑑𝑑𝑑𝑑𝑑𝑑𝑑𝑑𝑑, 𝑎𝑎𝑎𝑎𝑎𝑎𝑎𝑎, 𝑠𝑠𝑠𝑠𝑠𝑠𝑠𝑠𝑎𝑎𝑎𝑎𝑎𝑎𝑎𝑎𝑎𝑎𝑎𝑎𝑎𝑎𝑎𝑎𝑎𝑎𝑎𝑎, 𝑑𝑑𝑑𝑑𝑑𝑑𝑑𝑑𝑑𝑑𝑑𝑑𝑑𝑑𝑑𝑑𝑑𝑑𝑑𝑑𝑑𝑑𝑑𝑑𝑑𝑑𝑑𝑑𝑑𝑑𝑑𝑑} {𝑎𝑎𝑎𝑎𝑟𝑟𝑟𝑟𝑟𝑟𝑟𝑟𝑟𝑟𝑟𝑟𝑎𝑎𝑎𝑎𝑒𝑒𝑒𝑒}, 𝐼𝐼𝐼𝐼𝑡𝑡𝑡𝑡𝑡𝑡𝑡𝑡𝑡𝑡𝑡𝑡 {(𝑎𝑎𝑎𝑎𝑎𝑎𝑎𝑎𝑎𝑎𝑎𝑎𝑎𝑎𝑎𝑎𝑎𝑎𝑎𝑎, 𝒜𝒜𝒜𝒜𝑅𝑅𝑅𝑅,𝑋𝑋𝑋𝑋 𝑎𝑎𝑎𝑎= 𝑟𝑟𝑟𝑟𝑎𝑎𝑎𝑎𝑎𝑎𝑎𝑎𝑟𝑟𝑟𝑟𝑑𝑑𝑑𝑑𝑑𝑑𝑑𝑑𝑑𝑑𝑑𝑑𝑑𝑑𝑑𝑑)} {𝑎𝑎𝑎𝑎𝑟𝑟𝑟𝑟𝑟𝑟𝑟𝑟𝑟𝑟𝑟𝑟𝑎𝑎𝑎𝑎𝑒𝑒𝑒𝑒}, 𝑎𝑎𝑎𝑎𝑎𝑎𝑎𝑎𝑎𝑎𝑎𝑎𝑎𝑎𝑎𝑎 = � 𝑑𝑑𝑑𝑑𝑑𝑑𝑑𝑑𝑑𝑑𝑑𝑑𝑑𝑑𝑑𝑑𝑑𝑑𝑑𝑑𝑑𝑑𝑑𝑑𝑑𝑑𝑑𝑑𝑑𝑑𝑑𝑑, � 𝐼𝐼𝐼𝐼𝑡𝑡𝑡𝑡𝑡𝑡𝑡𝑡𝑡𝑡𝑡𝑡 𝒜𝒜𝒜𝒜 𝑑𝑑𝑑𝑑𝑑𝑑𝑑𝑑𝑑𝑑𝑑𝑑𝑑𝑑𝑑𝑑𝑑𝑑𝑑𝑑𝑑𝑑𝑑𝑑𝑑𝑑𝑑𝑑𝑑𝑑𝑑𝑑, 𝑟𝑟𝑟𝑟𝑎𝑎𝑎𝑎𝑎𝑎𝑎𝑎𝑟𝑟𝑟𝑟𝑑𝑑𝑑𝑑𝑑𝑑𝑑𝑑𝑑𝑑𝑑𝑑𝑑𝑑𝑑𝑑)} {𝑎𝑎𝑎𝑎𝑎𝑎𝑎𝑎𝑎𝑎𝑎𝑎𝑎𝑎𝑎𝑎 𝑎𝑎𝑎𝑎𝑎𝑎𝑎𝑎𝑎𝑎𝑎𝑎, {𝑎𝑎𝑎𝑎𝑟𝑟𝑟𝑟𝑟𝑟𝑟𝑟𝑟𝑟𝑟𝑟𝑎𝑎𝑎𝑎𝑒𝑒𝑒𝑒}, 𝑠𝑠𝑠𝑠𝑠𝑠𝑠𝑠𝑎𝑎𝑎𝑎𝑎𝑎𝑎𝑎𝑎𝑎𝑎𝑎𝑎𝑎𝑎𝑎𝑎𝑎𝑎𝑎, 𝑑𝑑𝑑𝑑𝑑𝑑𝑑𝑑𝑑𝑑𝑑𝑑𝑑𝑑𝑑𝑑𝑑𝑑𝑑𝑑𝑑𝑑𝑑𝑑𝑑𝑑𝑑𝑑𝑑𝑑𝑑𝑑} 𝑎𝑎𝑎𝑎𝑎𝑎𝑎𝑎𝑎𝑎𝑎𝑎𝑅𝑅𝑅𝑅,𝑋𝑋𝑋𝑋 𝑎𝑎𝑎𝑎𝑎𝑎𝑎𝑎𝑅𝑅𝑅𝑅=={(𝑎𝑎𝑎𝑎𝑎𝑎𝑎𝑎𝑎𝑎𝑎𝑎𝑎𝑎𝑎𝑎𝑎𝑎𝑎𝑎, �𝑅𝑅𝑅𝑅 � 𝑎𝑎𝑎𝑎𝑎𝑎𝑎𝑎𝑎𝑎𝑎𝑎, 𝑠𝑠𝑠𝑠𝑠𝑠𝑠𝑠𝑎𝑎𝑎𝑎𝑎𝑎𝑎𝑎𝑎𝑎𝑎𝑎𝑎𝑎𝑎𝑎𝑎𝑎𝑎𝑎, 𝑑𝑑𝑑𝑑𝑑𝑑𝑑𝑑𝑑𝑑𝑑𝑑𝑑𝑑𝑑𝑑𝑑𝑑𝑑𝑑𝑑𝑑𝑑𝑑𝑑𝑑𝑑𝑑𝑑𝑑𝑑𝑑} 𝑎𝑎𝑎𝑎𝑎𝑎𝑎𝑎𝑎𝑎𝑎𝑎𝑎𝑎𝑎𝑎𝑎𝑎𝑎𝑎𝑅𝑅𝑅𝑅{𝑎𝑎𝑎𝑎𝑎𝑎𝑎𝑎𝑎𝑎𝑎𝑎𝑎𝑎𝑎𝑎 = �evaluation � for the Figure 4 presents results for the two stated datatwo sets.stated Legend Figure 4 presents evaluation results da {𝑎𝑎𝑎𝑎𝑟𝑟𝑟𝑟𝑟𝑟𝑟𝑟𝑟𝑟𝑟𝑟𝑎𝑎𝑎𝑎𝑒𝑒𝑒𝑒}, {𝑎𝑎𝑎𝑎𝑎𝑎𝑎𝑎𝑎𝑎𝑎𝑎𝑎𝑎𝑎𝑎𝑎𝑎𝑎𝑎{𝑎𝑎𝑎𝑎𝑟𝑟𝑟𝑟𝑟𝑟𝑟𝑟𝑟𝑟𝑟𝑟𝑎𝑎𝑎𝑎𝑒𝑒𝑒𝑒}, 𝑎𝑎𝑎𝑎𝑎𝑎𝑎𝑎, 𝑠𝑠𝑠𝑠𝑠𝑠𝑠𝑠𝑎𝑎𝑎𝑎𝑎𝑎𝑎𝑎𝑎𝑎𝑎𝑎𝑎𝑎𝑎𝑎𝑎𝑎𝑎𝑎, 𝑑𝑑𝑑𝑑𝑑𝑑𝑑𝑑𝑑𝑑𝑑𝑑𝑑𝑑𝑑𝑑𝑑𝑑𝑑𝑑𝑑𝑑𝑑𝑑𝑑𝑑𝑑𝑑𝑑𝑑𝑑𝑑} 𝑎𝑎𝑎𝑎𝑎𝑎𝑎𝑎𝑎𝑎𝑎𝑎𝑎𝑎𝑎𝑎𝑎𝑎𝑎𝑎 =� � stated data sets. Legend Figure evaluation results the two 𝑎𝑎𝑎𝑎𝑎𝑎𝑎𝑎𝑎𝑎𝑎𝑎4𝑎𝑎𝑎𝑎𝑎𝑎𝑎𝑎𝑅𝑅𝑅𝑅presents = �{𝑎𝑎𝑎𝑎𝑎𝑎𝑎𝑎𝑎𝑎𝑎𝑎𝑎𝑎𝑎𝑎 �in Figure cardinality the error In for alldispersion. graphs 4, the in x-coordinat 𝑎𝑎𝑎𝑎𝑎𝑎𝑎𝑎𝑎𝑎𝑎𝑎,dispersion. 𝑠𝑠𝑠𝑠𝑠𝑠𝑠𝑠𝑎𝑎𝑎𝑎𝑎𝑎𝑎𝑎𝑎𝑎𝑎𝑎𝑎𝑎𝑎𝑎𝑎𝑎𝑎𝑎, 𝑑𝑑𝑑𝑑𝑑𝑑𝑑𝑑𝑑𝑑𝑑𝑑𝑑𝑑𝑑𝑑𝑑𝑑𝑑𝑑𝑑𝑑𝑑𝑑𝑑𝑑𝑑𝑑𝑑𝑑𝑑𝑑} cardinality and the error In all graphs Figure 4, 𝑅𝑅𝑅𝑅and {𝑎𝑎𝑎𝑎𝑎𝑎𝑎𝑎𝑎𝑎𝑎𝑎𝑎𝑎𝑎𝑎𝑎𝑎𝑎𝑎𝑎𝑎𝑎𝑎𝑎𝑎𝑎𝑎, 𝑠𝑠𝑠𝑠𝑠𝑠𝑠𝑠𝑎𝑎𝑎𝑎𝑎𝑎𝑎𝑎𝑎𝑎𝑎𝑎𝑎𝑎𝑎𝑎𝑎𝑎𝑎𝑎, 𝑑𝑑𝑑𝑑𝑑𝑑𝑑𝑑𝑑𝑑𝑑𝑑𝑑𝑑𝑑𝑑𝑑𝑑𝑑𝑑𝑑𝑑𝑑𝑑𝑑𝑑𝑑𝑑𝑑𝑑𝑑𝑑}
cardinality and the error In all graphs in stated Figuredata 4,shows the x-coordina Figure presents evaluation for the sets. Legend per mills4 of theper relation cardinality, while the two y-coordinate the time mills dispersion. of theresults relation the y-coordinate Figure 4 presents evaluation results for thecardinality, two stated while data sets. Legend item per mills of thereference relation cardinality, thetwo y-coordinate the time Figure 4 presents evaluation results for the data sets. Legend cardinality and the error dispersion. Inwhile all graphs instated Figure 4,shows the x-coordina reference implementation time, meaning that TCFC algorithm finds differ implementation time, meaning that TCFC algori cardinality and the evaluation error dispersion. Infor all graphs in Figuredata 4, thesets. x-coordinate rep Figure 4 mills presents results the Legend item reference implementation time, meaning that TCFC algorithm finds diffe cardinality and the error dispersion. Inwhile alloftwo graphs inparts Figure 4, the per of the relation cardinality, thestated y-coordinate shows theare time statement for all scenarios where parts the graphs are below ax-coordinat 100% lin Figure 4 presents evaluation results for the two stated data sets. Legend item statement for all scenarios where of the graphs be per mills ofand thethe relation cardinality,Inwhile the y-coordinate shows the time spen cardinality error dispersion. all graphs in Figure 4, the x-coordinate rep statement for all scenarios where parts ofreaches the are below afinds 100% lint per mills the relation cardinality, while y-coordinate shows the time reference implementation time, meaning that TCFC algorithm diffe point where the graph exam100M-20% 100% of the referent exe cardinality andof the error dispersion. all graphs in graphs Figure 4, the x-coordinate rep point where theIngraph exam100M-20% reaches 100% of reference implementation time, meaning that TCFC algorithm finds difference per mills theimplementation relation cardinality, while the y-coordinate shows spen pointof where the exam100M-20% ofbelow thethe referent exe reference time, meaning that TCFC finds differ statement allbetween scenarios where parts ofreaches the graphs are a time 100% lin between 12for and 13graph ‰ (i.e. between 1.2(i.e. million and100% 1.3algorithm differences), per mills of the relation cardinality, while the y-coordinate shows the time spen 12 and 13 ‰ between 1.2 million and 1.3 milli statement implementation for all scenariostime, wheremeaning parts of that the graphs are below afinds 100% line. Fo reference TCFC algorithm between 12 and 13 ‰ (i.e. between 1.2 million and 1.3 million differences), statement forreferent allreaches scenarios where parts of the graphs are below a difference 100% line point where the graph exam100M-20% reaches 100% of the referent reaches the execution time for approximately 2.5 ‰ (i.e., 250.000 reference implementation time, meaning that TCFC algorithm finds difference the referent execution time for approximately 2.5exe ‰ point where the graph exam100M-20% reaches 100% of the referent executio statement for all scenarios where parts of the graphs are below a 100% line. Fo reaches the referent time for approximately 2.5 ‰ (i.e., 250.000 point where the graph exam100M-20% reaches 100% of the referent exe between 12 and 13 ‰execution (i.e. between million and 1.3 million differences), 20% to 100% reduces the speed ofof1.2 the process by 80% (approximately). In statement for all scenarios where parts the graphs are below a 100% line. Fo 20% to 100% reduces the speed of the process by 80% (ap between 12 and 13 ‰ (i.e. between 1.2 million and 1.3 million differences), whil point where graph exam100M-20% reaches 100% of the referent executio 20% to the 100% reduces the between speed of100% the process by100% 80% (approximately). between 12 and 13 ‰execution (i.e. 1.2 million and 1.3 million differences), reaches the referent time for approximately 2.5 ‰ (i.e., 250.000 20% differences dispersed with the rate compared to finding differenc point where graph exam100M-20% reaches 100% of ‰ the referent executio 20% differences dispersed with the rate compared to In f reaches the referent execution time1.2 for approximately 2.5 (i.e., 250.000 diffe between 12 and 13 ‰ (i.e. between million and 1.3 million differences), whil differences dispersed with the 100% rate compared todifferences), finding differenc reaches the referent execution time for approximately 2.5 ‰ (i.e., 250.000 20%12 toand 100% reduces the speed ofmillion thein process bymillion 80% (approximately). In between 13 ‰ (i.e. between 1.2 and 1.3 whil Testing was conducted in two different modes: Testing was conducted two different modes: 20% to 100% reduces the speed of the process by 80% (approximately). In the reaches theto referent execution time for ‰ (approximately). (i.e., 250.000 diffe 20% 100% reduces the speed ofapproximately the modes: process by2.5 80% In 20% dispersed withdifferent the 100% rate compared finding differenc reaches thedifferences referent execution time for approximately 2.5 ‰ to (i.e., 250.000 diffe Testing was conducted in two
20
Information Technology and Control
100k differences, as they would all be in the same fragment. Dispersion was varied using 20%, 50% and 100% dispersion. Dispersion of 20% means that the differences are scattered in 20% of the total fragments in the penultimate fragmentation level. Figure 4 presents evaluation results for the two stated data sets. Legend items indicate the names of relations, cardinality and the error dispersion. In all graphs in Figure 4, the x-coordinate represents the number of differences in per mills of the relation cardinality, while the y-coordinate shows the time spent finding differences relative to the reference implementation time, meaning that TCFC algorithm finds differences faster than the referent SELECT statement for all scenarios where parts of the graphs are below a 100% line. For instance, at the top left graph, the point where the graph exam100M-20% reaches 100% of the referent execution time is for the number of errors between 12 and 13 ‰ (i.e. between 1.2 million and 1.3 million differences), while the graph named ispit100M-100% reaches the referent execution time for approximately 2.5 ‰ (i.e., 250.000 differences). Increasing dispersion from 20% to 100% reduces the speed of the process by 80% (approximately). In the same time frame, TCFC finds only 20% differences dispersed with the 100% rate compared to finding differences dispersed with the 20% rate. Testing was conducted in two different modes: 1 non-indexed: both tables without indexes (even primary key constraints), shown in Figure 4(b) and Figure 4(d), and 2 indexed, with indices appropriate to the chosen fragmentation strategy/primary key, shown in Figure 4(a) and Figure 4(c). Graphs show a few common characteristics for all experiments: _ _ For a sufficiently small number of differences, TCFC outperforms the relational engine, i.e. it is faster than the SELECT statement spanning tables from remote servers. _ _ Indices that follows a fragmentation strategy
improve the performance of TCFC.
_ _ Error dispersion, which is closely related to the
fragmentation strategy, significantly affects the performance.
The first observation can also be stated as the follows:
2018/1/47
after a certain point of differences, the TCFC algorithm shows worse results than the relational engine. However, the following applies: __ In DW environment, it is reasonable to expect the number of differences to be small, and that is the scenario that we were targeting. __ Differences of several per mills (where the TCFC
outperforms the reference implementation) relative to hundreds of millions of rows amount to hundreds of thousands or even millions of errors: that is either an evidence of systemic error that will eliminate most of the erroneous rows once corrected, or an unmanageable amount of errors. Either way, with such large row counts, errors in per mills present more than enough work for a person to rectify between two ETL cycles.
__ Even when the number of differences is not small,
the TCFC algorithm is time-constrained. For instance, the threshold can be set to match the referent implementation time.
__ If the assumption that errors remain between ELT
cycles holds, the TCFC will improve over time as it will use previous results.
Finally, one must have in mind that it is often not even possible to write (execute) SQL statements that compare tables from different databases when different vendor’s DBMSs are used. For all the reasons stated above, we believe that the TCFC algorithm is a perfect fit for ETL integration testing, and is potentially a very useful method for large set comparison in general. While carrying out the experiments, different fragmentation strategies were used and it was proved that poor fragmentation strategy can deteriorate the performance of the algorithm. Finding the optimal fragmentation strategy is therefore a task that should be performed with care as it requires knowledge of the data (trends) and fair knowledge of SQL and query optimization techniques. This is somewhat similar to index creation in the relational databases where poorly chosen index can have a negative impact on the performance. In terms of accuracy, the algorithm has proven to be accurate – all differences were found in each run (as mentioned before, there is a miniscule chance of errors being ignored when numbers nullify each other).
Information Technology and Control
2018/1/47
Figure 4 Evaluation results for different data sets and indexing strategies. Legend items indicate the names of the relations, cardinality and the error dispersion
(a) Indexed data, exec time relative to SQL-outer-join
(b) Non-Indexed data, exec time relative to SQL-outer-join
(c) Indexed data, exec time relative to SQL-outer-join
(d) Non-Indexed data, exec time relative to SQL-outer-join
4. Related Work The literature on software testing is vast and comprehensive, but DW and ETL testing has gained far less attention. Though fundamental principles and techniques apply, DW testing differs significantly from the software testing, mainly because DW testing is primarily data oriented (as opposed to program code), and
data volume tends to be large. A thorough overview of DW testing differences can be found in [11], [15-17]. Mookerjea and Malisetty [27] described the main phases of DW testing, outline main challenges in DW testing and propose a set of best practices in ETL and DW testing, as well as Singh [33], while Singh and
21
22
Information Technology and Control
Kawaljeet [34] gave a descriptive classification of data quality problems at all phases of DW project: data sources, data integration, data staging/ETL and DW design. Singh [33] also considered ideal to perform integration testing on real production data, while in Mookerjea and Malisetty [27] authors proposed to base part of the testing activities (those related to incremental load) on mock data. We started our evaluation process with real project data (Information System of Higher Education Institutions in Republic of Croatia – ISVU) [19], but in order to test on large data sets (over 100 million tuples), we proceeded with testing on mock (extrapolated real) data [37]. A number of papers deal with particular aspects of DW testing. For instance, in Thomsen and Pedersen [36] a semi-automatic regression testing framework used to compare data between ETL runs is proposed with the purpose of catching new errors when software is updated. Rodić and Baranović [32] proposed generation of data quality rules and their integration into ETL process. In Santos et al. [28-29], authors attempted to automate the selection and execution of previously identified test cases for loading procedures in BI environments based on a DW. To validate the approach, the authors have developed a unit test framework and conducted an experiment showing reduced test effort when compared with manual execution of test cases or generic framework, such as DBUnit [10]. In Dakrory et al. [6], authors proposed a framework for automating ETL testing for data quality which delivers a wide coverage for data quality testing by framing testing activities within a modular methodology that can be customized according to ETL specificities, business rules, and constraints. In Williams [39], the author employed Data Vault-based Enterprise Data Warehouse and concluded that such an architecture can simplify and enhance various aspects of testing, and curtail delays that are common in DW projects. In a more generic and exhaustive sense, two contributions stand out. Firstly, Golfarelli and Rizzi [14-16] provided a comprehensive view of DW testing addressing the problem from various perspectives. The authors identify the following components to be tested: Conceptual schema, Logical Schema, ETL procedures, Database and Front-end, and introduce the classification of testing activities in terms of “what” is tested (addressing data quality) and “how” it is tested (addressing
2018/1/47
test type, e.g., performance test). They define a comprehensive methodological framework for data mart testing which includes eight phases: Requirement analysis, Analysis and Reconciliation, Conceptual design, Workload refinement, Logical design, Data staging design, Physical design and Implementation. Secondly, ElGamal et al [11-12] brought an extensive overview of DW testing approaches, divided in four categories: software based testing approaches, ETL based, Multi-perspective and CASE-tool based. The authors define a three-dimensional DW testing matrix with regards to where, what and when is tested, and conclude that none of the previous approaches address the entire matrix. Unlike previous approaches, the authors take into consideration different DW architectures and provide a much more detailed and comprehensive description of all test routines to be administered in a DW project. With all that in mind, a generic testing framework based on the generic Kimmon DW architecture including aforementioned routines is proposed. Interestingly, the proposed routines feature overall “record counts” comparisons and “random record comparisons”, probably considering that the overall comparison of records is a very challenging task in a realistic DW environment, where huge amounts of data and heterogeneous database engines are typically found. Moreover, all the aforementioned research envisions record (count) comparison in various stages of ETL/DW project, but none of them comment on how to conduct the comparison. This is where our work nicely fits in, as it provides a detailed algorithmic instruction on how to perform this comparison that is at the foundation of any DW testing system. Krawatzeck et al. [23] identified a gap between scientific approach and the actual implementation in the real-world scenarios and performed an evaluation of open-source DW unit testing tools (e.g., DBUnit [10]) to address that issue, concluding that some promising tools for the DW testing exist, with a preference for the DBFit tool [9] as the only vendor-independent tool. Understandably, ETL/DW testing is also a major topic in the industry. Major vendors provide some sort of testing integrated with their data integration and data quality tools. For instance, Informatica [1] features a “Data Validation Option” tool [7] used to compare two data sets, though no information is provided as to how it is done. Furthermore, there are companies and
Information Technology and Control
tools developed solely for the purpose of testing a DW. The QuerySurge [31] and ETL Validator [8] are commercial CASE tools developed by RTTS and Datagaps companies, respectively, to automate the testing and validation in the Big Data and DW systems. Under ETL process testing, QuerySurge CASE tool offers column-level comparison, table-level comparison and row count comparison. Each of these testing types comes down to automatic generation of SQL queries for comparing pairs of data sets based on row counts or the values of attributes. Row count comparison only determines the number of tuples in comparing pairs of tables and does not indicate tuple(s) that caused the difference. Table-level testing type produces two data sets and subsequently compares them. The only difference between column and table-level testing is that at the column-level only certain attributes can be chosen and compared. Both types of tests can be performed using approach presented in this paper. The advantage of our approach is in speed – a consequence of TCFC algorithm’s feature that only table fragments that may contain differences are inspected. In addition, to the best of our knowledge, none of the available commercial solutions provide a time-constraint feature, which is essential in a DW testing scenario.
5. Conclusion In this paper, we describe an integration testing procedure for a DW environment, with an emphasis on the generic time-constrained algorithm for comparing two tables. The goal of the algorithm is to provide the “global overview” of the data set’s differences in a given time frame. By global overview, we mean that the largest possible set of tables should be examined, at the expense of the completeness of results for any
2018/1/47
single table. Metadata are used to describe data sets, and to configure and steer the algorithm. Both relational and dimensional data models are supported, so that the algorithm can be used to compare data from the various stages of the ETL cycle. The algorithm can use the results from the previous runs to execute more effectively. Parts of the algorithm are formally described, and the overall algorithm is presented in pseudo-code. Evaluation of the algorithm on the real-world data of the project and on TPC-H data set has shown that it outperforms the SQL Server relational engine SELECT statement when the percentage of missing or excess tuples is relatively small, which is a scenario typical of a DW environment. Although we state that the algorithm competes with the relational engine, it actually uses the relational engine and the whole process can be viewed as a query optimization technique: the exhaustive SELECT statement is “broken down” into a set of smaller statements that are trying to pinpoint the unequal fragments. Performing the search with many “small” queries provides additional benefits: the whole process can be gracefully time-constrained and more tables can be inspected to achieve the desired global view of the data, in contrast to a single exhaustive SELECT statement that might spend the entire available time on a single table.
Acknowledgment This work was supported by the Croatian Science Foundation under the project “PROSPER – Process and Business Intelligence for Business Performance” (IP-2014-09-3729) and by the project “Advanced methods and technologies for data science and cooperative systems – DATACROSS” funded from the European Structural and Investment Funds through the Operational Programme Competitiveness and Cohesion 2014-2020, contract no. KK.01.1.1.01.0009.
References 1. 2017 Gartner Magic Quadrant for Data Integration Tools [Online], Gartner. Accessed 15.9.2017. Available: https://www.informatica.com/data-integration-magic-quadrant.html. 2. Ballou, D. P., Pazer, H. L. Modelling Completeness Versus Consistency Tradeoffs in Information Decision Contexts. IEEE Transactions on Knowl-
edge and Data Engineering, 2003, 15(1), 240-243. https://doi.org/10.1109/TKDE.2003.1161595 3. Batini, C., Scannapieca, M. Data Quality Concepts, Methodologies and Techniques. Heidelberg, Berlin, Springer-Verlag, 2006. 4. Cui, Y., Widom, J., Wiener, J. L. Tracing the Lineage of View Data in a Warehousing Environment. ACM Trans-
23
24
Information Technology and Control
2018/1/47
actions on Database Systems (TODS), 2000, 25(2), 179227. https://doi.org/10.1145/357775.357777
Warehouse Testing Approaches. International Journal of Computers & Technology, 2012, 3(3), 381-386.
5. Cui, Y., Widom, J. Lineage Tracing for General Data Warehouse Transformations. The VLDB Journal, 2003, 12(1), 41-58. https://doi.org/10.1007/s00778-002-0083-8
18. Heinrich, B., Klier, M. A Novel Data Quality Metric for Timeliness Considering Supplemental Data. 17th European Conference on Information Systems (ECIS), Verona, 2009.
6. Dakrory, S. B, Mahmoud, T. M., Ali, A. A. Automated ETL Testing on the Data Quality of a Data Warehouse. International Journal of Computer Applications, 2015, 131(16), 9-16. 7. Data Validation Option for PowerCenter (DVO) [Online]. Informatica. Accessed 15.9.2017. Available: https://www.informatica.com/services-and-training/ informatica-university/find-training/data-validation-option-for-powercenter-dvo/ondemand.html. 8. Datagaps ETL Validator [Online]. Datagaps. Accessed 15.9.2017, Available: http://www.datagaps.com/etl-testing-tools/etl-validator. 9. DbFit Test-Driven Database Development [Online]. DbFit. Accessed 15.9.2017, Available: http://dbfit.github. io/dbfit/index.html. 10. DBUnit [Online]. Accessed 15.9.2017. Available: http:// dbunit.sourceforge.net/. 11. ElGamal, N. Data Warehouse Testing. PhD Dissertation, Cairo University, Faculty of Computers and Information, Information Systems Department, 2015.
19. Information System of Higher Education Institutions in Republic of Croatia – ISVU, [Online]. University of Zagreb Faculty of Electrical Engineering and Computing. Accessed 15.9.2017. Available: http://www.isvu.hr 20. Jarke, M., Lenzerini, M., Vassiliou, Y., Vassiliadis, P. Fundamentals of Data Warehouses. Berlin, Springer-Verlag, 2000. https://doi.org/10.1007/978-3-662-04138-3 21. Kaiser, M. A Conceptional Approach to Unify Completeness, Consistency and Accuracy as Quality Dimensions of Data Values. European and Mediterranean Conference on Information Systems, Abu Dhabi, UAE, 2010, 1-17. 22. Kimball, R., Ross, M. The Data Warehouse Toolkit: The Complete Guide to Dimensional Modelling (Second Edition), John Wiley & Sons, 2002. 23. Krawatzeck, R., Tetzner, A., Dinter, B. An Evaluation of Open Source Unit Testing Tools Suitable for Data Warehouse Testing. PACIS, 2015. 24. Mathen, M. Data Warehouse Testing. DeveloperIQ Magazine, 2010.
12. ElGamal, N., El-Bastawissy, A., Galal-Edeen G. An Architecture-Oriented Data Warehouse Testing Approach. 21st International Conference on Management of Data (COMAD), Pune, India, 2016, 24-34.
25. Mekterović, I., Brkić, Lj., Baranović, M. Improving the ETL Process and Maintenance of Higher Education Information System Data Warehouse. WSEAS Transactions on Computers, 2009, 8(10), 1681-1690.
13. Even, A., Shankaranarayanan, G. Utility-Driven Assessment of Data Quality. The DATA BASE for Advances in Information Systems, 2007, 75-93. https://doi. org/10.1145/1240616.1240623
26. Mekterović, I., Brkić, Lj., Baranović, M. A Generic Procedure for Integration Testing of ETL Procedures. Automatika, 2011, 52(2), 169-178.
14. Golfarelli M., Rizzi S. A Comprehensive Approach to Data Warehouse Testing. DOLAP'09 Proceedings of the ACM 12th International Workshop on Data Warehousing and OLAP, Hong Kong, China, 2009, 17-24. https:// doi.org/10.1145/1651291.1651295 15. Golfarelli, M., Rizzi, M. Data Warehouse Testing: A Prototype-Based Methodology. Information and Software Technology, 2011, 53(11), 1183-1198. https://doi. org/10.1016/j.infsof.2011.04.002 16. Golfarelli, M., Rizzi, S. Data Warehouse Testing. Developments in Data Extraction, Management, and Analysis, 2013, 91-108. https://doi.org/10.4018/978-1-46662148-0.ch005 17. Gupta, S. L., Pahwa, P., Mathur, S. Classification of Data
27. Mookerjea, A., Malisetty, P. Data Warehouse/ETL testing: Best Practices [Online]. Accessed 15.9.2017. Available: http://test2008.in/Test2008/pdf/Anandiya%20et%20al%20-%20Best%20Practices%20in%20 data%20warehouse%20testing.pdf, 2008. 28. Santos, I., Nascimento, A., Costa, J., Júnior, M. Experimentation in the Industry for Automation of Unit Testing in a Business Intelligence Environment. The 28th International Conference on Software Engineering and Knowledge Engineering (SEKE), Redwood City, USA, 2016, 466-469. https://doi.org/10.18293/SEKE2016-182 29. Santos, I., Costa, J., Júnior, M., Nascimento, A. Experimental Evaluation of Automatic Tests Cases in Data Analytics Applications Loading Procedures. Proceedings of the 19th International Conference on Enterprise Information Systems (ICEIS), 2017, 1, 304-311. https://
Information Technology and Control
doi.org/10.5220/0006337503040311 30. Pipino, L. L., Lee, Y. W., Wang, R. Y. Data Quality Assessment. Communications of the ACM, 2002, 45(4), 211218. https://doi.org/10.1145/505248.506010 31. QuerySurge: Automate Your Big Data & Data Warehouse Testing and Reap the Benefits [Online]. QuerySurge. Accessed 15.9.2017. Available: http://www.querysurge.com/. 32. Rodić, J., Baranović, M. Generating Data Quality Eules and Integration into ETL Process. Proceedings of the 12th International Workshop on Data Warehousing and OLAP (DOLAP 2009), Hong Kong, 2009, 65-72.
2018/1/47
35. SQL Data Examiner [Online]. TulaSoft. Accessed 15.9.2017. Available: http://www.sqlaccessories.com/ sql-data-examiner/. 36. Thomsen, C., Pedersen, T. B. ETLDiff: A Semi-Automatic Framework for Regression Test of ETL Software. International Conference on Data Warehousing and Knowledge Discovery, DaWaK 2006, Krakow, Poland, 2006, 4081, 1-12. https://doi.org/10.1007/11823728_1 37. TPC-H [Online]. TPC. Accessed 15.9.2017. Available: http://www.tpc.org/tpch/default.asp.
33. Singh, A. ETL Testing: Best Practices. Software Testing Conference, Bangalore, India, 2010.
38. Wang, R. Y., Reddy, M. P., Kon, H. B. Toward Quality Data: An Attribute-based Approach. Decision Support Systems, 1995, 13(3-4), 349-372. https://doi. org/10.1016/0167-9236(93)E0050-N
34. Singh, R., Kawaljeet, S. A Descriptive Classification of Causes of Data Quality Problems in Data Warehousing. International Journal of Computer Science Issues, 2010, 7(3), 41-50.
39. Williams, C. Experimentation with Raw Data Vault Data Warehouse Loading. Proceedings of the Southern Association for Information Systems Conference, St. Augustine, FL, USA, March 18-19, 2016, 1-6.
25