Hindawi Publishing Corporation ISRN Communications and Networking Volume 2014, Article ID 259831, 15 pages http://dx.doi.org/10.1155/2014/259831
Research Article A Traffic Cluster Entropy Based Approach to Distinguish DDoS Attacks from Flash Event Using DETER Testbed Monika Sachdeva and Krishan Kumar Department of Computer Science and Engineering, Shaheed Bhagat Singh State Technical Campus, Ferozepur, Punjab 152004, India Correspondence should be addressed to Monika Sachdeva;
[email protected] Received 8 February 2014; Accepted 23 March 2014; Published 13 May 2014 Academic Editors: G. Mazzini and H.-M. Sun Copyright © 2014 M. Sachdeva and K. Kumar. This is an open access article distributed under the Creative Commons Attribution License, which permits unrestricted use, distribution, and reproduction in any medium, provided the original work is properly cited. The detection of distributed denial of service (DDoS) attacks is one of the hardest problems confronted by the network security researchers. Flash event (FE), which is caused by a large number of legitimate requests, has similar characteristics to those of DDoS attacks. Moreover DDoS attacks and FEs require altogether different handling procedures. So discriminating DDoS attacks from FEs is very important. But the research involving DDoS detection has not laid enough emphasis on including FEs scenarios in the experiments. In this paper, we are using traffic cluster entropy as detection metric not only to detect DDoS attacks but also to distinguish DDoS attacks from FEs. We have validated our approach on cyber-defense technology experimental research laboratory (DETER) testbed. Different emulation scenarios are created on DETER using mix of legitimate, flash, and different types of attacks at varying strengths. It is found that, when flash event is triggered, source address entropy increases but the corresponding traffic cluster entropy does not increase. However, when DDoS attack is launched, traffic cluster entropy also increases along with source address entropy. An analysis of live traces on DETER testbed clearly manifests supremacy of our approach.
1. Introduction Denial of service (DoS) attacks attempt to make Internet resources as well as services unavailable to its intended users. A very common method of DoS attack involves saturating the victim machine with external communication requests such that it cannot respond to legitimate traffic. Moreover, distributed denial of service (DDoS) attacks attempt to do so by sending these external requests from many compromised machines (zombies, daemons, agents, slaves, etc.) distributed around the world. These legitimate looking requests bring down the victim server by consuming scarce resources, for example, CPU cycles, memory, and bandwidth of the victim machine or network. DDoS attacks are launched almost every day. Even the most prominent websites like Twitter, Facebook, Google, and so forth could not escape themselves from being hit by it, which caused millions of their users to be affected. The most eye opener cases were the DDoS incidents that targeted White House, Federal Trade Commission, Department of the Treasury Washington Post, and the New York Stock exchange, NASDAQ. Despite
the fact that a lot of defence has been proposed in the past few years [1, 2], accurately detecting DDoS remains an unsolved problem. The problem of DDoS detection is further worsened due to a very similar situation on the Internet called flash event (FE) in which a large number of legitimate clients simultaneously access a web server. This can overload web server, which may then be unable to deal with any requests. The overload situation persists because legitimate users continue to send requests in an attempt to access the overloaded server. Thus the website becomes inaccessible. This is a particular problem for stock trading sites, online ticketing sites, sports betting sites, news portals, and government emergency information sites. The impact of both DDoS attacks and FEs is either complete disruption of services or large latencies due to overloading of scarce resources. The attackers exploit this phenomenon by creating crafty attacks which hide themselves in FEs. Ideally DDoS attacks should be detected and characterized attack traffic must be filtered whereas extra provisioning of resources or efficient content distribution is required to handle increased load of legitimate requests in case of FEs. So detecting and
2
ISRN Communications and Networking
then discriminating both DDoS and FEs are very important activities for network administrators. In an effort to detect and discriminate DDoS attacks and FEs, the characteristics of both are studied in detail. After analyzing various FE traces, Jung et al. [3] have found that during FEs most of the requests are generated either from those clients who have visited before or from those clients who belong to the same networks or administrative domains from where the requests were already generated. Krishnamurthy and Wang [4] state that the traffic generated from the same networks or administrative domains are treated as traffic clusters. In this work, traffic clusters are defined based on the same initial 16 or 24 bits; that is, two source addresses with the same 16 or 24 initial bits are grouped in the same 16-bit or 24-bit traffic cluster, respectively. The 16-bit and 24-bit traffic cluster dispersion is computed using Shannon entropy. It is found that, for both DDoS attacks and FEs, source address entropy of clients increases whereas traffic cluster entropy increases substantially only for DDoS attacks. The approach is validated using live-traffic experimentation on DETER testbed which involves actual network of nodes acting as severs, legitimate and attack clients, network devices, and links for emulating desired network configuration. A careful investigation of our emulation based experiments in DETER testbed clearly reveals that, for almost the same volume of traffic in FE and DDoS, our approach is able to detect attacks precisely. The major contributions of the paper are as follows: (i) an in-depth study of flash events, its characteristics, and its comparison with DDoS attacks; (ii) conceptualizing traffic cluster entropy from source address entropy as detection metric to discriminate between DDoS and FEs; (iii) exploring DETER testbed facility for evaluation of DDoS detection schemes; (iv) design of experiment methodology and scenarios for evaluating DDoS detection on DETER testbed; (v) analysis of DETER testbed traces for discriminating DDoS attacks from FEs and manifesting supremacy of traffic cluster entropy approach as compared to volume based approaches. The rest of the paper is organised as follows. Section 2 presents in-depth study of FEs. A review of current literature is given in Section 3. Section 4 describes emulation environment, that is, DETER testbed that we have used for evaluation of our work. The proposed approach is explained in Section 5. Section 6 describes experimental setup in detail. Section 7 highlights results and discussion with rigor of arguments. Finally, Section 8 concludes our paper with outline of future work.
2. Flash Events The term “flash-crowd” was first used in a short sciencefiction story by Niven [5]. The story talks about the invention of a transfer booth that could take one anywhere on earth almost instantly. The designers of this booth however did
not anticipate thousands of people simultaneously visiting the scene of any event reported in the news, resulting in chaos and confusion. Something similar can happen on the Web, when the news about an event can result in a large number of users suddenly trying to access a new or popular website. Some of these events are predictable, like specific competitions at the Olympic Games or the US Presidential Elections; others like epidemics or terrorist attacks are not. When a website is not prepared for the enormous growth in demand it might lead to significant delays, requests not reaching it, and eventually complete failure. Thus flash event (FE) refers to a situation in which a large number of users simultaneously access a computer server. The computer server that experiences very high load during the event could be a popular web server, for example, the official Olympic website during the Olympic Games, some important news released on a web site, for example. September 11 attack, the result declared on a university website, a course registration server at the beginning of a school semester, and so forth. A flash event at a website can be predictable when a site is aware of the possibility of its occurrence. A common example is the online playalong website for a popular television program. The website typically does not receive many requests during the time the television show is not being broadcast and experiences a significant surge for the duration of the broadcast. A website can provision in advance such flash events and handle them better. Another looser kind of predictable flash event is one where the content creator knows a priori that traffic volume is going to be significantly higher. For example, URLs that are advertised specifically during an event (such as widely followed football games) can lead to expected high levels of traffic. The unpredictable category of flash events often arises due to the sudden prominence of a website unanticipated by the content owners. Medical websites may experience a sudden surge as a result of public concern over an epidemic. Alternately, a website that is discussed in another popular website may experience a flash event. While websites can try to provision the predictable flash events, they often fail to correctly predict the demand, as several well planned events (such as the Victoria Secret webcast) could attest. Even when a website has prior knowledge that its site is going to experience a surge in demand, it may not have enough time to react and provision the necessary resources. The issue is complicated by competitive pressure where various sites are planning to display similar content (such as a major news story). Both predictable and unpredictable flash events can thus pose a serious risk to a website. The characteristics of FEs are as follows. (i) The most important characteristic of FEs is that it is created by legitimate users. (ii) The server experiences unusual high traffic as stated by Park et al. [6]. (iii) FEs cause slow responses and connection drops and may eventually completely disrupt the service. (iv) In the case of FEs, the server administrator may want to quickly enable or increase the number of CDNs (content distribution networks), apply load sharing
ISRN Communications and Networking mechanisms, provide extra resources, and so forth, so that more users can be accommodated. (v) During FEs most of the client requests are generated either from those clients who have visited before or from those clients who belong to the same networks or administrator domains from where the requests were already generated. (vi) In FEs, the number of unique traffic clusters is much less compared to source addresses. (vii) Request generation rate per client decreases during FEs due to congestion on server as clients follow normal congestion and flow control signals and decrease their rate as per connection dropout or retransmissions. On the other hand, tricky DDoS attackers tend to hide their scrupulous traffic in FEs by using the same legitimate protocols and injecting almost the same amount of traffic towards victim server. So discriminating FEs from DDoS attacks is a severe problem. However, following comparison between FEs and DDoS given by Jung et al. [3] is complemented with rigour of arguments that provide us with useful pointers to distinguish between the two in the present level of sophistication of attackers. In a nutshell, there are peculiar characteristics of the FEs that are different from DDoS attacks but attackers are so sophisticated and collaborative that they are evolving new types of attacks every day to escape from even observant defenders. So defenders should be able to think a point ahead and then only they will be successful. However in the literature, researchers have not chosen scenarios where it is obvious that their approach can fail. So while computing various thresholds and depicting performance metrics these unfavourable scenarios should also be taken into account. On the other hand keeping in mind the sophistication of attackers, computation complexity of detection algorithms, and minimum possible overheads, the distribution of traffic cluster is the most potent pointer for detection of DDoS attacks and discriminating the same from FEs.
3. Related Work As per report [7], shorter, higher-speed DDoS attacks are on the rise. DDoS detection methods comprise activity profiling as suggested by Feinstein et al. [8] and Moore et al. [9], sequential change point detection as proposed by Blazek et al. [10], Brooks [11], Chen and Hwang [1], and Wang et al. [12], wavelet analysis as proposed by Barford et al. [13], and chi-square/entropy detector proposed by Feinstein et al. [8] and Kumar et al. [2]. All these techniques are based on the characteristics of specific DDoS attacks. Unfortunately, it is very easy for attackers to change these characteristics to deceive detection methods. Attackers can change the TTL value of the attack packets according to the real hop distance between zombies and victim, respectively, in order to fool our hop-count detection methods proposed by Wang et al. [12]. Alomari et al. [14] have tried to predict number of zombies using Pace Regression Model. Yi et al. [15] and Feinstein
3 et al. [8] have used statistical approach as detection metric for DDoS attack. They use the characteristic of uniformity of distribution of source IP addresses during DDoS attacks and identify DDoS attacks with the help of chi-square statistics and entropy. However, during FEs, as the number of legitimate hosts suddenly increases, source address entropy also increases which can wrongly indicate presence of DDoS attacks. Chen and Hwang [1] distinguish flash crowds from DDoS flows using the change point detection method, but this method can be cheated easily; for example, zombies can increase the number of attack packets very slowly, which will almost surely disable the change point detectors. Yu et al. [16] have used information distance to detect as well as distinguish DDoS attacks from flash event. But detection accuracy is low. As per Bhatia et al. [18], DDoS attacks and flash crowds have similar features, and we have to differentiate them effectively; otherwise, we may end up with a lot of false alarms. As per survey of Carl et al. [19], Chen and Hwang [1], and Jung et al. [3], it is a big challenge for us to discriminate DDoS flooding attacks from flash events and the results are serious if we cannot differentiate them. On the one hand, attackers can mimic the traffic features of flash crowds to disable our detectors. On the other hand, our detectors may treat the legitimate flash events as DDoS attacks. In one of the recent efforts by Chen et al. [20], a nonparametric CUSUM approach is used to find commutative deviation which is noticeably higher than random fluctuations. But in case of crafty attacks by shrewd attackers, the total traffic generated is so low that it either matches flash traffic or is exactly equal to legitimate traffic only. In these scenarios almost all volume based approaches, for example, proposed by Gil and Poletto [17] and Barford et al. [13], are going to fail. We have proposed a mechanism to distinguish between FE and DDoS attacks using traffic cluster entropy. Even sneaky attackers cannot escape as in case of attacks, even though volume may exactly match flash, but still it will be able to discriminate between attacks and FE based on the distribution of traffic clusters.
4. Emulation Environment There are three experimental techniques used in the design and validation of new and existing networking ideas: live network testing, simulation, and emulation. All three techniques have unique benefits and drawbacks. However, they need not be viewed as competing techniques; rather using more than one technique can help validate ideas better than using any one technique alone. Live network testing is not possible for detection of DDoS attacks because of the following reasons: Testing is possible very late in the development cycle; often difficult or too expensive to create a real test environment of any significant size; real environment tests also tend to not be reproducible, making it difficult to analyze problems when found. Simulation provides a repeatable and controlled environment for network experimentation. It is easy to configure and allow a protocol to be constructed at some level of abstraction, making simulation a rapid prototype and evaluation environment. Ease of use also allows for exploration of large parameter spaces. On the other
4
ISRN Communications and Networking User
ISI cluster
User files
“User” server
CCNC
Internet
FW
Router with firewall
“Boss” server
Control network IP sec
PC
PC · · ·
UCB cluster
Control network PC · · ·
PC
PC
IP sec CISCO and Nortel switch
Foundry and Nortel switch
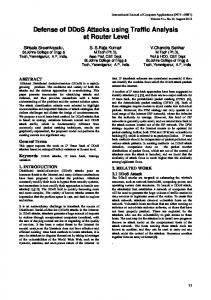
Figure 1: Architecture of DETER testbed.
hand in case of simulation the hosts, network devices, and operating systems are not real so results differ considerably from actual one. Moreover synthetic environment may also poorly represent real one. Network emulation used by [21–24] is a hybrid approach that combines real elements of a deployed networked application such as end hosts and protocol implementations with synthetic, simulated, or abstracted elements. These abstracted elements can be network links, intermediate nodes, background traffic, and so forth depending on the experimenter’s needs and the available resources. A fundamental difference between simulation and emulation is that while the former runs in virtual simulated time, the latter must run in real time. Another important difference is that it is impossible to have an absolutely repeatable order of events in emulation. That is due to its real time nature and a physically distributed computation infrastructure. We have used cyber defense technology experimental research network DETER testbed to evaluate our approach. Even Carl et al. have recommended using DETER testbed to evaluate cyber defence techniques as a step towards standardization. DETER is an emulation testbed based on Emulab that allows researchers to evaluate Internet security technologies as stated by Benzel et al. [25]. Though a simple testbed can be constructed by manually wiring together and configuring a dedicated set of machines; however, such a testbed lacks generality and share-ability. DETER belongs to the more useful class of testbed and it is general-purpose, shared, and remotely accessible by experimenters. To support a large community of users, the testbed hardware can be partitioned into independent and isolated experimental testbed, which can be used simultaneously. DETER is composed of two clusters of experimental PC nodes, at ISI and at UC Berkeley, with a common control plane as shown in Figure 1. There are roughly 300 nodes in total, currently. The Emulab control software for DETER is configured to place nodes at the two sites in separate logical pools. An experiment can allocate nodes from either
one or both clusters. These nodes are interconnected by a “programmable backplane” of high-speed Ethernet switches, trunked to form a single logical switch. Each experimental PC has four experimental interfaces and one control interface to this switch. To create the topology specified by the experimenter, the Emulab control software on the “Boss” server allocates PC nodes to experiments and interconnects them by setting up VLANs in the switches. High-capacity switch hardware is used to avoid experimental artefacts caused by interference between VLANs. In order to make DETER’s capabilities accessible to users at all skill levels, a security experimentation environment (SEER) is provided. SEER consists of a Java based front-end GUI and a set of services that collectively give researchers the ability to create, plan, and execute their experiments. SEER interacts with the DETER control plane to identify and (if required) request the resources for the experiment. It then integrates a set of tools within the experiment context through which researchers create, configure, and control their experiments. Further, it enables repeatability by facilitating experimenters to rerun experiments with minimum effort, either verbatim or with controlled variation of parameters when exploring several dimensions of the evaluation space. Researchers can create a large range of experiment scenarios with relative ease. SEER integrates various tools for configuring and executing experiments and provides a user-friendly interface for experimenters to use the tools. Various tools required for any security experiment are as follows: (i) network infrastructure configuration; (ii) generation of background traffic and activity in the test network; (iii) simulation of attacks; (iv) deployment and management of defense mechanisms; (v) instrumentation and data collection; (vi) data analysis and visualization. A security experiment may need some or all of these building blocks. Currently SEER consists of a library of background traffic modules, a suite of network service modules, and a library of DDoS attack tools. The background traffic generation module supports generation of various traffic types including ICMP Echo, DNS, HTTP, FTP, SSH, IRC, and VOIP traffic. The frequency of the client service requests, the data sizes of the requests and the replies, and duration of the connection can be specified using common statistical distributions including the Pareto, Gamma, or Exponential distributions. It also contains a library of DDoS attack tools that can reproduce a repertoire of DDoS attacks commonly occurring on the Internet. It also provides data collection and analysis tools so that we can analyse the different emulation scenarios we have created using background traffic and DDoS attack generation tools. The deployment and management of defence mechanisms are, however, under development at this stage.
ISRN Communications and Networking
5 Src IP
Tc16 id1
Src IP1
Count
Tc24 id = src IP and 255.255.255.0
Tc16 id = src IP and 255.255.00
Source IP
Count
Src IP2
Tc16 id2
Count
NULL
Count
NULL
NULL
Count
Tc24 id2
Count
Tc24 id1
Figure 2: Formation of clusters.
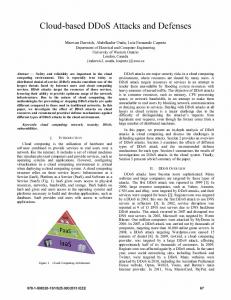
5. Proposed Approach An anomaly based approach to detect DDoS attack and to discriminate it from FE is proposed in this paper. Clearly first a baseline behaviour of the system is required and then the same is compared with actual behaviour. If actual behaviour significantly deviates from normal behaviour then we raise an alarm for attack. Shannon entropy has been used to conceptualize source address entropy and traffic cluster entropy. The source address entropy and traffic cluster entropy are compared in different scenarios: normal and DDoS attacks and normal and flash. Basic terminology and symbols used are explained below. Source IP Address (𝑠𝑟𝑐 𝐼𝑃). A 4-byte logical address is used in the packets to represent its source IP. Traffic Cluster (𝑡𝑐). The traffic generated from the same networks or administrative domains is defined as traffic cluster. 16-Bit Traffic Cluster Identifier (𝑡𝑐16 𝑖𝑑). All the packets which share the same initial 16 bits of their 𝑠𝑟𝑐 𝐼𝑃 are in the same group called 16-bit traffic cluster. It is obtained by bit-wise AND operation of 𝑠𝑟𝑐 𝐼𝑃 and 16-bit mask, that is, 255.255.0.0. A unique identifier assigned to such a traffic group or cluster is defined as 16-bit traffic cluster identifier. 24-Bit Traffic Cluster Identifier (𝑡𝑐24 𝑖𝑑). All the packets which share the same initial 24 bits of their 𝑠𝑟𝑐 𝐼𝑃 are in the same group called 24-bit traffic cluster. It is obtained by bit-wise AND operation of 𝑠𝑟𝑐 𝐼𝑃 and 24-bit mask, that is, 255.255.255.0. A unique identifier assigned to such a traffic group or cluster is defined as 24-bit traffic cluster identifier. Formation of different clusters from source address is shown in Figure 2. Source Address Entropy 𝐻(𝑠𝑟𝑐 𝐼𝑃). Shannon and Weaver [26] have defined sample entropy as a metric that captures the degree of dispersal or concentration of distribution of a random variable. Let the random variable 𝑠𝑟𝑐 𝐼𝑃
take values {𝑠𝑟𝑐 𝐼𝑃1 , 𝑠𝑟𝑐 𝐼𝑃2 , 𝑠𝑟𝑐 𝐼𝑃3 , . . . , 𝑠𝑟𝑐 𝐼𝑃𝑛 } in different packets. Let number of packets received per 𝑠𝑟𝑐 𝐼𝑃 be {𝑋1 , 𝑋2 , 𝑋3 , . . . , 𝑋𝑛 }, respectively. Then as per Shannon criteria sample entropy is 𝑛
𝐻 (𝑠𝑟𝑐 𝐼𝑃) = − ∑ 𝑝 (𝑠𝑟𝑐 𝐼𝑃𝑖 ) × log2 𝑝 (𝑠𝑟𝑐 𝐼𝑃𝑖 ) .
(1)
𝑖=1
Here the probability of occurrence of 𝑠𝑟𝑐 𝐼𝑃, that is, 𝑃 (𝑠𝑟𝑐 𝐼𝑃) = {𝑝 (𝑠𝑟𝑐 𝐼𝑃1 ) , 𝑝 (𝑠𝑟𝑐 𝐼𝑃2 ) ,. . . ,𝑝 (𝑠𝑟𝑐 𝐼𝑃𝑛 )} , (2) is computed as 𝑝(𝑠𝑟𝑐 𝐼𝑃𝑖 ) = 𝑋𝑖 /𝑆 where 𝑆 = ∑𝑛𝑖=1 𝑋𝑖 . Traffic Cluster Entropy 𝐻(𝑡𝑐 𝑖𝑑). Let the random variable 𝑡𝑐 𝑖𝑑 take values {𝑡𝑐 𝐼𝐷1 , 𝑡𝑐 𝐼𝐷2 , 𝑡𝑐 𝐼𝐷3 , . . . , 𝑡𝑐 𝐼𝐷𝑚 } in different packets. Let number of packets received per 𝑡𝑐 𝑖𝑑 be {𝑌1 , 𝑌2 , 𝑌3 , . . . , 𝑌𝑚 }, respectively. Then as per Shannon criteria traffic cluster entropy is 𝑚
𝐻 (𝑡𝑐 𝐼𝐷) = − ∑ 𝑝 (𝑡𝑐 𝐼𝐷𝑖 ) × log2 𝑝 (𝑡𝑐 𝐼𝐷𝑖 ) .
(3)
𝑖=1
Here the probability of occurrence of 𝑡𝑐 𝐼𝐷, that is, 𝑃 (𝑡𝑐 𝐼𝐷) = {𝑝 (𝑡𝑐 𝐼𝐷1 ) ,𝑝 (𝑡𝑐 𝐼𝐷2 ) ,... . . .𝑝 (𝑡𝑐 𝐼𝐷𝑚 )} , (4) is computed as 𝑝(𝑠𝑟𝑐 𝐼𝐷𝑖 ) = 𝑌𝑖 /𝑆 where 𝑆 = ∑𝑚 𝑖=1 𝑌𝑖 . Equation (3) is used to compute 16-bit traffic cluster entropy 𝐻(𝑡𝑐16 𝐼𝐷) and 24-bit traffic cluster entropy 𝐻(𝑡𝑐24 𝐼𝐷) by finding 16-bit and 24-bit traffic clusters, respectively. Figure 4 shows computation of value of entropy when a particular cluster (i.e., either from source ip cluster, from 24-bit traffic cluster, or from 16-bit traffic cluster) is inputted. In our approach, the packets destined to the protected web server 𝑊𝑠 are monitored at the access router 𝑅access as shown in Figure 3 system diagram. Packets are monitored in a short sized time window {𝑡−Δ, 𝑡} to minimize memory overheads. Here Δ seconds is the size of time window. At time 𝑡, the monitoring process yields packets
6
ISRN Communications and Networking
Traffic monitoring and entropy computation
Edge router
Attacker
Legitimate client
Web server Ws
Legitimate traffic
Access router
Core router
Customer domain
Link between PoP and web server
Attack traffic
Figure 3: System diagram.
arrival distribution of 𝑠𝑟𝑐 𝐼𝑃 and 𝑡𝑐 𝑖𝑑. Then the probability of occurrence of each 𝑠𝑟𝑐 𝐼𝑃 and 𝑡𝑐 𝐼𝐷, that is, 𝑃(𝑠𝑟𝑐 𝐼𝑃) and 𝑃(𝑡𝑐 𝐼𝐷), is, respectively, computed. In the next step source address entropy 𝐻(𝑠𝑟𝑐 𝐼𝑃) and traffic cluster entropies 𝐻(𝑡𝑐16 𝐼𝐷) and 𝐻(𝑡𝑐24 𝐼𝐷) are computed for the time window {𝑡 − Δ, 𝑡} as per flowchart in Figure 4. If there is no significant increase in 𝐻(𝑠𝑟𝑐 𝐼𝑃) as well as 𝐻(𝑡𝑐16 𝐼𝐷) and 𝐻(𝑡𝑐24 𝐼𝐷), it signifies legitimate traffic as during normal event a number of traffic sources and network domains do not vary much. But during FE the number of traffic sources increases; however, there is less variation in network domains. So a significant increase in 𝐻(𝑠𝑟𝑐 𝐼𝑃) and minor variations in 𝐻(𝑡𝑐16 𝐼𝐷) and 𝐻(𝑡𝑐24 𝐼𝐷) are the signs of FE. But if there is appreciable increase in 𝐻(𝑠𝑟𝑐 𝐼𝑃) as well as in 𝐻(𝑡𝑐16 𝐼𝐷) and 𝐻(𝑡𝑐24 𝐼𝐷), it means DDoS attack has happened because a large number of zombies send traffic from different parts of the Internet belonging to different network domains.
6. Experiment Setup Emulation is used for conducting the experiments as it provides much higher fidelity compared to simulation as observed by Chertov et al. [27]. Further, real security appliances (e.g., off-the-shelf hardware) can be tested on it. This can expose unforeseen implementation vulnerabilities, protocol interactions, and resource constraints. This is because an emulation testbed uses real devices with limited resources, and real applications and operating systems running on them, to faithfully represent every host in an experiment. Flaws and
vulnerabilities are not abstracted by a simplified or idealized simulation model. Various emulation scenarios are created using DETER testbed. DETER has assigned various nodes to conduct our experiment. The configuration of our testbed setup is as follows. (1) Testbed Setup. One has the following. Machine Specifications. On the DETER testbed, Intel(R) CPU X3210 quad core processor running at 2.13 Ghz with 4 GB of RAM and Dual 3Ghz Intel Xeon processors are provided for the experiments. Both machine types have Intel Pro/1000 cards. All nodes ran Linux FC4-STD with IRQ driven packet processing, thus being susceptible to receive livelock. The default NIC driver is e1000-5.2.30.1-k1 on DETER. Link Delays. Dual Pentium 4 Xeon 2.8 GHz machines with PCI-X, running SMP, and polling-enabled Linux FBSD62-STD are selected to act as delay nodes on DETER. (2) Experiment Methodology. The methodology to conduct the experiments is outlined in Figure 5. It starts with generation of topology which is augmented with traffic generation at various nodes. The traffic is monitored at access router 𝑅access near the server 𝑊𝑠 . The traffic trace from access router is retrieved and stored at users servers and then is transferred to our machine for further analysis. After preprocessing the traces, 𝐻(𝑠𝑟𝑐 𝑖𝑝) and 𝐻(𝑡𝑐 𝑖𝑑) are computed.
ISRN Communications and Networking
Start
TPA total packets arrived
cluster {source IP, tc16 id, tc24 id}
7 Write the TCL script compatible for testbed experiments and upload on the testbed nodes.
Topology having active nodes with FC4 OS Input cluster and TPA Generate the legitimate web traffic on specified nodes by using the SEER GUI. Sum = 0 Normal and flash traffic on the network ptr = cluster
Generate the attack traffic on specified nodes using the SEER GUI’s attack distributions. Normal and attack packets on the network
Loop Monitor the traffic with and without attack. pi = ptr → count/TPA term = pi ∗ log(pi)
Save the tcpdump files on the nodes
Sum = sum + term
SSh to nodes to transfer tcpdump files to users server located at DETER testlab. Files transferred to users server
ptr = ptr → next
ent = −sum
Use WinSCP to transfer tcpdump files from user server to our machine. Files transferred to our machine Open and explore tcpdump files using Coralreef.
Return ent Dumpfiles comprising timeline of packet information Stop
Extraction of timestamp and source address from dumpfiles using perl scripts.
Figure 4: Flowchart for computation of entropy.
(3) Topology Generation Script. The TCL script used for generation of experimental topology is given in Algorithm 1. The generated topology using this TCL script is given in Figure 6. (4) Basic Topology Generation Parameters. Basic topology parameters used for generation of topology are given in Table 2. (5) Traffic Parameters. Basic traffic generation parameters are given in Table 3.
7. Results and Discussion Carl et al. [19] have reviewed various DDoS detection methods and have highlighted that most of these methods are under test and only favourable scenarios are included in their validations. A thrust is required to include flash events that closely mimic attack activity in all tests so that real worth of the detection scheme is marked. In this paper, various emulation scenarios having background normal and flash traffic with different types of DDoS attacks are tested
Analysis of captured files using network and source address entropy algorithm.
Figure 5: Experiment methodology.
(Table 1). Traffic received and sent by server and source as well as traffic cluster entropy is depicted in our results for all the emulation scenarios. The details of emulation scenarios are given below. 7.1. Normal Traffic. In this emulation scenario, 40 clients distributed in 8 LANs generate HTTP traffic destined towards web server. The distribution of normal traffic is given in Table 3. The traffic is monitored at access router. As the number of packets generated by individual clients per unit time is not the same, computed source address entropy is less than maximum source address entropy. The computed source entropy is in range of 4.03 to 4.13 (shown in Figure 7(b)). The normal traffic sent and received by the server is 200–250 kbps as shown in Figure 7(a). The computed traffic cluster entropy
8
ISRN Communications and Networking
set ns [new Simulator] source tb compat.tcl #Create the topology nodes Foreach node { S R0 R1 R2 R3 R4 L1 L2 L3 L4 L5 L6 L7 L8 L9 L10 L11 L12 L13 L14 L15 L16 L17 L18 L19 L20 L21 L22 L23 L24 L25 L26 L27 L28 L29 L30 L31 L32 L33 L34 L35 L36 L37 L38 L39 L40 L41 L42 L43 L44 L45 L46 L47 L48 L49 L50 L51 L52 L53 L54 L55 L56 L57 L58 L59 L60 L61 L62 L63 L64 L65 L66 L67 L68 L69 L70 L71 L72 L73 L74 L75 L76 L77 L78 L79 L80 A1 A2 A3 A4 control } { #Create new node set $node [$ns node] #Define the OS image tb-set-node-os [set $node] FC4-STD #Have SEER install itself and startup when the node is ready tb-set-node-startcmd [set $node] "sudo python/share/seer/v160/experiment-setup.py Basic" } #Create the client networks set lannet0 [$ns make-lan "$L1 $L2 $L3 $L4 $L5 $L6 $L7 $L8 $L9 $L10 $R1 " 100 Mb 0 ms] set lannet1 [$ns make-lan "$L11 $L12 $L13 $L14 $L15 $L16 $L17 $L18 $L19 $L20 $R1 " 100 Mb 0 ms] set lannet2 [$ns make-lan "$L21 $L22 $L23 $L24 $L25 $L26 $L27 $L28 $L29 $L30 $R2 " 100 Mb 0 ms] set lannet3 [$ns make-lan "$L31 $L32 $L33 $L34 $L35 $L36 $L37 $L38 $L39 $L40 $R2 " 100 Mb 0 ms] set lannet4 [$ns make-lan "$L41 $L42 $L43 $L44 $L45 $L46 $L47 $L48 $L49 $L50 $R3 " 100 Mb 0 ms] set lannet5 [$ns make-lan "$L51 $L52 $L53 $L54 $L55 $L56 $L57 $L58 $L59 $L60 $R3 " 100 Mb 0 ms] set lannet6 [$ns make-lan "$L61 $L62 $L63 $L64 $L65 $L66 $L67 $L68 $L69 $L70 $R4 " 100 Mb 0 ms] set lannet7 [$ns make-lan "$L71 $L72 $L73 $L74 $L75 $L76 $L77 $L78 $L79 $L80 $R4 " 100 Mb 0 ms] #Create the Attack Nodes links set linkRA1 [$ns duplex-link $A1 $R1 100 Mb 3 ms DropTail] set linkRA2 [$ns duplex-link $A2 $R2 100 Mb 3 ms DropTail] set linkRA3 [$ns duplex-link $A3 $R3 100 Mb 3 ms DropTail] set linkRA4 [$ns duplex-link $A4 $R4 100 Mb 3 ms DropTail] #Create the topology links set linkRS [$ns duplex-link $S $R0 100 Mb 3 ms DropTail] set linkRR2 [$ns duplex-link $R0 $R1 100 Mb 3 ms DropTail] set linkR1R9 [$ns duplex-link $R0 $R2 100 Mb 3 ms DropTail] set linkR1R10 [$ns duplex-link $R0 $R3 100 Mb 3 ms DropTail] set linkR1R11 [$ns duplex-link $R0 $R4 100 Mb 3 ms DropTail] $ns rtproto Static $ns run Algorithm 1: Topology generation code.
is in range of 2.72 to 2.78 (shown in Figure 7(c)), which is near to maximum traffic cluster entropy with 40 clients from 8 networks. 7.2. Normal with DDoS Attacks. Different types of DDoS attacks are fused with normal traffic in this emulation scenario. The parameters of attacks are given in Table 4. The strength of the attack is kept approximately the same as that of normal traffic, that is, 200 kbps, so that the real worth of the approach is tested. Moreover the size of the attack packet is also the same as that of normal traffic so that for similar strength equal number of packets is generated. (a) We have launched UDP flat attack along with normal traffic. The throughput of normal and attack traffic is shown in Figure 8(a). Initially, normal traffic is sent for 40 sec. UDP flat attack starts at 40 sec and lasts till 90 sec; that is, duration of attack is 50 sec. Traffic cluster and source address entropy is
measured. As we can see in Figure 8(b), when UDP flat attack is launched at 40 sec, the number of sources increases so source address entropy increases from 3.815607 to 6.378821. Moreover as the number of clusters also increases there is rise in traffic cluster entropy from 2.80 to 5.25. Entropies remain high for the duration of attack, that is, 50 sec. When attack is stopped after 50 sec, entropies decrease. (b) In this scenario, UDP ramp-up attack is launched with normal traffic. Initially, normal traffic is sent. Attack starts at 40 sec and lasts till 100 sec; that is, duration of attack is 60 sec. Throughput of normal and attack traffic is shown in Figure 9(a). As it is ramp-up attack, it rises from low rate to high rate in 30 sec and so does entropy. Variation in source address and traffic cluster entropy is shown in Figure 9(b). (c) UDP ramp-down attack is launched in this scenario. Initially normal traffic is sent. Attack starts at 40 sec and lasts till 100 sec. As it is ramp-down attack, its intensity will fall from high rate to low rate. Fall rate of attack is
ISRN Communications and Networking
L56
L52
L53
L54
L55
9
L80
L51
L79
L78
L77
L76 L75 L74
L57
L73
Lannet7 L72
Lannet5
L58
L71 A4
L60
L59
R4
R3
R6
L50
L49
L69
L70
L68
A3
L48
L67
Lannet6
L47
Lannet4
L66
L46 L65 L45 L44
L43
L42
L64
L41
L61
s
L62
L63
R0
Control
L15
L17 L18 L16
L19
L20
L22
L21
L23
L24 L25
L14
R5
L13
L26
Lannet2
Lannet1
L27
L12 L11
L30 R1
L7
L8
L9
L29
L28
R2 L31
L10
A1
L32
L33 L34
A2
L6
L35
Lannet3
Lannet0
L36
L5 L4
L3
L2
L40
L1
L39
L38
L37
Figure 6: Experiment topology.
30 sec; that is, its strength falls from high rate to low rate in 30 sec. Throughput of normal and attack traffic is shown in Figure 10(a) and correspondingly variation in entropy is shown in Figure 10(b). (d) Figure 11(b) shows source IP address and traffic cluster entropy, when UDP pulsing attack is launched. In pulsing attack, attack rate pulses from high rate to low rate and vice versa. In our case high rate is 200 kbps and low rate is 100 kbps
as shown in Figure 11(a). It is high for 7 sec and again low for 7 sec. This cycle repeats for the whole duration of attack, that is, 63 sec. Thus accordingly value of entropies increases or decreases. (e) Throughput of normal traffic with TCP attack traffic is shown in Figure 12(a). Initially normal traffic is sent for 40 sec. Attack is launched at 40 sec. Duration of attack is 50 sec. Variation in entropies is shown in Figure 12(b).
10
ISRN Communications and Networking Table 1: Comparative characteristic of flash event and DDoS attacks.
Flash events Park et al. [6] have described flash crowd as a situation in which a large number of legitimate users simultaneously access a computer server causing traffic peaks which subsequently partially or sometimes completely disrupt the services.
The number of clients is more as compared to normal state and they follow almost the same distribution as that of normal state.
The traffic in FEs has much less number of unique traffic clusters as compared to source addresses as observed by Jung et al. [3] and Krishnamurthy and Wang [4]. In most of the discrimination schemes as used by Yu et al. [16], for discrimination of FE from DDoS, the number of new traffic clusters is not taken into account whereas in practical scenarios still there can be the possibilities of new traffic clusters generating the flash traffic.
The request rate per client during FEs decreases as compared to normal state as the overload at servers results in drops and timeouts which force request rates to be dropped at clients due to congestion and flow control signals. The study of web traces may suggest particular pattern of link access during FEs. However, deep packet inspection results in large overheads.
Table 2: Basic topology generation parameters. Parameter Number of edge routers Number of core routers Number of access routers Number of servers Number of LANS per edge router Number of nodes per LAN Bandwidth of edge to core and core to access routers Delay of edge to core and core to access routers Bandwidth and delay of access to server Number of attacker nodes
DDoS attacks Kumar et al. [2] have stated DDoS as an intentional attempt to compromise the network services by injecting meticulously crafted attack traffic through a number of zombies, daemons, agents, slaves, and so forth that are distributed around the world. The DDoS attacks generate a lot of volume through either small number of zombies generated at high rate or large number of zombies generated at the same rate as that of legitimate clients. The first case is easily detected by volume based approaches as proposed by Gil and Poletto [17] and Barford et al. [13] and simple entropy based approaches as suggested by Kumar et al. [2] and Feinstein et al. [8], but the second case remains mostly indiscriminate if the volume generated is the same as that of legitimate or flash traffic. The new traffic clusters are more as compared to FEs. Even the sophisticated attacks are launched using those machines and networks which are comparatively passive at the moment of usage and one network or machine does not generate much traffic so as to escape from the local intrusion detection systems. So new traffic clusters are bound to be more if some degrading impact has to be caused to the victim server. In most of the schemes as used by Park et al. [6] and Yu et al. [16] discrimination between FE and DDoS the old traffic clusters are not considered at all. The zombies normally do not follow congestion and flow control signals as they are run by automated scripts but the sophistication of attackers and abundant availability of zombies on Internet suggest that attacks can be even launched by a large number of zombies following congestion and flow control signals specially in case of nonspoofed attacks. Traditionally web servers are overloaded by accessing the same set of links or sometimes a particular host repeatedly accessing a set of links which do match legitimate access patterns. But an intelligently coded request sequence in zombies can follow any patterns.
Table 3: Basic emulation environment parameters.
Value 4 2 1 1 2 10 100 mbps
Parameter Legitimate traffic Attack traffic HTTP request generation rate Attack traffic strength Number of clients used for normal traffic Number of clients used for generating flash event Process for generation of attack
Value Web UDP/TCP 0.1 to 1 (min–max) 200 kbps to 350 kbps 40 80 Spoofing
0 ms 100 mbps, 0 ms 8
7.3. Flash Traffic. We have sent flash traffic to server, that is, web requests from all 80 clients. The throughput of flash traffic is shown in Figure 13(a). The measured traffic cluster and source entropy is shown in Figure 13(b). The observations are as follows.
(a) The increase in traffic rate with flash event is 200 kbps. Thus increase in strength of flash traffic from normal traffic is the same as that of attack strength (which we have launched already and shown in Figure 8(a)). But, in case of attack, there is significant increase in traffic cluster entropy, that is, from 2.71 to 5.25 (shown in Figure 8(b)), whereas in case of flash event, increase in traffic cluster entropy is marginal, that is, from 2.75 to 2.77 (shown in Figure 13(b)). Thus, we can distinguish flash event from DDoS attack. In case
11
Temporal variation in normal traffic
121.00
111.01
91.00
101.00
81.00
71.00
61.00
51.00
41.00
31.00
21.00
Temporal variation in source entropy of normal traffic
11.00
4.14 4.12 4.1 4.08 4.06 4.04 4.02
1.00
10:40:55 AM
10:40:50 AM
10:40:45 AM
10:40:40 AM
10:40:35 AM
10:40:30 AM
10:40:25 AM
10:40:20 AM
10:40:15 AM
10:40:10 AM
10:40:00 AM
Entropy
250 200 150 100 50 0 −50 −100 −150 −200
10:40:05 AM
Traffic Traffic sent (kbps) received (kbps)
ISRN Communications and Networking
Time (s)
Time (s)
Source entropy (b)
Temporal variation in traffic cluster entropy of normal traffic
2.78 2.77 2.76 2.75 2.74 2.73 2.72
1.00 10.01 19.00 28.00 37.00 46.01 55.00 64.01 73.00 82.00 91.00 100.00 109.01 118.00 127.00
Entropy
(a)
Time (s) Source entropy (c)
Figure 7: (a) Throughput of normal traffic. (b) Source address entropy of normal traffic. (c) Traffic cluster entropy of normal traffic. Table 4: Parameters of different types of UDP attacks. Attack type
Attack duration
Attack strength
(a) UDP flat (b) UDP ramp-up (c) UDP ramp-down
50 sec 60 sec, ramp-up time is 30 sec 60 sec, ramp-down time is 30 sec 63 sec, 5 pulses, each pulse is 7 sec of high rate and 7 sec of low rate 50 seconds
200 Kbps 50 Kbps to 200 Kbps 200 Kbps to 50 kbps 200 Kbps per pulse for high rate and 50 kbps for low rate 200 Kbps
(d) UDP pulse (e) TCP attacks
Table 5: Comparative analysis of source and traffic cluster entropy for normal, flash, and attack traffic.
Normal traffic Normal traffic with UDP and TCP attacks Flash traffic
Source address entropy range 3.815607–4.125917 3.815607–6.378821 5.290918–5.721889
of flash event, increase in request rate is from clients of the same networks, causing marginal rise in traffic cluster entropy. (b) In case of flash event, source entropy increases considerably, whereas traffic cluster entropy increases marginally. As number of client machines generating requests increased giving rise to increase in source entropy, but as most of the clients are from the same
Traffic cluster entropy range 2.728398–2.772241 2.714725–5.526648 2.701708–2.776293
Traffic received by server 210 kbps–260 kbps 400 kbps–440 kbps 375 kbps–450 kbps
network domain, so traffic cluster entropy does not increase. The emulation experiments carried out have mix of normal, flash, and attack traffic. The results obtained in different emulation scenarios are summarised in Table 5. It is quite evident that source address entropy and traffic cluster entropy vary in quite narrow range in case of normal traffic. However when flash traffic is generated, the source
118.00
127.00
100.00
109.00
82.00
91.00
73.02
64.00
55.00
46.00
28.01
19.00
1.00
7 6 5 4 3 2 1 0
37.01
Temporal variation in entropy of normal traffic with UDP flat attack
10.02
10:49:05 AM
10:49:00 AM
10:48:55 AM
10:48:50 AM
10:48:45 AM
10:48:40 AM
10:48:35 AM
10:48:30 AM
10:48:25 AM
10:48:20 AM
10:48:15 AM
10:48:10 AM
Temporal variation in normal traffic with UDP flat attack 500 400 300 200 100 0 −100 −200 −300 −400
Entropy
ISRN Communications and Networking
Traffic Traffic sent (kbps) received (kbps)
12
Time (s) Traffic cluster entropy Source address entropy
Time (s) (a)
(b)
Temporal variation in normal traffic with UDP ramp-up attack
Temporal variation in entropy of normal traffic with UDP ramp-up attack
7
500 400 300 200 100 0 −100 −200 −300 −400
Entropy
6 5 4 3 1.04 10.00 19.00 28.02 37.00 46.00 55.00 64.00 73.00 82.00 91.00 100.00 109.00 118.00 127.01
10:51:10 AM
10:51:05 AM
10:51:00 AM
10:50:55 AM
10:50:50 AM
10:50:45 AM
10:50:40 AM
10:50:35 AM
10:50:30 AM
10:50:25 AM
10:50:20 AM
2 10:50:15 AM
Traffic Traffic sent (kbps) received (kbps)
Figure 8: (a) Throughput of normal traffic with UDP flat attack. (b) Source address and traffic cluster entropy with UDP flat attack.
Time (s) Traffic cluster entropy Source address entropy
Time (s) (a)
(b)
Temporal variation in normal traffic with UDP ramp-down attack
Temporal variation in entropy of normal traffic with UDP ramp-down attack
7
6 Entropy
450 350 250 150 50 −50 −150 −250 −350
5 4 3 2
Time (s) (a)
121.00
111.02
101.04
91.00
81.00
71.00
61.00
51.00
41.00
31.01
21.01
11.01
0 1.00
11:00:45 AM
11:00:40 AM
11:00:35 AM
11:00:30 AM
11:00:25 AM
11:00:20 AM
11:00:15 AM
11:00:10 AM
11:00:05 AM
11:00:00 AM
10:59:55 AM
1 10:59:50 AM
Traffic Traffic sent (kbps) received (kbps)
Figure 9: (a) Throughput of normal traffic with UDP ramp-up attack. (b) Source address and traffic cluster entropy of normal traffic with UDP ramp-up attack.
Time (s) Traffic cluster entropy Source address entropy (b)
Figure 10: (a) Throughput of normal traffic with UDP ramp-down attack. (b) Source address and traffic cluster entropy of normal traffic with UDP ramp-down attack.
13
Temporal variation in normal traffic with UDP pulsing attack
118.00
127.00
109.01
91.00
100.00
82.00
73.00
64.00
55.00
46.00
28.00
37.00
10.01
7 6 5 4 3 2 1 0
19.00
Temporal variation in entropy of normal traffic with UDP pulse attack
1.02
11:25:50 AM
11:25:45 AM
11:25:40 AM
11:25:35 AM
11:25:30 AM
11:25:25 AM
11:25:20 AM
11:25:15 AM
11:25:10 AM
11:25:05 AM
11:25:00 AM
Entropy
450 350 250 150 50 −50 −150 −250 −350
11:24:55 AM
Traffic Traffic sent (kbps) received (kbps)
ISRN Communications and Networking
Time (s)
Time (s)
Network entropy
(a)
(b)
127.00
118.00
109.00
100.00
91.01
82.00
73.02
64.00
55.00
46.00
28.01
37.01
10.02
1.00
19.00
Temporal variation in entropy of legitimate traffic with TCP attack
7 6 5 4 3 2 1 0
11:36:45 AM
11:36:40 AM
11:36:35 AM
11:36:30 AM
11:36:25 AM
11:36:20 AM
11:36:15 AM
11:36:10 AM
11:36:05 AM
11:36:00 AM
11:35:55 AM
350 250 150 50 −50 −150 −250
Entropy
Temporal variation in normal traffic with TCP flat attack
11:35:50 AM
Traffic Traffic sent (kbps) received (kbps)
Figure 11: (a) Throughput of normal traffic with UDP pulsing attack. (b) Source address and traffic cluster entropy of normal traffic with UDP pulsing attack.
Time (s) Traffic cluster entropy Source address entropy
Time (s) (a)
(b)
Time (s) (a)
10:30:44 AM
10:30:39 AM
10:30:34 AM
10:30:29 AM
10:30:24 AM
10:30:19 AM
10:30:14 AM
10:30:09 AM
10:30:04 AM
10:29:59 AM
10:29:54 AM
Entropy
450 350 250 150 50 −50 −150 −250 −350 −450
6 5.5 5 4.5 4 3.5 3 2.5
Temporal variation in entropy of flash traffic
1.00 10.00 19.00 28.00 37.00 46.00 55.00 64.00 73.00 82.00 91.00 100.00 109.00 118.00
Temporal variation in flash traffic
10:29:49 AM
Traffic Traffic sent (kbps) received (kbps)
Figure 12: (a) Throughput of normal traffic with TCP attack. (b) Source address and traffic cluster entropy of normal traffic with TCP attack.
Time (s) Traffic cluster entropy Source address entropy (b)
Figure 13: (a) Throughput of flash traffic. (b) Source address and traffic cluster entropy for flash traffic.
14
ISRN Communications and Networking Temporal variation in entropy of flash traffic
7 6.5
Entropy
6
5.5 5 4.5 4 3.5 3 118.00
109.00
100.00
82.00
91.00
73.00
64.00
55.00
46.00
37.00
28.00
19.00
1.00
10.00
2.5
Time (s) Traffic cluster entropy of FE Source address entropy of FE Traffic cluster entropy of attack Source address entropy of attack Traffic cluster entropy of normal traffic Source address entropy of normal traffic
Figure 14: Source address and traffic cluster entropy of normal, flash, and attack traffic.
entropy increases abruptly in comparison to normal as number of clients accessing the server increases. But these new clients do not belong to new networks, so the traffic cluster entropy does not have noticeable variations. On the contrary in case of attack scenarios, no doubt the number of clients once again increases but they belong to new networks already exploited by the attackers. So in addition to source entropy, traffic cluster entropy also increases abruptly which signals beginning of DDoS attacks. Hence source entropy can increase in case of flash and attack but it is the traffic cluster entropy only which observes abrupt increase in case of attacks. As shown in Figure 14, initially for 40 sec, only legitimate traffic is sent. Source and traffic cluster entropy of legitimate traffic is computed. It remains in the range of 3.815607 to 4.125917 and 2.728398 to 2.772241, respectively. At 40 sec, flash traffic as well as DDoS attack is launched. As we can see from Figure 14, when flash event is generated, there is no variation in the traffic cluster entropy but source entropy increases considerably due to increase in number of clients. It remains in range of 3.815607 to 6.378821. On the other hand, when attack is launched, source as well as traffic cluster entropy changes abruptly.
8. Conclusion The flash crowd and DDoS attack are two important events which are experienced by the web services on the Internet. It is interesting that both require different mechanisms to be employed by network administrators. So to distinguish between the two is one of the most important security problems. However a few researchers in the field of DDoS detection have considered FE in their experimentation scenarios. In this paper, at the outset flash crowd is described
across various dimensions. The similarity and dissimilarity with DDoS attacks are highlighted. Emulation instead of simulation is carried out to experience both events in a live manner. The emulation experiments conducted on the DETER testbed clearly manifested effectiveness of traffic cluster entropy as a detection metric. The explored characteristics of flash events and sneaky ways of DDoS attack generation are used to create different emulation scenarios. The rise in source address entropy in case of DDoS attacks has already been used by various researchers but in case of flash events too entropy rise is seen due to which we are not able to discriminate FE from DDoS attacks. But the rise in traffic cluster entropy in case of DDoS attacks and its stability in flash events as per emulation experiments clearly justify the supremacy of our approach. Future Work (i) Since DETER testbed does not have large number of nodes for emulation experiments, simulation using large ISP level topology can further strengthen our rationales. (ii) Computing thresholds are based on request operating characteristic curve ROC.
Disclosure DETER testbed used was from http://www.isi.deterlab.net, and SEER GUI used was from http://seer.deterlab.net.
Conflict of Interests The authors declare that there is no conflict of interests regarding the publication of this paper.
ISRN Communications and Networking
References [1] Y. Chen and K. Hwang, “Collaborative change detection of DDoS attacks on community and ISP networks,” in Proceedings of the International Symposium on Collaborative Technologies and Systems (CTS ’06), pp. 401–410, May 2006. [2] K. Kumar, R. C. Joshi, and K. Singh, “A distributed approach using entropy to detect DDoS attacks in ISP domain,” in Proceedings of the International Conference on Signal Processing, Communications and Networking (ICSCN ’07), pp. 331–337, February 2007. [3] J. Jung, B. Krishnamurthy, and M. Rabinovich, “Flash crowds and denial of service attacks: characterization and implications for CDNs and web sites,” in Proceedings of the 11th International Conference on World Wide Web (WWW ’02), pp. 293–304, ACM Press, May 2002. [4] B. Krishnamurthy and J. Wang, “On network-aware clustering of web clients,” in Proceedings of the Conference on Applications, Technologies, Architectures, and Protocols for Computer Communication (ACM SIGCOMM ’00), pp. 97–109, Stockholm, Sweden, August 2000. [5] L. Niven, “Flash crowd,” in The Flight of the Horse, pp. 99–164, 1973. [6] H. Park, P. Li, D. Gao, H. Lee, and R. H. Deng, “Distinguishing between FE and DDoS using randomness check,” in Information Security, vol. 5222 of Lecture Notes in Computer Science, pp. 131– 145, 2008. [7] E. Messmer, Network World, and Arbor Networks, “Shorter, higher-speed DDoS attacks on the rise,” July 2013, http://www.networkworld.com/news/2013/073013-ddos -attacks-arbor-272319.html. [8] L. Feinstein, D. Schnackenberg, R. Balupari, and D. Kindred, “Statistical approaches to DDoS attack detection and response,” in Proceedings of the DARPA Information Survivability Conference & Exposition, vol. 1, pp. 303–314, IEEE CS Press, April 2003. [9] D. Moore, C. Shannon, D. J. Brown, G. M. Voelker, and S. Savage, “Inferring internet denial-of-service activity,” ACM Transactions on Computer Systems, vol. 24, no. 2, pp. 115–139, 2006. [10] R. B. Blazek, H. Kim, B. Rozovskii, and A. Tartakovsky, “A novel approach to detection of “Denial-of-Service” attacks via adaptive sequential and batch-sequential change-point detection methods,” in Proceedings of the IEEE Information Assurance and Security Workshop, pp. 220–226, IEEE CS Press, June 2001. [11] R. R. Brooks, Disruptive Security Technologies with Mobile Code and Peer-To-Peer Networks, CRC Press, Boca Raton, Fla, USA, 2005. [12] H. Wang, D. Zhang, and K. G. Shin, “Change-point monitoring for the detection of DoS attacks,” IEEE Transactions on Dependable and Secure Computing, vol. 1, no. 4, pp. 193–208, 2004. [13] P. Barford, J. Kline, D. Plonka, and A. Ron, “A signal analysis of network traffic anomalies,” in Proceedings of the 2nd ACM SIGCOMM Workshop on Internet Measurment (IMW ’02), pp. 71–82, November 2002. [14] E. S. Alomari, Manickam, B. B. Gupta, S. Karuppayah, and R. Alfaris, “Botnet-based distributed denial of service (DDoS) attacks on web servers: classification and art,” International Journal of Computer Applications, vol. 49, no. 7, 2012. [15] F. Yi, S. Yu, W. Zhou, J. Hai, and A. Bonti, “Source-based filtering algorithm against DDOS attacks,” International Journal of Database Theory and Application, vol. 1, no. 1, pp. 9–20, 2008.
15 [16] S. Yu, T. Thapngam, J. Liu, S. Wei, and W. Zhou, “Discriminating DDoS flows from flash crowds using information distance,” in Proceedings of the 3rd International Conference on Network and System Security (NSS ’09), pp. 351–356, Piscataway, NJ, USA, October 2009. [17] T. M. Gil and M. Poletto, “Multops: a data-structure for bandwidth attack detection,” in Proceedings of the 10th Conference on USENIX Security Symposium, 2001. [18] S. Bhatia, G. Mohay, A. Tickle, and E. Ahmed, “Parametric differences between a real-world distributed denial-of-service attack and a flash event,” in Proceedings of the 6th International Conference on Availability, Reliability and Security (ARES ’11), pp. 210–217, August 2011. [19] G. Carl, G. Kesidis, R. R. Brooks, and S. Rai, “Denial-of-service attack-detection techniques,” IEEE Internet Computing, vol. 10, no. 1, pp. 82–89, 2006. [20] Y. Chen, K. Hwang, and W. S. Ku, “Distributed change-point detection of DDoS attacks: experimental results on DETER testbed,” in Proceedings of the DETER Community Workshop on Cyber Security Experimentation and Test on DETER Community Workshop on Cyber Security Experimentation and Test, USENIX Association, Boston, Mass, USA, August 2007. [21] K. Fall, “Network emulation in the VINT/NS simulator,” in Proceedings of the 4th IEEE International Symposium on Computers and Communications (ISCC ’99), pp. 244–250, July 1999. [22] L. Rizzo, “Dummynet and forward error correction,” in Proceedings of the Annual Conference on USENIX Annual Technical Conference, USENIX Association, New Orleans, La, USA, June 1998. [23] B. White, J. Lepreau, L. Stoller et al., “An integrated experimental environment for distributed systems and networks,” in Proceedings of the 5th Symposium on Operating Systems Design and Implementation, pp. 255–270, Boston, Mass, USA, December 2002. [24] A. Vahdat, K. Yocum, K. Walsh et al., “Scalability and accuracy in a largescale network emulator,” in Proceedings of the 5th Symposium on Operating Systems Design and Implementation, pp. 271–284, Boston, Mass, USA, December 2002. [25] T. Benzel, R. Braden, D. Kim et al., “Experience with deter: a testbed for security research,” in Proceedings of the 2nd International Conference on Testbeds and Research Infrastructures for the Development of Networks and Communities (TRIDENTCOM ’06), pp. 379–388, Barcelona, Spain, March 2006. [26] C. E. Shannon and W. Weaver, The Mathematical Theory of Communication, University of Illinois Press, 1963. [27] R. Chertov, S. Fahmy, and N. B. Shroff, “Fidelity of network simulation and emulation: a case study of TCP-targeted denial of service attacks,” ACM Transactions on Modeling and Computer Simulation, vol. 19, no. 1, article 4, 2008.
International Journal of
Rotating Machinery
The Scientific World Journal Hindawi Publishing Corporation http://www.hindawi.com
Volume 2014
Journal of
Robotics Hindawi Publishing Corporation http://www.hindawi.com
Volume 2014
Hindawi Publishing Corporation http://www.hindawi.com
Advances in
Mechanical Engineering
Journal of
Sensors Volume 2014
Hindawi Publishing Corporation http://www.hindawi.com
Volume 2014
Engineering
Hindawi Publishing Corporation http://www.hindawi.com
Volume 2014
Journal of
Hindawi Publishing Corporation http://www.hindawi.com
International Journal of
Chemical Engineering Hindawi Publishing Corporation http://www.hindawi.com
Volume 2014
Volume 2014
Submit your manuscripts at http://www.hindawi.com International Journal of
Distributed Sensor Networks Hindawi Publishing Corporation http://www.hindawi.com
Advances in
Civil Engineering Hindawi Publishing Corporation http://www.hindawi.com
Volume 2014
Volume 2014
VLSI Design Advances in OptoElectronics
Modelling & Simulation in Engineering
International Journal of
Navigation and Observation Hindawi Publishing Corporation http://www.hindawi.com
Volume 2014
Hindawi Publishing Corporation http://www.hindawi.com
Hindawi Publishing Corporation http://www.hindawi.com
Volume 2014
Hindawi Publishing Corporation http://www.hindawi.com
Advances in
Acoustics and Vibration Volume 2014
Hindawi Publishing Corporation http://www.hindawi.com
Volume 2014
Volume 2014
Journal of
Control Science and Engineering
Active and Passive Electronic Components Hindawi Publishing Corporation http://www.hindawi.com
Volume 2014
International Journal of
Journal of
Antennas and Propagation Hindawi Publishing Corporation http://www.hindawi.com
Shock and Vibration Volume 2014
Hindawi Publishing Corporation http://www.hindawi.com
Volume 2014
Hindawi Publishing Corporation http://www.hindawi.com
Volume 2014
Electrical and Computer Engineering Hindawi Publishing Corporation http://www.hindawi.com
Volume 2014