MNRAS 000, 1–10 (2016)
Preprint 18 July 2017
Compiled using MNRAS LATEX style file v3.0
arXiv:1707.05223v1 [astro-ph.IM] 17 Jul 2017
A transient search using combined human and machine classifications Darryl E. Wright,1? Chris J. Lintott,1 Stephen J. Smartt,2 Ken W. Smith,2 Lucy Fortson,3,4 Laura Trouille,5,6 Campbell R. Allen,1 Melanie Beck,3 Mark C. Bouslog,6 Amy Boyer,6 K. C. Chambers,7 Heather Flewelling,7 Will Granger,6 Eugene A. Magnier,7 Adam McMaster,1 Grant R. M. Miller,1 James E. O’Donnell,1 Helen Spiers,1 John L. Tonry,7 Marten Veldthuis,1 Richard J. Wainscoat,7 Chris Waters,7 Mark Willman,7 Zach Wolfenbarger,6 Dave R. Young2 1 Department
of Physics, University of Oxford, Denys Wilkinson Building, Keble Road, Oxford, OX1 3RH, UK Research Centre, School of Mathematics and Physics, Queen’s University Belfast, Belfast BT7 1NN, UK 3 Minnesota Institute for Astrophysics, University of Minnesota, Minneapolis, MN 55454, USA 4 School of Physics and Astronomy, University of Minnesota, Minneapolis, MN 55455, USA 5 Center for Interdisciplinary Exploration and Research in Astrophysics (CIERA) and Dept. of Physics and Astronomy, Northwestern University, Evanston, IL, USA 6 Citizen Science Department, The Adler Planetarium, Chicago, IL, USA 7 Institute for Astronomy, University of Hawaii, 2680 Woodlawn Drive, Honolulu, HI 96822, USA 2 Astrophysics
Accepted XXX. Received YYY; in original form ZZZ
ABSTRACT
Large modern surveys require efficient review of data in order to find transient sources such as supernovae, and to distinguish such sources from artefacts and noise. Much effort has been put into the development of automatic algorithms, but surveys still rely on human review of targets. This paper presents an integrated system for the identification of supernovae in data from Pan-STARRS1, combining classifications from volunteers participating in a citizen science project with those from a convolutional neural network. The unique aspect of this work is the deployment, in combination, of both human and machine classifications for near real-time discovery in an astronomical project. We show that the combination of the two methods outperforms either one used individually. This result has important implications for the future development of transient searches, especially in the era of LSST and other large-throughput surveys. Key words: methods: data analysis, methods: statistical, techniques: image processing, surveys, supernovae: general
1
INTRODUCTION
The detection and identification of transient sources has long been an important part of astronomical observation. New surveys such as LSST (Large Synoptic Survey Telescope, Ivezi´c et al. (2008)) will increase the number of transient candidates detected by many orders of magnitude, leading to renewed attention being paid to the methods used by transient searches. To extract the most scientific value from
?
E-mail:
[email protected]
c 2016 The Authors
surveys, we want to follow the entire evolution of transients from the time of outburst to the point at which they fade below the detection limit. This requires a rapid processing of data to enable a fast decision on whether or not to expend valuable follow up resources for each potential candidate extracted by a transient survey’s image processing pipeline. The first problem is deciding if a source, flagged by the pipeline, is a detection with real astrophysical significance or an artefact of the detector or image processing. We want to promote the former for a decision on whether to followup and to reject the latter without further consideration.
2
D.E. Wright, C. J. Lintott, S.J. Smartt et al.
In preparation for LSST and to deal with the data volumes of present surveys, much effort has been invested in developing systems which automatically reject false positives with supervised learning. Using large volumes of past observations that have been identified as real or “bogus”, the aim is to train a machine to make predictions about future observations (Bloom et al. 2012; Brink et al. 2013; Goldstein et al. 2015; du Buisson et al. 2015; Donalek et al. 2008; Romano et al. 2006; Bailey et al. 2007; Masci et al. 2017). Providing this data typically requires manual inspection of individual detections by human experts to mitigate label contamination that would confound the learning algorithm. This quickly becomes unwieldy given that performance of a machine learning solution has been shown to depend on the quantity of labelled training data (Banko & Brill 2001). The requirement for sufficiently large and representative training sets is prohibitive for the largest surveys or for small research teams, and is particularly problematic for rarer classes of transients. An alternative to relying on expert labelled training sets for machine learning is therefore to expand the population providing labels. For example Melchior et al. (2016) describes a crowd sourcing platform for vetting image quality from the Dark Energy Survey (DES) (Dark Energy Survey Collaboration 2005) relying on the consensus of ∼ 100 volunteers from a team of professional astronomers. For surveys of the future a few hundred volunteers will not be enough. Instead we must cast our net wider increasing the population of the crowd beyond those directly involved in the survey. The obvious path is to engage citizen scientists. Galaxy Zoo Supernovae (Smith et al. 2011) and Snapshot Supernova (Campbell et al. 2015) are two projects to have taken this approach for transient surveys, using data from the Palomar Transient Factory (PTF) (Rau et al. 2009; Law et al. 2009) and SkyMapper (Keller et al. 2007) respectively. Both projects were facilitated through the Zooniverse Citizen Science platform (see description in Marshall et al. (2015)), and asked volunteers to assess the target, reference and difference images for each detection and answer a series of questions that led to a classification of real or bogus. For classification tasks, humans and machines have complementary strengths. Human classifiers are good at rapidly making abstract judgments about data, allowing them to see only a small number of examples before making decisions about novel images. Machines can consume large quantities of data and make more systematic judgements based on complex relationships between the features provided. In the Space Warps citizen science project (Marshall et al. 2016) all example gravitational lenses provided to volunteers appeared blue, yet despite this, volunteers were able to identify a gravitationally lensed hyperluminous infrared radio galaxy that appeared red (Geach et al. 2015). In contrast a machine would need to be provided examples of these in the training data. On the other hand, computer vision techniques allow images to be examined systematically, with relationships between different features used for classification. Combining machine classifications with those of experts will trivially be expected to improve performance, but the situation in which classifications from volunteer citizen scientists are used is less clear. If the noisier data sets provided by citizen science are combined with machines, is performance of the system improved? If machines are included in classification, does it relieve some of the burden
on citizen scientists? Answering these questions is critically important for surveys where even a substantial number of experts will not be able to review all the data promoted by a machine classifier. In this paper we report some initial findings from the Supernova Hunters project1 , a new citizen science project similar in spirit to those mentioned above but applied to the Pan-STARRS Survey for Transients (PSST). In Section 2 we describe the Pan-STARRS1 telescope, PSST survey and the Supernova Hunters project and citizen science platform. Section 3 shows the relative performance of humans and machines on data uploaded to Supernova Hunters during the first two months of the project. We also describe and measure the performance of a simple method for combining the classifications of citizen scientists and the current PSST machine classifier. We further discuss a mechanism to take advantage of metadata associated with each detection to boost classification performance. In Section 4 we conclude and discuss potential avenues for future improvements. This paper therefore represents the first study of combined citizen science and machine classifications within a live astronomical survey.
2 2.1
METHOD Pan-STARRS1
Pan-STARRS1 comprises a 1.8m primary mirror (Kaiser et al. 2010) and 60 detectors with 4800 pixels, constructed from 10µm pixels subtending 0.258 arcsec (Magnier et al. 2013) and a field-of-view of 3.3 deg. The filter set consists of gP 1 , rP 1 , iP 1 , zP 1 (similar to SDSS griz (York et al. 2000)), yP 1 extending redward of zP 1 and the “wide” wP 1 -band filter extending over gP 1 to iP 1 (Tonry et al. 2012). Between 2010 and 2014 Pan-STARRS1 was operated by the PS1 Science Consortium (PS1SC) performing 2 major surveys. The Medium Deep Survey (MDS) was allocated 25% of observing time for high cadence observations of the 10 Medium Deep fields and the 3π survey allocated 56% observing time to observe the entire sky north of -30 degrees declination with 4 exposures per year in each of gP 1 , rP 1 , iP 1 , zP 1 and yP 1 for each pointing. The 3π survey was completed in mid-2014 and since then the telescope has been carrying out a NASA funded wide-field survey for near earth objects through the NEO Observation Program operated by the Pan-STARRS Near Earth Object Science Consortium (PSNSC). The NASA PSNSC survey is similar to the 3π survey but optimised for NEO discoveries. Observations are in wP 1 in dark time and combinations of iP 1 , zP 1 and yP 1 during bright time. The PanSTARRS Survey for Transients (PSST) (Huber et al. 2015; Inserra et al. 2013) searches the data for static transients, releasing these publicly within 12 to 24 hours. Typically a single field is imaged 4 times in a night with exposures separated by 10-20 mins called Transient Time Interval (TTI) exposures to allow for the discovery of moving objects. The quads of exposures are not dithered or stacked,
1
https://www.zooniverse.org/projects/dwright04/ supernova-hunters MNRAS 000, 1–10 (2016)
Human and machine classifications meaning that cross-talk ghosts, readout artefacts and problems of fill-factor are inherent in the data (see Denneau et al. (2013) for some examples). Individual exposures are differenced (Alard & Lupton 1998; Bramich 2008) with the 3π all-sky reference stack and sources in the resulting difference images are catalogued. A series of pre-ingest cuts are performed before the catalogues are ingested into a MySQL database at Queen’s University Belfast (QUB). These cuts are based on the detection of saturated, masked or suspected defective pixels within the PSF area in addition to flag checks for ghost detections and rejecting detections within ±5 degrees galactic latitude. Detections passing these cuts are grouped into transient candidates if they are spatially coincident within 0.5 arcsec and the rms scatter is < 0.25 arcsec. Post-ingest cuts are applied on detection quality, convolution checks and a check for proximity to bright objects. Additional cross-talk rules have been identified and implemented at QUB to reject ghosts not flagged at the pre-ingest stage. Remaining detections are cross-matched with the Minor Planets Center ephemeris database to identify any asteroids not removed by the rms cut. Remaining transient candidates are passed to our machine classifier described in the next section. 2.2
Convolutional Neural Network
In Wright et al. (2015) we developed a machine classifier for real-bogus classification in the PS1 Medium Deep Survey. However, we found that this approach performs poorly for PSST because of the greater variety of artefacts in PSST data (a consequence of differencing individual exposures) and the difficulty obtaining a representative labelled training set at the beginning of a new survey. Instead we turned to Convolutional Neural Networks (CNNs) that maintain the advantages of operating solely on the pixel data but at a higher computational cost in deployment. The training set for this classifier was drawn from 3π survey data between 1st June 2013 and 20th June 2014. The sample of real detections are taken from spectroscopically confirmed transients or detections of objects that have been labelled by experts as high probability real transients. Bogus detections are taken from a random subsample of detections discarded by post-ingest cuts or human inspection. The training set consists of 6916 examples with an additional 2303 detections held out for testing with both data sets containing twice as many bogus detections to real. Each example was manually inspected in order to limit label contamination; not all detections associated with a spectroscopically confirmed transient are necessarily real for example. Given the small data set, to avoid overfitting we limit the CNN to a single convolution layer with 400 kernels and a pooling layer followed by a binary softmax classifier. We also perform unsupervised pre-training with sparse filtering (Ngiam et al. 2011) using unlabelled images from the STL10 (Coates et al. 2011) data set. The classifier is applied to nightly PSST data producing a score for each TTI exposure for every candidate passing the cuts in the previous section. The score, or hypothesis, is a function h(x) of the input feature representation, x (the output of the convolution and pooling layers). For each candidate we simply combine the TTI exposure hypotheses by taking the median, resulting in a single “real-bogus factor” for each transient candidate MNRAS 000, 1–10 (2016)
3
which we take as the machine equivalent of P (real) below. To automatically reject candidates we must choose a decision boundary on h(x) such that any candidate with a hypothesis lying below the decision boundary is considered a bogus detection and discarded. This inevitably leads to a trade-off between false positives and false negatives (or missed detections). If the decision boundary is set too high we will discard many real detections of supernovae; too low and we will be inundated with artefacts (see for example Figure 2). We chose the decision boundary based on the expected performance measured on the test set. For example, using our CNN to generate hypotheses for each detection in the test set, we can choose the decision boundary that corresponds to a False Positive Rate (FPR) of 1% at h(x) = 0.842, where the FPR is the number of false positives divided by the total number of bogus candidates in the sample. However, although the number of artefacts promoted would be low, based on the test set this decision boundary would be expected to result in a Missed Detection Rate (MDR) of ∼ 21% for future data and is therefore not a sensible choice. We instead opted for a decision boundary at h(x) = 0.436 with expected FPR and MDR of 5% and ∼5.2% respectively. As detailed in Section 3.1 clearly the decision boundary can be scaled to take advantage of available human effort; lowering the decision boundary beyond 0.436 would increase the FPR requiring more human screening but at the same time reduce the MDR such that humans could recover real supernova detections with low h(x) that would otherwise be automatically rejected.
2.3
Citizen Science Platform
Supernova Hunters was launched on 12th July 2016 (MJD 57581). As of 6th December 2016 the project has accumulated 1082170 classifications from 5845 citizen scientists with a few tens of volunteers submitting thousands of classifications. Citizen scientists are presented with the interface shown in Figure 1 and asked to classify individual TTI observations (see Section 2.1). So far volunteers have classified 117693 individual images of 46277 individual PS1 objects. As guidance we provide a “Field Guide” that provides a description and examples of the different artefact types we expect. Once a week ∼ 5800 new subjects are uploaded to the project consisting of the previous week’s detections that pass our machine cuts. The arrival of the data is announced to existing volunteers via email2 . We require at least seven citizen scientist classifications before a subject is considered classified and subsequently retired from the project. The choice of seven classifications is simply motivated by a trade-off between speed of data processing and accuracy and we did not see significant gains by requiring ten classifications during the beta test. Since launch the project averages ∼ 21000 classifications in the first 24 hours after the data is released and ∼ 8200 classifications in the following 24 hours by which time all subjects are normally retired. We calculate a “human score” simply by taking the fraction of all the volunteers who saw a detection and classified it was real. High confidence (typically P (real) > 0.8, see
2
Though enthusiasm for the project is such that traffic to the site now increases significantly ahead of this email alert!
4
D.E. Wright, C. J. Lintott, S.J. Smartt et al.
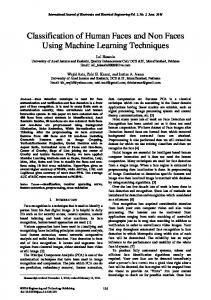
Figure 1. The classification interface presented to citizen scientists. The left most image is the target image taken during the previous week. In the centre is the equivalent 3π reference image and on the right is the difference image. Volunteers are asked to decide whether or not they think the detection in the green crosshairs in the difference image is a detection of a real transient.
bogus asteroid real
2000 250
1500
200 150
12428
frequency
Section 3) supernova candidates are screened by experts to remove a small number of false positives (∼ 10%) before the targets are submitted to the Transient Name Server (TNS). To date citizen scientists have discovered over 450 supernova candidates that have been submitted to the TNS and two confirmed Supernovae including SN 2016els (Mattila et al. 2016); a superluminous supernova Type I. The classification spectra were obtained by PESSTO (Smartt et al. 2015).
100
1000
50
3
PERFORMANCE
We present the results of our machine classifier (Section 2.2) in Figure 2 on PS1 data uploaded to Supernova Hunters between MJD 57570 and MJD 57586. This data set includes classifications from an initial beta test of the project prior to launch on MJD 57581. A major contaminant is the presence of asteroids. These appear in the difference image as identical to supernovae, and are in that sense “correctly classified” but are identified here via cross-matching with the Minor Planet Center. The results of the machine learning were additionally reviewed by at least one expert member of the team (normally DEW or KWS) to identify genuine supernovae. Candidates were divided into ‘real’ and ‘bogus’ categories based on these expert classifications. We note that a future improvement to the project would be to inject fake real and bogus detections into the data as a means to track performance. The Andromeda Project (Johnson et al. 2015) and Space Warps are examples of two citizen science projects to have taken this approach, while Goldstein et al. (2015) used faked detections to augement DES training data for their real-bogus classifier. With this approach we would no longer be reliant on the assumption that every expert label is correct, but we must be careful to ensure that injected fake sources are truly representative of our observations. Candidates with high scores as assigned by the machine are more likely to be real. However, although the machine successfully rejects the majority of bogus candidates, the sample produced by the simple cut on hypothesis is far from pure; 1403 real candidates from 3384 in the sample. Higher cutoffs run the risk of rejecting an increasing number of real candidates; requiring a 1% false positive rate will result in a
0 0.80
500
0 0.0
0.2
0.4
0.85
h(x)
0.6
0.90
0.95
0.8
1.00
1.0
Figure 2. The distribution of hypotheses, h(x) from the current 3π machine classifier for detected objects between MJD 57570 and MJD 57586. The light green shows the distribution of objects with h(x) ≤ 0.436 which are automatically rejected. The remaining objects promoted for human screening even at high values of h(x) contains many false positives. The first interval has a frequency of 12428, but the plot is truncated for clarity. Inset: Zoom-in of the region with h(x) > 0.8.
missed detection rate of 60.3%. In order to improve this performance, candidates which exceed the h(x) = 0.436 threshold (see Section 2.2) were also classified by volunteers via the Supernova Hunters project. The results of this analysis are shown in Figure 3. Volunteer classifications were combined using the simplest possible metric; the fraction of volunteers who identified a detection as real is assumed to be an estimate of the probability of that candidate being real, denoted P (real). Despite this simple procedure, the results show that volunteers could effectively distinguish between real and bogus classifications. However, the structure of the resulting distribution is strikingly different from that of the machine classifier. Whereas for machine classification, a threshold could be chosen to give a complete but not pure sample, with MNRAS 000, 1–10 (2016)
Human and machine classifications 400 350 300
0.8
bogus asteroid real
250 200
P(real)
frequency
1.0
bogus asteroid real
5
150 100
0.6 0.4
50 00.0
0.2
0.4
P(real)
0.6
0.8
1.0
Figure 3. The distribution of P (real) from Supernova Hunters for objects detected between MJD 57570 and MJD 57586. Compared with the machine h(x) in Figure 2 the objects at the extremes are pure. There are no real detections with P (real) < 0.04 and few bogus detections above 0.92.
volunteer classifications it is easier to construct a pure sample of candidates which are highly likely to be supernovae, but this sample is far from complete. There are candidates judged ‘real’ by experts even at low probabilities although there were no real candidates assigned P (real) < 0.04. There are two routes which might be expected to improve this performance. First, we could improve on the naive combination of volunteer votes described above. To this end citizen science projects typically explore methods to weight volunteer contributions (see, for example Schwamb et al. (2012), Willett et al. (2013) and Marshall et al. (2016)). Second, given that we have a human and machine score for every detection we could seek a combination of the two in the hope of benefiting from the different capabilities of both.
3.1
Combining human and machines
In a companion paper analysing performance of Galaxy Zoo, Beck et al. (tted) used a machine classifier running in parallel to a simulation of the Galaxy Zoo 2 project (Willett et al. 2013). They showed that the addition of such a classifier, which retired subjects classified above a certain level of confidence at the end of each day, retraining each time, can greatly accelerate the speed of classification in a data set. In their work, images are retired by either machine or human, whereas we set out in this section to use a combination. While they retrain their machine with volunteer input as it accumulates, we use a static training set derived from expert classifications. Figure 4 shows the combination of human and machine classifications. It is immediately apparent from the figure that no single threshold on either machine or human classification can outperform the combination of the two. This is an important result; it is the first time that the benefits of combining classification from both machines and volunteers has been clearly demonstrated using data from a live astronomical survey. MNRAS 000, 1–10 (2016)
0.2 0.00.0
0.2
0.4
h(x)
0.6
0.8
1.0
Figure 4. The P (real) from Supernova Hunters against the machine h(x) for 3384 detected objects between MJD 57570 and MJD 57586. P (real) and h(x) are combined by projecting the data onto the solid black line in the euclidean sense. A Spearman rank correlation test shows the correlation between P (real) and h(x) to be 0.237.
How should the two independent classifications be combined? We simply apply a decision boundary of the form τ = (x + y)/2 on the 2D surface, where 0 ≤ τ ≤ 1. For a constant value of τ a candidate is classified as bogus if [h(x) + P (real)]/2 0.5, but relatively few real detections below 0.5 in Figure 3. Another improvement could be with our machine classifier, which was trained at the beginning of the PSST survey and the algorithm was specifically chosen to learn from the limited amount of training data available. Given the large volume of data accumulated since, we could train more sophisticated algorithms that can learn more complex relationships between the features, though extracting robust labels for this additional data is a challenge that still needs to be addressed. This effort offers hope for dealing with the large data volumes from all sky surveys such as LSST, ZTF (Bellm 2014), ATLAS (Tonry et al. 2016) and Pan-STARRS2. We used machines to reject the vast majority of false positives and then combined the machine hypotheses with classifications from a few thousand citizen scientists for the remaining candidates. With Supernova Hunters we have not actively sought additional citizen scientists, beyond the ∼ 30000 volunteers on the Zooniverse beta testing e-mail list, who were asked to review the project before launch. New volunteers must “discover” the project on the Zooniverse projects page to participate. Given that we could actively seek the participation of ∼ 106 registered Zooniverse volunteers and assuming that 10% chose to participate, with the current classification rate (21000 in the first 24 hours each week from ∼6000 volunteers) we could achieve ∼ 350000 classifications per night. This provides 0.35 classifications for the ∼ 106 transient alerts expected from LSST at the beginning of the survey (Ridgway et al. 2014). If the false positive rate is an order of magnitude more than the transient alert rate (perhaps overly pessimistic given the expected ∼ 500-2200 false positives per field per visit (Becker et al. 2013) with a 5σ detection threshold) and assuming we can discard 90% of those with machine learning we can expect to achieve 0.175 citizen science classifications per promoted detection. Assuming
5
https://www.zooniverse.org/projects/zooniverse/ gravity-spy MNRAS 000, 1–10 (2016)
we will require roughly 10 classifications per detection before considering it classified, we are roughly two orders of magnitude short. Making up this deficit may be achievable with continued improvements to difference imaging (Zackay et al. 2016), automated real-bogus classification, encouraging greater participation from a growing community of citizen scientists and more efficient use of their classifications.
ACKNOWLEDGMENTS The Pan-STARRS1 Surveys have been made possible through contributions of the Institute for Astronomy, the University of Hawaii, the Pan-STARRS Project Office, the Max-Planck Society and its participating institutes, the Max Planck Institute for Astronomy, Heidelberg and the Max Planck Institute for Extraterrestrial Physics, Garching, The Johns Hopkins University, Durham University, the University of Edinburgh, Queen’s University Belfast, the HarvardSmithsonian Center for Astrophysics, the Las Cumbres Observatory Global Telescope Network Incorporated, the National Central University of Taiwan, the Space Telescope Science Institute, the National Aeronautics and Space Administration under Grant No. NNX08AR22G issued through the Planetary Science Division of the NASA Science Mission Directorate, the National Science Foundation under Grant No. AST-1238877, the University of Maryland, and Eotvos Lorand University (ELTE) and the Los Alamos National Laboratory. The development of the Zooniverse platform was supported by a Global Impact Award from Google. We also acknowledge support from STFC under grant ST/N003179/1. LF and MB were partially supported by the National Science Foundation under Grant No. AST-1413610. DW and LF were partially supported by the National Science Foundation under Grant No. IIS-1619177. We also wish to acknowledge the dedicated effort of our citizen scientists who have made this work possible.
REFERENCES Alard C., Lupton R. H., 1998, ApJ, 503, 325 Bailey S., Aragon C., Romano R., Thomas R. C., Weaver B. A., Wong D., 2007, ApJ, 665, 1246
10
D.E. Wright, C. J. Lintott, S.J. Smartt et al.
Banko M., Brill E., 2001, in Proceedings of the 39th Annual Meeting on Association for Computational Linguistics. ACL ’01. Association for Computational Linguistics, Stroudsburg, PA, USA, pp 26–33, doi:10.3115/1073012.1073017, http:// dx.doi.org/10.3115/1073012.1073017 Beck M., et al., submitted, MNRAS Becker A., Krughoff S., Connolly A., et al., 2013, in Report on Late Winter 2013 Production: Image Differencing (Tucson, AZ: LSST). https://dev.lsstcorp.org/trac/attachment/ wiki/DC/Winter2013/W13report_V1-02.pdf Bellm E., 2014, in Wozniak P. R., Graham M. J., Mahabal A. A., Seaman R., eds, The Third Hot-wiring the Transient Universe Workshop. pp 27–33 (arXiv:1410.8185) Bloom J. S., et al., 2012, PASP, 124, 1175 Bramich D. M., 2008, MNRAS, 386, L77 Brink H., Richards J. W., Poznanski D., Bloom J. S., Rice J., Negahban S., Wainwright M., 2013, MNRAS, 435, 1047 Campbell H., et al., 2015, The Astronomer’s Telegram, 7254 Coates A., Lee H., Ng A. Y., 2011, in AISTATS 2011. Dark Energy Survey Collaboration 2005, arXiv preprint astroph/0510346 Denneau L., et al., 2013, PASP, 125, 357 Donalek C., Mahabal A., Djorgovski S. G., Marney S., Drake A., Glikman E., Graham M. J., Williams R., 2008, in Bailer-Jones C. A. L., ed., American Institute of Physics Conference Series Vol. 1082, American Institute of Physics Conference Series. pp 252–256 (arXiv:0810.4945), doi:10.1063/1.3059057 Geach J. E., et al., 2015, MNRAS, 452, 502 Goldstein D. A., et al., 2015, AJ, 150, 82 Gwyn S. D. J., 2012, AJ, 143, 38 Huber M., et al., 2015, The Astronomer’s Telegram, 7153 Inserra C., et al., 2013, ApJ, 770, 128 Ivezi´ c Z., et al., 2008, preprint, (arXiv:0805.2366) Johnson L. C., et al., 2015, ApJ, 802, 127 Kaiser N., et al., 2010, in Society of Photo-Optical Instrumentation Engineers (SPIE) Conference Series. , doi:10.1117/12.859188 Keller S. C., et al., 2007, PASA, 24, 1 Law N. M., et al., 2009, PASP, 121, 1395 Magnier E. A., et al., 2013, ApJS, 205, 20 Marshall P. J., Lintott C. J., Fletcher L. N., 2015, ARA&A, 53, 247 Marshall P. J., et al., 2016, MNRAS, 455, 1171 Masci F. J., et al., 2017, Publications of the Astronomical Society of the Pacific, 129, 014002 Mattila S., et al., 2016, The Astronomer’s Telegram, 9308 Melchior P., et al., 2016, Astronomy and Computing, 16, 99 Ngiam J., Chen Z., Bhaskar S. A., Koh P. W., Ng A. Y., 2011, in Shawe-Taylor J., Zemel R., Bartlett P., Pereira F., Weinberger K., eds, , Advances in Neural Information Processing Systems 24. Curran Associates, Inc., pp 1125–1133, http://papers. nips.cc/paper/4334-sparse-filtering.pdf Rau A., et al., 2009, PASP, 121, 1334 Ridgway S. T., Matheson T., Mighell K. J., Olsen K. A., Howell S. B., 2014, ApJ, 796, 53 Romano R. A., Aragon C. R., Ding C., 2006, in Machine Learning and Applications, 2006. ICMLA’06. 5th International Conference on. pp 77–82 Schwamb M. E., et al., 2012, ApJ, 754, 129 Smartt S. J., et al., 2015, A&A, 579, A40 Smith A. M., et al., 2011, MNRAS, 412, 1309 Tonry J. L., et al., 2012, ApJ, 750, 99 Tonry J., Denneau L., Stalder B., Heinze A., Sherstyuk A., Rest A., Smith K. W., Smartt S. J., 2016, The Astronomer’s Telegram, 8680 Willett K. W., et al., 2013, MNRAS, 435, 2835 Wright D. E., et al., 2015, MNRAS, 449, 451 York D. G., et al., 2000, AJ, 120, 1579
Zackay B., Ofek E. O., Gal-Yam A., 2016, preprint, (arXiv:1601.02655) Zevin M., et al., 2017, Classical and Quantum Gravity, 34, 064003 du Buisson L., Sivanandam N., Bassett B. A., Smith M., 2015, MNRAS, 454, 2026 This paper has been typeset from a TEX/LATEX file prepared by the author.
MNRAS 000, 1–10 (2016)