Article pubs.acs.org/JACS
A Transition from Localized to Strongly Correlated Electron Behavior and Mixed Valence Driven by Physical or Chemical Pressure in ACo2As2 (A = Eu and Ca) Xiaoyan Tan,† Gilberto Fabbris,‡,§ Daniel Haskel,‡ Alexander A. Yaroslavtsev,∥,⊥ Huibo Cao,# Corey M. Thompson,† Kirill Kovnir,† Alexey P. Menushenkov,∥ Roman V. Chernikov,∇ V. Ovidiu Garlea,# and Michael Shatruk*,† †
Department of Chemistry and Biochemistry, Florida State University, Tallahassee, Florida 32306, United States Advanced Photon Source, Argonne National Laboratory, Argonne, Illinois 60439, United States § Department of Physics, Washington University, St. Louis, Missouri 63130, United States ∥ National Research Nuclear University MEPhI (Moscow Engineering Physics Institute), 115409, Moscow, Russia ⊥ European XFEL GmbH, 22761 Hamburg, Germany # Quantum Condensed Matter Division, Oak Ridge National Laboratory, Oak Ridge, Tennessee 37831, United States ∇ DESY Photon Science, 22603 Hamburg, Germany ‡
S Supporting Information *
ABSTRACT: We demonstrate that the action of physical pressure, chemical compression, or aliovalent substitution in ACo2As2 (A = Eu and Ca) has a general consequence of causing these antiferromagnetic materials to become ferromagnets. In all cases, the mixed valence triggered at the electropositive A site results in the increase of the Co 3d density of states at the Fermi level. Remarkably, the dramatic alteration of magnetic behavior results from the very minor ( 4σ(F0)] diff. peak and hole (e Å−3) goodness-of-fit
EuCo2As2
CaCo1.87(1)As2
293 0.71073 I4/mmm 3.929(1) 11.512(4) 177.8(1) 2 0.05 × 0.05 × 0.02 7.843 44.861 36.295 1302 160 10 0.019 0.019, 0.049 1.31, −2.72 1.26
293 0.71073 I4/mmm 3.9927(2) 10.3133(6) 164.42(1) 2 0.03 × 0.02 × 0.02 6.217 31.324 42.02 1464 206 10 0.020 0.020, 0.048 1.41, −1.28 1.16
Ca0.901(3)Eu0.099(3)Co1.906(8)As2 0.88(1): 0.12(1) 293 0.71073 I4/mmm 3.9984(2) 10.3696(2) 165.79(9) 2 0.06 × 0.04 × 0.01 6.390 32.767 44.929 1823 235 11 0.026 0.026, 0.058 0.93, −2.23 1.20
Ca0.845(4)La0.155(4)Co1.88(1)As2 0.84(2): 0.16(2) 293 0.71073 I4/mmm 4.0018(2) 10.3726(8) 166.11(2) 2 0.06 × 0.03 × 0.02 6.351 32.100 45.316 1292 232 10 0.034 0.026, 0.064 1.81, −1.50 1.19
a
The crystal structure refinements of EuCo2As2 and CaCo2As2 are shown for comparison. Further details of the crystal structure determination of Ca0.9Eu0.1Co1.91As2 and Ca0.85La0.15Co1.89As2 may be obtained from Fachinformationszentrum Karlsruhe, D-76344 Germany, on quoting the depository numbers CSD-430337 and CSD-430338, respectively. were cut into small pieces. Cobalt powder (Alfa Aesar, 99.5%) was additionally purified by heating under a flow of H2 gas at 773 K for 5 h. All manipulations during sample preparation were carried out in an argon-filled drybox (content of O2 < 1 ppm). Caution! Arsenic is a toxic element and should be handled and disposed of following proper safety procedures. It is recommended to use a protective mask when preparing or grinding As-containing samples. Synthesis. The starting materials for the synthesis of EuCo2As2 were mixed in the Eu/Co/As/Bi = 2:2:2:30 ratio (total mass = 5 g) and loaded into 10 mm inner diameter (i.d.) carbonated silica tubes, which were then sealed under vacuum (99%) were acquired through the Materials Preparation Center at Ames Laboratory, which is supported by the U.S. Department of Energy, Basic Energy Sciences. Eu and Ca metals 2725
DOI: 10.1021/jacs.5b12659 J. Am. Chem. Soc. 2016, 138, 2724−2731
Article
Journal of the American Chemical Society
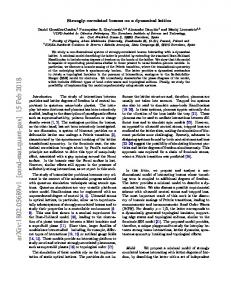
obtained by annealing a mixture of elements in Bi flux at 1223 K. The flux was subsequently removed by washing with a mixture of H2O2 and glacial CH3COOH. For the purpose of comparing the structures of Ca 0.9 Eu 0.1 Co 1.91 As 2 and Ca0.85La0.15Co1.89As2 with that of the parent compound, we also prepared CaCo1.87As2 in the similar fashion. The phase purity of products obtained was confirmed by powder X-ray diffraction. On the basis of single-crystal X-ray diffraction data, the crystal structures were solved in the I4/mmm space group, with all compounds being of the ThCr2Si2 structure type (Table 1). The refinement of the single-crystal compositions led to the Ca/Eu and Ca/La ratios that were in good agreement with the results of EDX analysis and also close to those of the nominal compositions (Table 1). The crystal structure refinements also revealed vacancies in the Co sites for all but the EuCo2As2 structure. The presence of vacancies in CaCo2As2 was also confirmed by the Rietveld refinement of neutron powder diffraction data that resulted in the composition CaCo1.89As2 (Figure S1 and Table S1). These findings are in agreement with the observation of Co vacancies both in CaCo1.86As2 obtained via Sn-flux method20,21 and in RCo2−δAs2 (R = La−Nd) prepared in Bi flux or by solid-state reactions.11,19,22 The full occupancy of the Co site in the crystal structure of EuCo2As2 also agrees with the previous report.8 The structures are built of [Co2As2] layers that alternate along the c axis with layers of electropositive atoms (Figure 1).
polycrystalline powders with a Quantum Design SQUID magnetometer MPMS-XL; dc magnetization was measured in an applied field of 1 mT, 0.1 T, or 0.2 T in the 1.8−300 K range. Field-dependent magnetization was measured at 1.8 K with the applied magnetic field varying from 0 to 7 T. Neutron Diffraction. Single-crystal and powder neutron diffraction experiments were performed at the High-Flux Isotope Reactor at Oak Ridge National Laboratory. A large single crystal of EuCo2As2 (∼2 × 2 × 0.2 mm3) was mounted on the stage of the HB-3A fourcircle single-crystal diffractometer. Neutrons with wavelength of λ = 1.003 Å were generated from bent silicon monochromator.14 The data were collected at 60 and 5 K. The selected (0 0 2.79) magnetic peak was measured as a function of temperature to determine the magnetic ordering temperature. Absorption correction was applied using the PLATON software.15 The nuclear and magnetic structure refinements were performed with the FULLPROF software.16 Powder neutron diffraction experiments on CaCo1.87As2 were carried out using the HB2A high-resolution neutron powder diffractometer. The sample was held in a cylindrical vanadium container placed in a top-loading closedcycle refrigerator. The data were collected at 1.5 K with the wavelength λ = 2.406 Å. Rietveld refinement was carried out using FULLPROF.16 X-ray Absorption Near-Edge Structure and X-ray Magnetic Circular Dichroism Measurements. High-pressure XANES and XMCD spectra of EuCo2As2 and EuCo2P2 were measured at the Eu L3 edge using a transmission geometry at beamline 4-ID-D of the Advanced Photon Source, Argonne National Laboratory. A membrane-driven CuBe diamond anvil cell (DAC) was prepared with a partially perforated anvil placed opposite to a fully perforated anvil with a mini anvil on top. The culet diameter was 600 μm. A 250 μm hole was drilled as sample chamber on a stainless-steel gasket preindented to a thickness of 80 μm. A polycrystalline sample of EuCo2As2 or EuCo2P2 was ground and sieved though a mesh to afford a fine powder with grain size of ∼4−5 μm, which was then mixed with silicon oil used as pressure-transmitting medium. A few ruby chips were also loaded with the sample for pressure calibration. The DAC was inserted into a 6.5 T magnet equipped with a helium flow system for cooling down to 1.4 K. The pressure was controlled and calibrated in situ using the He gas membrane and an on-line ruby luminescence system inserted into one of the radial re-entrant bores of the split superconducting magnet. The XMCD experiments were performed with magnetic field applied parallel and antiparallel to the incident photon wave vector to remove any artifact signal. XANES spectra of Ca0.9Eu0.1Co1.91As2 were obtained at the Eu L3 edge in a transmission mode using Si(111) monochromator. The experiment was performed at the beamline mySpot of BESSY-II storage ring (HZB, Berlin, Germany). Quantum−Chemical Calculations. Density functional band structure calculations and the interatomic crystal orbital Hamilton population (COHP) analysis were performed with the tight-binding− linear-muffin-tin-orbitals−atomic-sphere-approximation (TB-LMTOASA) software package.17 The von Barth−Hedin exchange-correlation potential was applied for the local density approximation (LDA) calculation.18 The radial scalar−relativistic Dirac equation was solved to obtain the partial waves. No empty spheres had to be added. The calculations contained a basis set of Eu 6s/5d/(6p) with Eu 4f treated as the core, Co 4s/4p/3d, and As 4s/4p/(4d) (downfolded orbitals in parentheses). The integrations were performed over the reciprocal unit cells based on a 12 × 12 × 24 mesh of 3456 k-points in the irreducible wedge of the Brillouin zone. The unit cell parameters were taken from the structural data at ambient pressure and 7.5 GPa as reported earlier.10
Figure 1. Crystal structure of ACo2As2 (A = Ca and Eu). Color scheme: A = green, Co = magenta, and As = yellow.
In all structures, the [Co2As2] layer is held together by Co−As bonds at ∼2.34 Å (Table 2). The Co−Co intralayer distance, which is related to the unit cell parameter, dCo−Co = a/√2, equals 2.8233(1) Å in CaCo1.87As2 and 2.7782(9) Å in EuCo2As2. Because the ionic radius of Eu2+(1.25 Å) is substantially larger than that of Ca2+ (1.12 Å), the As−As distance, which defines the separation between the [Co2As2] layers along the c axis, changes dramatically from 2.73 Å in Table 2. Interatomic Distances in the Crystal Structures of EuCo2As2, CaCo1.87As2, Ca0.9Eu0.1Co1.91As2, and Ca0.85La0.15Co1.89As2
■
RESULTS AND DISCUSSION Synthesis and Crystal Structures. As shown in our previous work, reactions in Bi flux provide an effective method for the preparation of phase-pure ternary arsenides and the growth of representative single crystals.11,19 Using this approach, the polycrystalline and single-crystal samples of EuCo2As2, Ca0.9Eu0.1Co1.91As2, and Ca0.85La0.15Co1.89As2 were 2726
compound
Co−Co (Å)
Co−As (Å)
As−As (Å)
EuCo2As2 CaCo1.87As2 Ca0.9Eu0.1Co1.91As2 Ca0.85La0.15Co1.89As2
2.7782(9) 2.8233(1) 2.8274(1) 2.8297(1)
2.3441(7) 2.3351(2) 2.3390(2) 2.3372(4)
3.198(2) 2.7342(9) 2.7563(8) 2.771(1)
DOI: 10.1021/jacs.5b12659 J. Am. Chem. Soc. 2016, 138, 2724−2731
Article
Journal of the American Chemical Society CaCo1.87As2 to 3.20 Å in EuCo2As2. In the structures of Ca0.9Eu0.1Co1.91As2 and Ca0.85La0.15Co1.89As2, both the Co−Co and As−As distances increase slightly compared to those of CaCo1.87As2, confirming the successful substitution of Eu or La for Ca atoms. LP-EuCo2As2: Magnetic Structure. A large platelike crystal (2 × 2 × 0.2 mm3) was used for magnetic susceptibility and neutron diffraction studies on EuCo2As2 at ambient pressure. The temperature dependence of magnetic susceptibility (χ) confirms the AFM ordering of Eu2+ 4f moments in the ab plane at TN = 47 K (Figure 2a), which agrees with the
EuCo2As2: XANES and XMCD Spectra. The previous Xray powder diffraction study revealed that EuCo2As2 undergoes a structural collapse at 4.7 GPa,10 although it is a second-order transition, not a first-order one as seen in EuCo2P2.7 To study the effect of pressure on the magnetic behavior of EuCo2As2, we carried out Eu L3 XANES and XMCD measurements on a polycrystalline sample that was ground and sieved to afford a fine powder with ∼4−5 μm particle size. At ambient pressure and 300 K, a single absorption peak was observed at 6.975 keV, corresponding to the Eu2+ state (Figure 3a). At 3.1 GPa, a weak
Figure 2. (a) Temperature dependence of field-cooled magnetic susceptibility measured on an oriented single crystal of EuCo2As2 in the applied magnetic field of 0.1 T. (b) Magnetic structure of EuCo2As2 (Eu = green, Co = magenta, and As = yellow). (c) Integrated intensity of the (0 0 2.79) magnetic peak as a function of temperature.
Figure 3. (a) Eu L3 XANES spectra of EuCo2As2 at 300 K and variable pressure. Inset: the average Eu valence as a function of pressure. (b) Eu L3 XANES spectra of EuCo2P2 at 10 K and variable pressure.
peak at 6.983 keV became resolved, indicating the evolution of the Eu3+ state. As the pressure increased, the intensity of the Eu3+ peak continued to grow, with a concomitant suppression of the Eu2+ contribution. The intensity redistribution slowed down at higher pressure, although the concentration of Eu3+ continued to increase even above 11.4 GPa. A similar behavior was observed at 4.2 K (Figure S2). These observations indicate the stabilization of a mixed-valent Eu state in EuCo2As2 under applied pressure. Such behavior differs drastically from that of EuCo2P2, which showed a nearly complete conversion from the Eu2+ to the Eu3+ state as the pressure was increased (Figure 3b). The evaluation of the average Eu oxidation state from the XANES spectra revealed that the critical pressure for the second-order phase transition in EuCo2As2 is ∼4.6 GPa (valence inflection point in Figure 3a, inset) which agrees well with the value of 4.7 GPa established by powder X-ray diffraction.10 The maximum oxidation state achieved at 12.6 GPa was +2.25(2). In contrast, EuCo2P2 exhibits a nearly pure Eu3+ state above 6 GPa (Figure 3b). The pressure-induced valence change in EuCo2As2 is reversible; the Eu2+ state was restored after the pressure had been released.
previous reports.8,9 Fitting the high-temperature dependence of /χ to the Curie−Weiss law resulted in a positive Weiss constant of θ = 20 K, which indicates FM nearest-neighbor interactions. The magnetic structure of EuCo2As2 was established by single-crystal neutron diffraction. The magnetic structure refinement showed the presence of ordered magnetic moments only on Eu sites. (The moment refined on the Co site was zero within an esd of 0.2 μB.) The 4f moments align FM in the ab plane of the tetragonal lattice, but adopt an incommensurate AFM spiral structure with a propagation k-vector of (0, 0, 0.79) along the c axis (Figure 2b). The ordering temperature, determined from the dependence of integrated intensity of (0 0 2.79) magnetic peak (Figure 2c), coincided with the value of 47 K obtained from the susceptibility data. The refined moment for Eu was 7.26(8) μB, close to the theoretical expectation of 7.0 μB per Eu2+ ion. The magnetic ordering and magnetic structure of EuCo2As2 at ambient pressure are very similar to those of EuCo2P2, which also exhibits the AFM spiral structure with k = (0, 0, 0.85).23 1
2727
DOI: 10.1021/jacs.5b12659 J. Am. Chem. Soc. 2016, 138, 2724−2731
Article
Journal of the American Chemical Society
moments via the Eu(5d)−Co(3d) hybridization effect.24 Unfortunately, we could not detect a measurable XMCD signal at the Co K-edge at 7.5 GPa, even when the field was increased to 2 T. On the one hand, the signal might be too weak, taking into account that the moment per Co atom in other RCo2As2 phases is ∼0.5 μB11 and that the K-edge absorption probes the s → p transitions, thus involving the 3d electron density only indirectly. On the other hand, the use of softer X-rays to probe the Co L2,3 edge is incompatible with the DAC used in the experiments under pressure. In EuCo2P2, the transition from the localized Eu 4f magnetism in the LP phase to the itinerant Co 3d magnetism in the HP phase is accompanied by the dramatic increase in TN from 66 to 260 K.6 The magnetic behavior of HP-EuCo2P2 is reminiscent of that observed at ambient pressure for RCo2P2 materials (R = Ce, Pr, and Nd), which show AFM ordering of Co moments above 300 K. Likewise, the ordering temperature in HP-EuCo2As2 (TC = 125 K) is much higher than the value of TN = 47 K for LP-EuCo2As2. Moreover, the TC falls in the range established for the FM ordering of Co moments in RCo2As2 materials, TC ≈ 60−200 K.11 Hence, we believe that these findings support the emergence of FM ordering in the Co sublattice of HP-EuCo2As2. EuCo2As2: Electronic Structure. To obtain additional support for the possibility of the pressure-induced FM ordering of Co 3d moments in HP-EuCo2As2, we performed electronic band structure calculations using the structural parameters determined for EuCo2As2 at ambient pressure and at 7.5 GPa.10 A comparison of the density of states (DOS) at different pressures reveals a substantially stronger contribution from the Co 3d orbitals at the Fermi level (EF) in the HP structure (Figure 6a). The product of the exchange constant (JCo−Co)25 and the Co 3d DOS at EF (NF) increased from 0.67 at ambient pressure to 1.07 at 7.5 GPa. Thus, the Stoner criterion for ferromagnetism (JNF > 1) becomes satisfied only in the HPEuCo2As2. It is interesting to point out that the applied pressure alters both the character of the 3d DOS in the vicinity of the Fermi level and the filling of the 3d states due to the pressure-induced Eu(4f) → Co(3d) electron transfer. The latter becomes obvious from the changes observed in the COHP (Figure 6b). Although in the LP-EuCo2As2 structure the Fermi level crosses essentially nonbonding Co−Co states (COHP ≈ 0), in the HP-EuCo2As2 structure it crosses strongly antibonding states (−COHP < 0). Strong antibonding interactions in itinerant systems have been shown to promote magnetic ordering.26 All these findings lend support to the hypotheses of itinerant Co 3d ferromagnetism in HP-EuCo2As2. One can also consider a simplified picture of formal charges on the Co and As atoms during the pressure-induced structural collapse. In the LP-EuCo2As2, the large separation between the As atoms along the c axis suggests they have the formal −3 oxidation state. This results in the formal oxidation state of +2 for Co. In the collapsed structure of HP-EuCo2As2, the formation of a weakly covalent As−As interaction implies that the formal oxidation state of As becomes less negative whereas the oxidation state of Eu increases to +2.25 at 12.6 GPa. Both these factors should contribute to the decrease in the formal oxidation state of Co, or in other words, in the increased valence electron count per Co atom. This change agrees with the increase in the population of the Co−Co antibonding states under higher pressure as found by the band structure
To probe the nature of magnetic ordering in the Eu sublattice, we recorded 4.2 K XMCD spectra at 1.0 and 7.5 GPa, i.e., below and above the critical pressure for the phase transition observed for EuCo2As2. XMCD at Eu L3 absorption edge is sensitive to the ordering of 4f moments by means of intra-atomic 4f−5d exchange.24 The XMCD signal thus provides a measure of magnetization in the 4f sublattice. A weak XMCD signal at 1 GPa (blue curve in Figure 4a) was
Figure 4. (a) Eu L3 XMCD spectra of EuCo2As2 at 1.0 and 7.5 GPa measured at 4.2 K and 1 T. (b) Eu L3 XMCD spectra of EuCo2P2 at 0.9 and 11.3 GPa measured at 10 K and 0.4 T.
attributed to a small FM component that appears when the AFM-ordered Eu2+ moments are canted by the 1 T applied magnetic field. A similar weak signal was also observed in the XMCD spectrum of EuCo2P2 at 0.9 GPa (Figure 4b; compare the scale to that in Figure 4a). When the pressure was increased to 11.3 GPa, the XMCD peak vanished for EuCo2P2, which is in agreement with the nearly complete transition to the nonmagnetic Eu3+ ground state. For EuCo2As2, however, the amplitude of the XMCD signal increased dramatically under 7.5 GPa (red curve). Keeping in mind that the partial (25%) Eu2+→ Eu3+ transition established from the XANES spectra should decrease the concentration of the magnetic Eu2+ centers, the drastic increase in the Eu L3 XMCD signal in HP-EuCo2As2 suggests a change in the character of the magnetically ordered state. Indeed, the field dependence of the XMCD signal amplitude of EuCo2As2 measured at 4.2 K and 7.5 GPa reveals magnetization behavior that is indicative of a FM or ferrimagnetic (FiM) rather than AFM ordering (Figure 5a).
Figure 5. (a) Field and (b) temperature dependences of the 7.5 GPa Eu L3 XMCD amplitude for EuCo2As2 measured at the temperature of 4.2 K and at the applied magnetic field of 1 T, respectively.
The temperature dependence of the XMCD signal amplitude as order parameter measured at 7.5 GPa and 1 T also suggests FM or FiM ordering with TC = 125 K (Figure 5b). Moreover, this finding lends support to the pressure-induced itinerant magnetism in the Co sublattice, as will be discussed below. It is possible that the strong XMCD at Eu L3 edge in HPEuCo2As2 also has a contribution from the ordering of Co 3d 2728
DOI: 10.1021/jacs.5b12659 J. Am. Chem. Soc. 2016, 138, 2724−2731
Article
Journal of the American Chemical Society
Figure 6. (a) Density of states and (b) Co−Co crystal orbital Hamilton population of EuCo2As2 at 0 GPa (left) and 7.5 GPa (right). The contribution from the Co 3d orbitals is shaded red. The Fermi level is indicated with a dotted black line.
calculations (Figure 6b). Furthermore, it is in line with similar observations made for EuCo2P2.6,27 Ca0.9Eu0.1Co1.91As2. To demonstrate further the effect of mixed valence on itinerant magnetism in this family of structures, we used chemical compression and direct electron doping to induce mixed valence in the electropositive crystallographic site of CaCo1.87As2 and increase the population of the Co 3d subband. Magnetic measurements on CaCo1.87As2 revealed AFM ordering at TN ≈ 79 K under ambient pressure (Figure S3), which is consistent with the behavior reported earlier.28,29 The ionic radius of Ca2+ (1.12 Å) is closer to the ionic radius of Eu3+ (1.07 Å) than to the one of Eu2+ (1.25 Å). We have shown previously that such discrepancy in ionic radii can be used to induce a substantial chemical pressure on the Eu2+ site substituted into a lattice that is more appropriate to host Eu 3 + ions. 3 0 To this end, we synthesized Ca0.9Eu0.1Co1.91As2 and examined it with XANES spectroscopy. The experiment revealed the average Eu oxidation state of +2.18 (Figure 7), confirming the successful achievement of the mixed-valent state by chemical compression. The compound shows FM ordering with TC = 110 K (Figure 8a). Given the low concentration of Eu sites, such ordering
Figure 8. Temperature dependence of field-cooled (FC, red) and zero-field-cooled (ZFC, black) magnetization at 1 mT and field dependence of magnetization at 1.8 K (inset) for (a) Ca0.9Eu0.1Co1.91As2 and (b) Ca0.85La0.15Co1.89As2.
must originate, in the first place, from the Co sublattice. The theoretically expected moment from Eu2.18+ state is 0.6 μB per Ca0.9Eu0.1Co1.91As2 formula unit (f.u.). Hence, the saturation magnetization of 1.4 μB at 1.8 K suggests FM coupling between Eu and Co moments, with the moment of 0.4 μB per Co atom. This value is similar to those observed for FM-ordered Co moments in RCo2As2.11 The emergence of ferromagnetism in Ca0.9Eu0.1Co1.91As2 under ambient pressure is remarkable, given the AFM ordering in both CaCo1.87As2 and EuCo2As2 under the same conditions and especially the fact that only 0.018 of an electron per f.u. is transferred from the Eu 4f states to the Co 3d subband due to the chemical compression. This finding also indirectly supports the possibility of FM ordering of Co moments in the HP-EuCo2As2 that contains mixed-valent Eu sites. Ca0.85La0.15Co1.89As2. To eliminate completely the influence of the Eu2+ magnetic moments and visualize the role of pure electron doping on the magnetic behavior of Co sublattice, we substituted 10% of Ca2+ ions in CaCo1.87As2 with diamagnetic La3+ (ionic radius 1.16 Å). The formula Ca0.85La0.15Co1.89As2, established by the X-ray crystal structure determination and EDX analysis, suggests that 0.15 extra
Figure 7. L3 Eu XANES spectrum of Ca0.9Eu0.1Co1.91As2 at 91 K. 2729
DOI: 10.1021/jacs.5b12659 J. Am. Chem. Soc. 2016, 138, 2724−2731
Journal of the American Chemical Society
■
electrons per f.u. are donated into the Co 3d subband upon the partial substitution of La3+ for Ca2+ ions. Ca0.85La0.15Co1.89As2 exhibits FM ordering at TC = 130 K, with the saturation magnetization of 0.4 μB per Co atom (Figure 8b). Both values are in excellent agreement with those observed for Ca0.9Eu0.1Co1.91As2, thus confirming that it is indeed the electron doping into the Co layer that induces itinerant ferromagnetism in HP-EuCo2As2, Ca0.9Eu0.1Co1.91As2, and Ca0.85La0.15Co1.89As2. The extent of electron transfer required to trigger the FM ordering of Co moments in Ca0.9Eu0.1Co1.91As2 (0.018 electrons per f.u.) is much smaller than the electron transfer achieved in Ca0.85La0.15Co1.89As2 (0.15 electrons per f.u.). Thus, the FM ordering in Ca1−xLaxCo2−yAs2 can be expected even at lower doping levels of La. It is also interesting to point out that the Co−Co distances increase slightly upon substitution of Eu or La for Ca in CaCo1.87As2 (see Table 2). Such increase appears normal for Ca0.85La0.15Co1.91As2 because the Co−Co distance in LaCo2As2 (2.8634 Å)11 is larger than the one in CaCo1.87As2 (2.8233 Å). In contrast, the Co−Co distance in EuCo2As2 (2.7782 Å) is substantially smaller than the one in CaCo1.87As2. The increase in the interlayer Co−Co separation in Ca0.9Eu0.1Co1.91As2 might be related to the emergence of FM ordering in the Co sublattice. Indeed, our previous studies of isostructural solid solutions La1−xRxCo2P2 (R = Pr and Nd) demonstrated that the FM ordering always favors longer Co−Co distances.31,32 These observations call for a more detailed investigation of the nonlinear change in the a parameter and Co−Co distances and the extent of doping required to trigger ferromagnetism in the Co sublattice. These questions can be addressed by studying the entire range of solid solutions Ca1−xEuxCo2−yAs2 and Ca1−xLaxCo2−yAs2. The work on these systems is currently under way in our laboratories, and the results will be reported in due course.
Article
ASSOCIATED CONTENT
S Supporting Information *
The Supporting Information is available free of charge on the ACS Publications website at DOI: 10.1021/jacs.5b12659. XANES spectra of EuCo2As2 at 4 K and DOS and COHP of EuCo2As2. (PDF) Crystallographic information file for EuCo2As2. (CIF) Crystallographic information file for CaCo1.87As2. (CIF) Crystallographic information file for Ca0.90Eu0.10Co1.91As2. (CIF) Crystallographic information file for Ca0.845La0.15Co1.89As2. (CIF)
■
AUTHOR INFORMATION
Corresponding Author
*E-mail:
[email protected]. Present Addresses
C.M.T.: Department of Chemistry, Purdue University, 560 Oval Dr., West Lafayette, IN 47907, USA. K.K.: Department of Chemistry, University of California, Davis, One Shields Ave., Davis, CA 95616, USA. Funding
This work was supported by the National Science Foundation (Award DMR-1507233 to M.S.). The work at the Oak Ridge National Laboratory was sponsored by the Scientific User Facilities Division, Office of Basic Energy Sciences, U.S. Department of Energy (DOE). The use of the Advanced Photon Source at Argonne National Laboratory was supported by U.S. DOE under Contract No. DEAC02−06CH11357. A.P.M. and A.A.Y. thank the Russian Scientific Foundation (project 14−22−00098) for support. Notes
The authors declare no competing financial interest.
■
■
ACKNOWLEDGMENTS We acknowledge Helmholtz-Zentrum Berlin for providing the beamtime at the BESSY-II storage ring, Dr. Ivo Zizak and Dr. Dirk Wallacher for support during the experiment.
CONCLUSIONS We have investigated the valence changes and magnetic phase transitions in ACo2As2 (A = Eu and Ca) as influenced by physical pressure, chemical compression, and aliovalent substitution. All these factors induce mixed valence in the electropositive metal A-site, causing electron doping into the Co 3d subband. The pressure-induced structural phase transition in EuCo2As2 around 4.7 GPa induces mixed valence with the average oxidation state of Eu equal to +2.25. This change in the electronic structure breaks down the AFM ordering in the Eu sublattice because both Eu (4f) and Co (3d) moments become FM-ordered with TC = 125 K in HPEuCo2As2. Although the FM ordering of Eu 4f moments was confirmed directly by XMCD experiment, the FM ordering of Co 3d moments was established indirectly by electronic band structure calculations and by investigation of Ca0.9Eu0.1Co1.91As2 and Ca0.85La0.15Co1.89As2. In the latter compounds, the itinerant 3d ferromagnetism in the Co sublattice is triggered by mixed valence of the A site due to chemical compression and by direct electronic doping into the Co layer due to aliovalent substitution, respectively. This work demonstrates the highly sensitive nature of itinerant magnetism in EuCo2As2 and CaCo2As2 to electronic doping effects and the unifying action of physical pressure, chemical compression, and aliovalent substitution on triggering the electronic doping to achieve dramatic changes in the magnetism of these systems.
■
ABBREVIATIONS HP, high-pressure; LP, low-pressure; FM, ferromagnetic; AFM, antiferromagnetic; FiM, ferromagnetic; XANES, X-ray absorption near-edge structure; XMCD, X-ray magnetic circular dichroism; DAC, diamond anvil cell; DOS, density of states; TB-LMTO-ASA, tight binding-linear muffin tin orbitals-atomic sphere approximation; LDA, local density approximation
■
REFERENCES
(1) (a) Rotter, M.; Pangerl, M.; Tegel, M.; Johrendt, D. Angew. Chem., Int. Ed. 2008, 47, 7949−7952. (b) Yuan, H. Q.; Singleton, J.; Balakirev, F. F.; Baily, S. A.; Chen, G. F.; Luo, J. L.; Wang, N. L. Nature 2009, 457, 565−568. (c) Torikachvili, M. S.; Bud’ko, S. L.; Ni, N.; Canfield, P. C. Phys. Rev. Lett. 2008, 101, 057006. (d) Han, J. T.; Zhou, J. S.; Cheng, J. G.; Goodenough, J. B. J. Am. Chem. Soc. 2010, 132, 908−909. (2) Jia, S.; Jiramongkolchai, P.; Suchomel, M. R.; Toby, B. H.; Checkelsky, J. G.; Ong, N. P.; Cava, R. J. Nat. Phys. 2011, 7, 207−210. (3) Mizoguchi, H.; Hosono, H. J. Am. Chem. Soc. 2011, 133, 2394− 2397. (4) Zhao, K.; Deng, Z.; Wang, X. C.; Han, W.; Zhu, J. L.; Li, X.; Liu, Q. Q.; Yu, R. C.; Goko, T.; Frandsen, B.; Liu, L.; Ning, F.; Uemura, Y. J.; Dabkowska, H.; Luke, G. M.; Luetkens, H.; Morenzoni, E.; 2730
DOI: 10.1021/jacs.5b12659 J. Am. Chem. Soc. 2016, 138, 2724−2731
Article
Journal of the American Chemical Society Dunsiger, S. R.; Senyshyn, A.; Böni, P.; Jin, C. Q. Nat. Commun. 2013, 4, 1442. (5) Miller, G. J. Chem. Soc. Rev. 2006, 35, 799−813. (6) Chefki, M.; Abd-Elmeguid, M. M.; Micklitz, H.; Huhnt, C.; Schlabitz, W.; Reehuis, M.; Jeitschko, W. Phys. Rev. Lett. 1998, 80, 802−805. (7) Huhnt, C.; Schlabitz, W.; Wurth, A.; Mewis, A.; Reehuis, M. Phys. Rev. B: Condens. Matter Mater. Phys. 1997, 56, 13796−13804. (8) Raffius, H.; Mörsen, E.; Mosel, B. D.; Müller-Warmuth, W.; Jeitschko, W.; Terbüchte, L.; Vomhof, T. J. Phys. Chem. Solids 1993, 54, 135−144. (9) Ballinger, J.; Wenger, L. E.; Vohra, Y. K.; Sefat, A. S. J. Appl. Phys. 2012, 111, 07E106. (10) Bishop, M.; Uhoya, W.; Tsoi, G.; Vohra, Y. K.; Sefat, A. S.; Sales, B. C. J. Phys.: Condens. Matter 2010, 22, 425701. (11) Thompson, C. M.; Tan, X.; Kovnir, K.; Garlea, V. O.; Gippius, A. A.; Yaroslavtsev, A. A.; Menushenkov, A. P.; Chernikov, R. V.; Büttgen, N.; Krätschmer, W.; Zubavichus, Y. V.; Shatruk, M. Chem. Mater. 2014, 26, 3825−3837. (12) SMART and SAINT; Bruker AXS Inc.: Madison, WI, 2007. (13) Sheldrick, G. M. Acta Crystallogr., Sect. A: Found. Crystallogr. 2008, 64, 112−122. (14) Chakoumakos, B. C.; Cao, H.; Ye, F.; Stoica, A. D.; Popovici, M.; Sundaram, M.; Zhou, W.; Hicks, J. S.; Lynn, G. W.; Riedel, R. A. J. Appl. Crystallogr. 2011, 44, 655−658. (15) Spek, A. L. Acta Crystallogr., Sect. D: Biol. Crystallogr. 2009, 65, 148−155. (16) Rodríguez-Carvajal, J. Phys. B 1993, 192, 55−69. (17) Tank, R.; Jepsen, O.; Burkhardt, A.; Andersen, O. K. The program TB-LMTO-ASA, version 4.7; Max-Planck-Institut fur Festkorperforschung: Stuttgart, Germany, 1999. (18) Von Barth, U.; Hedin, L. J. Phys. C: Solid State Phys. 1972, 5, 1629−1642. (19) Thompson, C. M.; Kovnir, K.; Eveland, S.; Herring, M. J.; Shatruk, M. Chem. Commun. 2011, 47, 5563−5565. (20) Quirinale, D. G.; Anand, V. K.; Kim, M. G.; Pandey, A.; Huq, A.; Stephens, P. W.; Heitmann, T. W.; Kreyssig, A.; McQueeney, R. J.; Johnston, D. C.; Goldman, A. I. Phys. Rev. B 2013, 88, 174420. (21) Anand, V. K.; Dhaka, R. S.; Lee, Y.; Harmon, B. N.; Kaminski, A.; Johnston, D. C. Phys. Rev. B: Condens. Matter Mater. Phys. 2014, 89, 214409. (22) Shen, S.; Wang, G.; Jin, S.; Huang, Q.; Ying, T.; Li, D.; Lai, X.; Zhou, T.; Zhang, H.; Lin, Z.; Wu, X.; Chen, X. Chem. Mater. 2014, 26, 6221−6225. (23) Reehuis, M.; Jeitschko, W.; Möller, M. H.; Brown, P. J. J. Phys. Chem. Solids 1992, 53, 687−690. (24) de Groot, F.; Kotani, A. Core Level Spectroscopy of Solids; CRC Press: Boca Raton, FL, 2008. (25) The magnetic exchange constant for the intralayer Co−Co interactions can be approximated by the value established for the metallic cobalt in Janak, J. F. Phys. Rev. B 1977, 16, 255−262. (26) Landrum, G. A.; Dronskowski, R. Angew. Chem., Int. Ed. 2000, 39, 1560−1585. (27) Ni, B.; Abd-Elmeguid, M. M.; Micklitz, H.; Sanchez, J. P.; Vulliet, P.; Johrendt, D. Phys. Rev. B 2001, 63, 100102. (28) Cheng, B.; Hu, B. F.; Yuan, R. H.; Dong, T.; Fang, A. F.; Chen, Z. G.; Xu, G.; Shi, Y. G.; Zheng, P.; Luo, J. L.; Wang, N. L. Phys. Rev. B: Condens. Matter Mater. Phys. 2012, 85, 144426. (29) Ying, J. J.; Yan, Y. J.; Wang, A. F.; Xiang, Z. J.; Cheng, P.; Ye, G. J.; Chen, X. H. Phys. Rev. B: Condens. Matter Mater. Phys. 2012, 85, 214414. (30) Kovnir, K.; Reiff, W. M.; Menushenkov, A. P.; Yaroslavtsev, A. A.; Chernikov, R. V.; Shatruk, M. Chem. Mater. 2011, 23, 3021−3024. (31) Kovnir, K.; Thompson, C. M.; Zhou, H. D.; Wiebe, C. R.; Shatruk, M. Chem. Mater. 2010, 22, 1704−1713. (32) Thompson, C. M.; Kovnir, K.; Garlea, V. O.; Choi, E. S.; Zhou, H. D.; Shatruk, M. J. Mater. Chem. C 2014, 2, 7561−7569.
2731
DOI: 10.1021/jacs.5b12659 J. Am. Chem. Soc. 2016, 138, 2724−2731