Energies 2012, 5, 157-167; doi:10.3390/en5010157 OPEN ACCESS
energies ISSN 1996-1073 www.mdpi.com/journal/energies Article
A Two-Dimensional Cloud Model for Condition Assessment of HVDC Converter Transformers Jian Li 1,*, Zhiman He 1, Youyuan Wang 1, Jinzhuang Lv 2 and Linjie Zhao 2 1
2
State Key Laboratory of Power Transmission Equipment & System Security and New Technology, College of Electrical Engineering, Chongqing University, Chongqing 400030, China; E-Mails:
[email protected] (Z.H.);
[email protected] (Y.W.) HVDC Technology Research Department, Electric Power Research Institute, China Southern Power Grid, Guangzhou 510623, China; E-Mails:
[email protected] (J.L.);
[email protected] (L.Z.)
* Author to whom correspondence should be addressed; E-Mail:
[email protected]; Tel.: +86-23-65106880; Fax: +86-23-65102442. Received: 18 November 2011; in revised form: 17 January 2012 / Accepted: 17 January 2012 / Published: 23 January 2012
Abstract: Converter transformers are the key and the most important components in high voltage direct current (HVDC) power transmission systems. Statistics show that the failure rate of HVDC converter transformers is approximately twice of that of transformers in AC power systems. This paper presents an approach integrated with a two-dimensional cloud model and an entropy-based weight model to evaluate the condition of HVDC converter transformers. The integrated approach can describe the complexity of HVDC converter transformers and achieve an effective assessment of their condition. Data from electrical testing, DGA, oil testing, and visual inspection were chosen to form the double-level assessment index system. Analysis results show that the integrated approach is capable of providing a relevant and effective assessment which in turn, provides valuable information for the maintenance of HVDC converter transformers. Keywords: HVDC converter transformer; condition assessment; cloud model; entropy weight
Energies 2012, 5
158
1. Introduction In China commercial high voltage direct current (HVDC) power transmission systems have grown up to become ultra-high voltage (UHV) levels since some two years ago. HVDC converter transformers are the key and most expensive components of the HVDC power transmission systems. The reliable and efficient fault-free operation of HVDC converter transformers plays a decisive role in the availability of HVDC transmission systems [1]. Statistics show that the failure rate of HVDC converter transformers is approximately twice that of AC transformers [1,2]. Their valve windings endure AC, DC, and repetitive impulse combined voltages caused by inverters for an extended period of time [3]. Thus, it is necessary to assess accurately the operation condition of converter transformers. The evaluation results can provide the basis for improving the maintenance strategy and minimizing the risk of premature failures, whereby transformers can achieve the maximum practicable working efficiency and optimum life. In recent years, fault diagnosis and condition assessment of electric power systems and equipment have attracted the attention of researchers and engineers [4–7]. Generally, the decision with regard to the operation condition of transformers depends largely on specific parameters, such as electrical or mechanical aspects. The conditions of the transformers are analyzed through observation of the status of a single factor or a few parameters. Dissolved gas analysis (DGA) [5,6] and partial discharge (PD) pattern recognition [6–8] have been adopted for fault diagnosis and condition assessment of transformer insulation. The neural network [5], decision-making model [7], bagging algorithm [8], and fuzzy-logic methods [6,9] have all been applied to analyze the condition of transformers. However, the operation conditions of the power transformers are often in-between the normal and the fault conditions. This limits the capability of these techniques to represent the true operation conditions of the power transformer [7,9,10]. At present, the standards and judgment criteria for conventional AC power transformers are still used for condition monitoring and for fault diagnosis of HVDC converter transformers. However, there is no intensive research on the particularities of HVDC converter transformers, which could lead to a misjudgment of the fault diagnosis of HVDC converter transformers. Therefore, it is necessary to evaluate the condition states of HVDC converter transformers based on comprehensive parameters. The present paper presents an integrated approach for assessing the operation conditions of HVDC converter transformers. The data derived from electrical testing, DGA, oil testing, and visual inspection were chosen to produce a double-level assessment index system. The two-dimensional cloud model (TDCM) is adopted to establish the comprehensive assessment model. The entropy method is utilized to calculate the weights of factors and indices. The analysis of the final example shows that the integrated approach is capable of providing a significant and effective assessment. These conclusions provide valuable information for maintenance planning and execution. 2. Integrated Assessing Approach 2.1. Framework for HVDC Converter Transformer Condition Assessment HVDC converter transformers and AC transformers work under different operation conditions, thus their state evaluation index systems are different. Based on research on fault characteristics, aging
Energies 2012, 5
159
mechanisms of transformers, and preventive tests, the proper condition assessment of the HVDC converter transformers is constructed. During the assessment, the importance of analyzing the preventive test data is highlighted. Due to the numerous condition information types, classified models are utilized in the transformer operation condition assessment [11–17]. Figures 1 and 2 show the double-level assessment index system of Levels 1 and 2, respectively. Figure 1. Level 1 assessment index system.
The data from the preventive and diagnostic tests constitute the double-level assessment index system. The data from the preventive tests, which include those obtained from electrical testing, DGA, and oil testing, are employed to form the Level 1 assessment system. The data from the diagnostic tests, visual inspection, operating years, and environments are utilized to derive the Level 2 assessment system [18]. The condition of the HVDC converter transformer is assessed at Level 1. If the results are uncertain, Level 2 assessment becomes necessary. To define the assessment grades related to maintenance purposes, the following set of distinct assessment grades of framework P is defined as:
H = { H1 , H 2 , H 3 , H 4 } = {good, normal, bad, worse}
(1)
The following set of distinct assessment grades of framework C is defined as: W = {W1 ,W2 ,W3 ,W4 } = {normal, prior, sooner, immediate}
(2)
Energies 2012, 5
160 Figure 2. Level 2 assessing index system.
The assessment index system is a triple-layered structure, which is also called a decision-making tree model. Figure 2 illustrates the root or the objective layer where the outcome of the condition assessment based on the preventive tests is shown. The branch, known as factor layer, has three assessment factors, which describe the transformer condition from different aspects. This is expressed as P = {P1, P2, P3}. The factors are subdivided into indices. For instance, P2 = {P21, P22, P23, P24, P25} represents the five indices selected in this paper, which are included in the DGA. 2.2. Weight of Factors and Indices The weights of factors and indices are determined using the analytic hierarchy process (AHP) method, Delphi method, etc. In the present paper, subjective and objective integrated approaches are used to determine the weights [11,18]. Tables 1 and 2 show the subjective weights of the factors and indices, respectively. The information from the evaluation index is a determined factor of accuracy and reliability. Thus, the entropy is a good scale for measuring the changes as well as for deriving the useful data. Table 1. The weights of factors. Factors Weights
P1 0.3034
P2 0.3760
P3 0.3206
C1 0.3475
C2 0.3148
C3 0.1348
C4 0.1172
C5 0.0858
Energies 2012, 5
161 Table 2. The weights of indices. Factors P1 P2 P3 C1 C2
Corresponding Index Weights 0.20; 0.13; 0.27; 0.20; 0.20 0.27; 0.13; 0.20; 0.20; 0.20 0.18; 0.18; 0.18; 0.18; 0.12; 0.18 0.15; 0.10; 0.15; 0.15; 0.15; 0.15; 0.15 0.17; 0.17; 0.17; 0.17; 0.17; 0.17
Entropy εi, which represents the relative importance of sub-index, is obtained by the formula:
ε i = −(
Δi
) ⋅ ln(
n
∑Δ i =1
i
Δi
∑Δ i =1
(i = 1, 2," , n)
)
n
i
(3)
where Δi is the index that represents the value of variation. The initial static weight ωi is modified after εi is calculated. According to [18], index weight ωi is modified in two ways. First, by allowing ωi to fulfill the requirements of the punishing formula, and second, by making it satisfy the requirements of the award formula. For condition assessment of HVDC converter transformer, the penalty formula is adopted to modify the index weights. The corresponding formula is as follows:
μi =
ε iωi n
∑ε ω i =1
i
i
(4)
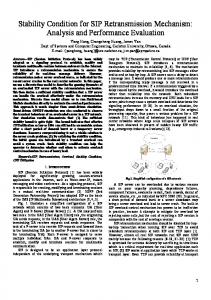
where n is the number of indicators. 2.3. Two-Dimensional Cloud Model (TDCM) The condition assessment process of HVDC converter transformers includes randomness, fuzziness, and uncertainties. In the artificial intelligence field, research on uncertainty of knowledge and deduction are mainly divided into randomness and fuzziness. As a foundation of fuzzy set theory, the concept of membership functions describes fuzziness. However, it is not sufficient to represent the uncertainty and imprecision in real world settings. To enhance effectiveness, the fuzzy set theory needs an infusion of concepts and techniques drawn from probability theory, which is the new concept of membership clouds [19]. The introduction of randomness adheres to a partial grade of membership because a linguistic term leads to good integration with the model of linguistic atoms. Fuzziness and randomness are complementary and inseparable. TDCM, which is based on the combination of qualitative and quantitative analyses from the field of knowledge discovery, unifies randomness and fuzziness [19]. TDCM provides more systematic and advanced tools for expressing uncertainties. Therefore, TDCM is appropriate in the analysis of the operation condition of the HVDC converter transformers. TDCM represents a qualitative concept with three digital characteristics, expected value Ex, entropy En and hyper entropy He [19]. Figure 3 illustrates the image of “about 20” TDCM.
Energies 2012, 5
162 Figure 3. Image of “about 20” TDCM. 1 0.9 0.8 0.7 0.6 0.5 0.4 0.3 0.2 0.1 0
12
14
16
18
20
22
24
26
28
2.4. Overall Assessment Based on TDCM The process of transformer condition assessment is generally ambiguous and uncertain. Thus, the TDCM approach is employed to solve this problem. The dimensions and magnitude are different for different indices. This situation requires normalization of the testing data of indices before they are assessed. The smaller the values of indices, such as the total hydrocarbon content, the better the normalization will be as derived by: xri = ( X attention − X ) ( X attention − X rm )
(5)
The larger the values of indices are (e.g., breakdown voltage of insulating oils), the better will be the process of normalization, which is described by: xri = ( X ri − X attention ) ( X rm − X attention )
(6)
where xri is the normalized value of index eri (i = 1,2,…,n). Its values will be in the interval [0, 1], and n is the number of indices, Xrm is the normalized value of an index, Xattention is the attention value, which is decided by transformer tests and operation standards. Xri is the field testing data. When the indicator threshold is at the warning value, it should be converted to the attention value according to the following formula [11]:
X attention = X warning 1.3 X attention = X warning ×1.3
( When ( When
X rm ≤ X warning ) X rm ≥ X warning )
(7)
where Xwarning is the warning value which is decided by the transformer testing results and operation standards. In fuzzy-logic mathematics, Zadeh [20] used the degrees of membership to describe the transient states between differences. The fuzzy membership function is the most basic concept in describing the fuzzy object. Therefore, the merits of the evaluation system are determined directly by the quality of the membership function constructions. In addition, the membership function is equally important in TDCM. Therefore, to ensure accurate description of the condition information, the TDCM membership
Energies 2012, 5
163
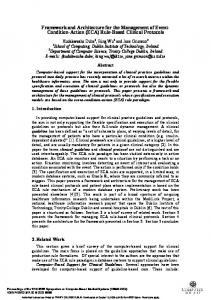
functions of indices are applied to describe the intervals between neighboring grades. The TDCM membership degrees in Formula (8) can be described as in Figure 4. ⎧ ⎪ y1 ( xri ) = ⎪ ⎪ y2 ( xri ) = ⎪ ⎪ ⎨ ⎪ y3 ( xri ) = ⎪ ⎪ ⎪ ⎪ y4 ( xri ) = ⎩
⎧ 1 ⎨ ⎩upcloud cloud
0.9 ≤ xri ≤ 1.0 0.7 ≤ xri ≤ 0.9 0.5 ≤ xri ≤ 0.9
⎧downcloud 0.5 ≤ xri ≤ 0.7 ⎪ 1 0.4 ≤ xri ≤ 0.5 ⎨ ⎪ upcloud 0.2 ≤ xri ≤ 0.4 ⎩
(8)
⎧downcloud 0.2 ≤ xri ≤ 0.4 ⎨ 0 ≤ xri ≤ 0.2 1 ⎩
where the cloud, upcloud and downcloud represents the full bell shape, half-up and half-down cloud membership, respectively. Figure 4. Sketch of TDCM membership degree functions. Y4(xri)
1
Y3(xri)
Y2(xri)
Y1(xri)
0.9 0.8 0.7 0.6 0.5 0.4 0.3 0.2 0.1 0
0
0.1
0.2
0.3
0.4
0.5
0.6
0.7
0.8
0.9
1
TDCM factor layer assessment is expressed as: n
M r = ∑ μ riYr
(9)
i =1
where: ⎛ y1 ( xr1 ) ⎜ ⎜ y (x ) Yr = ⎜ 1 r 2 # ⎜ ⎜ y (x ) ⎝ 1 rn
y 2 ( xr1 )
y3 ( x r1 )
y 2 ( xr 2 )
y3 ( x r 2 )
# y 2 ( xrn )
# y3 ( xrn )
y 4 ( x r1 ) ⎞ ⎟ y 4 ( xr 2 ) ⎟ # ⎟ ⎟ y 4 ( xrn ) ⎟⎠
(10)
and where Mr is the assessment result of the rth factor based on the TDCM method. Yr represents the index membership degrees of the rth factor, which can be seen in Figure 4. μri represents the weight of index eri which belongs to the rth factor.
Energies 2012, 5
164
The overall TDCM assessment is constructed as: m
M = ∑ ωr M r
(11)
r =1
where M is the overall assessment result based on the TDCM method, and ωr represents the weight of the rth factor. The overall TDCM assessment approach is implemented in Matlab. 3. Experimental Results
The present study employed the preventive test data from a 500 kV HVDC converter transformer pole II Y/Δ connection 022B transformer belonging to the Southern Power Grid Company in China. The data, which are derived from operations in 2008 and 2010, are shown in Tables 3 and 4. Table 3. Test data of the chromatogram (DGA Unit × 10−6). Test Dates 20100120 20091102 20091020
CH4 17.3 14.0 15.4
C2H6 0.5 4.3 3.7
C2H4 14.0 13.1 16.0
C2H2 2.4 2.5 2.3
H2 7.1 2.1 6.0
CO 300 183 215
Table 4. Preventive test results. Tested Items Resistance of winding (GΩ) Core insulation resistance (GΩ) Bushing capacitance (pF) Bushing dielectric loss Bushing insulation resistance (GΩ)
Testing Dates (Year) 2008 2010 130.69 132.07 6.16 1044.9 1054 0.460 0.577 154
Change/% 1.06 0.87 25.43
Using the TDCM approach, the membership degrees of indices are calculated by the given membership functions in (7). The results are shown in Table 5. Table 5. Membership degrees to assessing grades. Factors P1 P2
Membership Value for Indices 0.3110; 1.0; 0.8260; 0.0383; 1.0 0; 0.9527; 0.7720; 0.9997; 0.9660
Table 6 shows the overall weight distributions of P1 and P2. The distributions are modified by entropy weight according to Formulas (3) and (4). Inasmuch as data about core insulation resistance and bushing insulation resistance in 2008 is missing, the comprehensive weights of these two indices were replaced by subjective weights. The assessment process and general fuzzy comprehensive assessment changed due to the introduction of TDCM. The membership value rij calculated by TDCM is an uncertain value. Therefore, to enhance the credibility of the assessment, the fuzzy comprehensive assessment value Ci (i = 1,2,…,N) are
Energies 2012, 5
165
calculated repeatedly for N times under different conditions of membership. Finally, the average value is obtained by the formula: n
Cfinal = ∑ Ci N
(12)
i =1
in the current paper, the value of N is 1000. Table 6. Comprehensive weights of factors and indices. Factors P1 P2
ωr 0.4466 0.5534
Corresponding Index Weights μri 0.2088; 0.2000; 0.2498; 0.1414; 0.2000 0.0594; 0.2266; 0.0128; 0.3505; 0.3507
Subsequently, the basic state value is calculated by Formula (9). Table 7 shows the results. Table 7. Basic probability assignments. Mr
Factors
H1 0.5345 0.9299
P1 P2
H2 0 0
H3 0.0855 0
H4 0.1938 0.0594
Thus, the values of P1 and P2 are obtained by the combination algorithm (11). Table 8 presents the results of the condition assessment of the HVDC converter transformer. Table 8. Results of condition assessment. M H1 0.7533
H2 0
H3 0.0382
H4 0.1194
Assessing Results H1
The overall state is confirmed to be grade H1, which reaches a very high value of 0.7533. The transformer condition is good and maintenance strategy is normal. However, the bushings of the transformer required immediate checking. The factual situation proves that the transformer operation is stable. After the examination, the junction box of bushing Tap 3.11 (No. M2141171) was found to be full of water. This can lead to serious internal corrosion of this bushing, necessitating replacement. This result coincides with the TDCM analysis presented in this paper. 4. Conclusions
This paper presents an integrated approach to the assessment of the condition of HVDC converter transformers based on TDCM and the entropy weights method. The results of the reported work and analysis may be summarized as follows: (1) The assessment index system, which includes the DGA, electrical testing, and oil testing data, is established to facilitate the approach.
Energies 2012, 5
166
(2) An integrated approach based on TDCM and the entropy weights method was established to assess the condition of HVDC converter transformers. (3) The integrated approach can serve as an effective tool for the assessment of the condition of HVDC converter transformers, and the final evaluation provides valuable information for the provision of maintenance schemes. (4) Moreover, factors, such as the previous working history of the HVDC converter transformers and working states of the on-load tap-changer (OLTC), can be incorporated as parameters to assess the working states of HVDC converter transformers. Acknowledgments
The authors acknowledge the High Tech Research and Development Program of China (863 Program, No. 2009AA04Z416) and the National Science Foundation of China (51021005) to support this work. The 111 Project of the Ministry of Education, China (B08036), the Natural Science Foundation of Chongqing, China (CSTC 2009BA4048) and the Project of China Southern Power Grid (SEPRI-ZL-K201015) are also appreciated for supporting this work. References
CIGRE WG 14.32. HVDC Converter Stations for Voltages Above ±600 kV. ELECTRA 2002, 205, 51. Available online: http://www.e-cigre.org/Order/download.asp?ID=ELT_205_5.pdf (accessed on 21 January 2012). 2. Astrom, U.; Weimers, L.; Lescale, V.; Asplund, G. Power Transmission with HVDC at Voltages above 600 kV. In Proceedings of the Urban 2005 IEEE/PES Transmission and Distribution Conference & Exhibition: Asia and Pacific, Dalian, China, 14–18 August 2005. 3. Gao, M.; Leng, Y. Two direct components in converter transformer. Transformer 2002, 39, 15–18. 4. Tatietse, T.T.; Voufo, J. Fault Diagnosis on Medium Voltage (MV) electric power distribution networks: The case of the downstream network of the AES-SONEL Ngousso sub-station. Energies 2009, 2, 243–257. 5. Wu, H.; Li, X.; Wu, D. RMP neural network based dissolved gas analyzer for fault diagnostic of oil-filled electrical equipment. IEEE Trans. Dielectr. Electr. Insul. 2011, 18, 495–498. 6. James, R.E.; Su, Q. Condition Assessment of High Voltage Insulation in Power System Equipment; Athenaeum Press Ltd.: Gateshead, UK, 2008. 7. Liao, R.; Yang, L.; Li, J.; Grzybowski, S. Aging condition assessment of transformer oil-paper insulation model based on partial discharge analysis. IEEE Trans. Dielectr. Electr. Insul. 2011, 18, 303–311. 8. Jiang, T.; Li, J.; Zheng, Y.; Sun, C. Improved bagging algorithm for pattern recognition in UHF signals of partial discharges. Energies 2011, 4, 1087–1101. 9. Chen, A.P.; Lin, C.C. Fuzzy approaches for fault diagnosis of transformers. Fuzzy Sets Syst. 2001, 118, 139–151. 10. Singh, J.; Sood, Y.R.; Jarial, R.K.; Verma, P. Condition monitoring of power transformers— Bibliography survey. IEEE Elect. Insul. Mag. 2008, 24, 11–25. 1.
Energies 2012, 5
167
11. Liao, R.; Zheng, H.; Grzybowski, S.; Yang, L.; Zhang, Y.; Liao, Y. An integrated decision-making model for condition assessment of power transformers using fuzzy approach and evidential reasoning. IEEE Trans. Power Deliv. 2011, 26, 1111–1118. 12. Muthanna, K.T.; Sarkar, A.; Das, K.; Waldner, K. Transformer insulation life assessment. IEEE Trans. Power Deliv. 2006, 21, 150–156. 13. Wang, M.; Vandermaar, A.J.; Srivastava, K.D. Review of condition assessment of power transformers in service. IEEE Elect. Insul. Mag. 2002, 18, 12–25. 14. IEEE Guide for Acceptance and Maintenance of Insulating Oil in Equipment; IEEE Std. C57.106–2006; IEEE: New York, NY, USA, 2007. 15. IEEE Guide for the Interpretation of Gases Generated in Oil-Immersed Transformers; IEEE Std. C57.104–2008; IEEE: New York, NY, USA, 2009. 16. IEEE Guide for the Evaluation and Reconditioning of Liquid Immersed Power Transformers; IEEE Std. C57.140–2006; IEEE: New York, NY, USA, 2007. 17. Regulations of Condition-Based Maintenance & Test for Electric Equipment; China State Grid Corporation standard, Q/GDW 168–2008, China Electric Power Press: Beijing, China, 2008. 18. Liao, Y.X. Study on the Comprehensive Assessment Model of Transformer Operation Condition. Master Thesis, Chongqing University, Chongqing, China, 2006. 19. Li, D.Y.; Yi, D. Artificial Intelligence with Uncertainty; National Defense Industry Press: Beijing, China, 2005. 20. Zadeh, I.A. Fuzzy sets. Inform. Control 1965, 8, 338–353. © 2012 by the authors; licensee MDPI, Basel, Switzerland. This article is an open access article distributed under the terms and conditions of the Creative Commons Attribution license (http://creativecommons.org/licenses/by/3.0/).