1
CONTINGENCY TABLE: A TWO-WAY BRIDGE BETWEEN QUALITATIVE AND QUANTITATIVE METHODS*
DR. ERCILIA GARCÍA-ÁLVAREZ IM2, Research Group Apartado 434 08200, Sabadell (Barcelona) SPAIN Phone: +34 93 7267675
[email protected]
DR. JORDI LÓPEZ-SINTAS Universidad Autónoma de Barcelona Departamento de Economía de la Empresa Facultad de Económicas y Empresariales, edificio B. 08193 Bellaterra (Barcelona) SPAIN Tel: +34 93 5811209 Fax: +34 93 5812555
[email protected]
En Revisión en Field Methods ABSTRACT Combining qualitative and quantitative research methods in the same project allowed us to gain more in-depth knowledge as well to achieve sharper data reduction and verification than would have been possible using only one approach. Qualitative data were obtained from in-depth interviews with 13 founders of leading family businesses and published secondary data. We used qualitative computer software to codify founders’ values from the full transcriptions of their interviews. The obtained contingency table was the bridge to visually explore the relationship between codes (values) and primary documents (family firm’s founders) with the aid of Multidimensional Scaling Technique. We then used a hierarchical agglomeration algorithm to form a taxonomy of founders. Finally we returned to qualitative analysis and studied the association between founders’ values and family background for external validation of the taxonomy.
*
The authors would like to express their appreciation to Karen A. Jehn for sending them her papers and for the insightful comments made by the four anonymous reviewers as well as the editor.
2 Introduction The literature in management recognizes the relevant role that values play in family business (Dyer, 1986; Ward 1987). Recent works focus on identifying values that are common to family businesses (Corbetta, 1999) and make an attempt to understand how they differ from non family businesses (Ward, 1999) and to identify values that can contribute to success (Cappuyns, Gallo, & Vilaseca, 1998). As far as we know, however, there is no classification that analyzes the founder's values and considers the family business context specifically. Rather, family business founders are generally grouped together in a sample (Donckels & Fröhlich, 1991) and characteristics that are considered to be held by family business founders of the same type are compiled as a whole (La Fuente, Salas, & Pérez, 1985). Previous literature shows us that although values are present both in entrepreneurship and family business fields, there are several gaps. On the entrepreneurship side, entrepreneurs' typologies are not commonly based on values. Moreover, these typologies do not take into account the role that the family might play in the family business, which could introduce bias into the relationship between the founder type and the firm type. That is, they exclude the family business context or group in the same cluster. Despite the relevant role that authors recognize in founders’ values in future family-firm evolution, in the family business arena, there are no empirical studies of the value systems of founders and their possible heterogeneity. Here we present our analytical procedure in a qualitative research design that uses Atlas.ti as project container (Muhr, 1997). The contingency table is a two-way bridge that allowed us to integrate quantitative exploratory techniques in the qualitative analysis in order to gain more in-depth knowledge and sharp data reduction. The process described here is highly iterative and tightly linked to data.
3 1) Getting Started Before embarking on fieldwork, we carried out a literature review to focus our research problem and to develop a theoretical framework that would guide our research design and subsequent analysis. We identified different constructs for each of the four main components of our conceptual framework −founder (15 constructs), family (20), firm (23) and environment (4)− and used these constructs initially as a guideline to protocol development and later to help us in our codification process. Our goals focused on the following: • Determining the founder’s value system • Finding out if founders in family business could be differentiated according to their value systems. • Identifying any relationship between founders’ values, as well as any differences in these values and the founders’ personal background. 2) Selecting Cases We focused our research on founders of family businesses who are approaching retirement age (65 years) and currently work with the potential successors of their firms, namely, founders with extensive business experience in sound firms on the verge of transfer from one generation to another. We chose this group for two reasons: 1) the majority of family businesses in Spain are between the first and second generation and have not experienced the process of succession (Gallo & Pont, 1989), one of the most critical issues in family business survival; and 2) the study of founders and their family businesses at this stage allow us to link entrepreneurship to the family business field by analysing the initial business concept and motivations of each founder when setting up a business having the unique characteristics of their organisations
4 One methodological problem involved in studying family business is to build a sample by identifying firms that are owned and managed by one or several families criteria that are not always easy to identify. We used several steps in building our sample: 1) We identified first-generation family businesses and their founders from "Las primeras 500 empresas de Galicia" (Gómez and Martínez, 1992), and 2) we verified that these firms were still family-run in 1996 by checking several business directories. We obtained a final list of 28 founders who owned firms of varying sizes that had all the required characteristics, which was our theoretical sampling (Glasser & Strauss, 1967). We sent these founders a personal letter and later phoned them to make an appointment for an interview. In some cases, this proved to be exceedingly difficult as most had not agreed to be interviewed before, and we found it necessary to persist (more than 20 phone calls) in order to convince them. In the end, 13 founders agreed to participate in our research once confidentiality had been guaranteed.
3) The interviews Our main concern was to obtain the founders’ own point of view. Hence, we used an in-depth semi-structured interview as the main tool of obtaining information during the fieldwork. Thus, in order to develop a final interview protocol that ensured we could cover the main themes from our conceptual framework in all cases, we developed a matrix that linked each question to the main information we expected to obtain from the answers and to the constructs from our conceptual framework. This is a two dimensional matrix which rows are the information we expected to obtain (themes) and the columns are the protocol’s questions. Each cell contains the initial codes derived from our theoretical framework. This helped us to develop an interview protocol that covered all relevant pieces of our previous theoretical framework and proved
5 worthwhile not only to quickly test the quality of information obtained after each question but also to facilitate the coding process. In developing our interview protocol we took care with the language and terms. The idea was to formulate questions with everyday language by avoiding “business jargon” with a two-fold objective: to eliminate bias due to the interviewer introducing terms and to identify differences between cases about the language and terms they used. This was very fruitful, as it helped the interview process by making founders feel more confident and comfortable. We took care in the sequencing of questions. We began with a description and then with questions about experience, behaviour, opinions and values. We included several questions to verify information looking for contradictions (Patton, 1990:chapter 7). In order to avoid the possible resistance of founders to discuss sensitive topics such as their succession (which commonly implies thinking about their own death), we used a question that caused the interviewee to assume the possibility of his own death. How do you see this firm in …years? We adapted the number of years according to founder’s age so that he clearly had no chance to be a future participant. All founders answered the question without difficulty and began to talk openly about the possible consequences of their own death for both their family and their firm. As a result, we obtained the information we were interested in without pressing the interviewee and while still keeping the interview relaxed and pleasant for the founder. All interviews were conducted by the first author and took place in the founder’s office, lasting from two to six hours. Each interview was also tape-recorded. Both authors handled the full transcription and the analysis of the 13 interviews to ensure thorough knowledge of the process.
4) Computer-aided qualitative software
6 We chose Atlas.ti, win 4.2 (Build 057) due to its flexibility (Muhr, 1997). This software allowed us to maintain permanent contact with our data throughout the data analysis process and to extend our analysis to summaries and memorandum, instead of only codes. Finally, Atlas.ti assists in the interactive work with SPSS, a feature of interest when combining qualitative and quantitative techniques in data analysis. 5) Analysis In all 13 cases we pursued a multivariable analysis in three main steps: 1) We initially carried out an in-depth, case-by-case analysis by coding for themes until obtaining the final codebook, as a result we obtained a founders-by-values matrix. 2) We then used quantitative techniques of matrix analysis to look for and display graphically patterns in the coded data. 3) Finally, we developed a qualitative back-up of our cross-case patterns. The complete procedure is summarised in Figure 1. We further explain each of these steps in the following sections. Other authors have already combined qualitative and quantitative techniques although with different research designs; see for instance Monge and Eisenberg (1987), Rice and Danowski (1993), Stohl (1993), Jang and Barnett (1995), Jehn and Doucet (1996, 1997), and Doerfel and Barnett(1999). [FIGURE1 ABOUT HERE] Within-Case Data: codebook development After the full transcripts of the interviews, we built a hermeneutic unit, as a whole container of the project and 13 primary documents that deals with each case studied as the software requires (Atlas.ti).We then segmented these primary documents into relevant pieces of text of varying lengths (quotations) and began the descriptive coding. As a starting coding frame we applied a previous code list obtained from our interview matrix and the literature review that we completed later by two coding
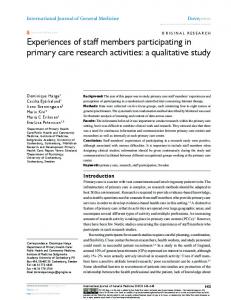
7 possibilities of the software: open coding (you assign a new code to a segment of text) and in-vivo coding (you use a word from the text as a new code)1. Then, we began descriptive code reduction by merging codes and reviewing code grouping and code meaning. We revised codes in order to reach an agreement between both authors in the process of assigning codes to text as well as developing the final codebook. During the entire process of analysis we wrote different types of memos to capture longer elaboration of ideas and concepts that emerged during the in-depth data analysis stage. The building of concepts opened the conceptual coding process by applying conceptual codes from our data analysis. After several revisions of the accuracy of our conceptual codes we obtained our final codebook. Then, we grouped all our codes in families to help us in the reduction process. These families were labelled according to three criteria: the main components of our conceptual framework (founder, family, firm, and values); relevant information from our protocol matrix (successor’s socialization, potential successors); and aspects that emerged during analysis (development of skills and acquisition of resources; founder’s resource origin). We found very useful to build a graphical display, network that compile the major codes that we obtained during our analysis. The purpose of this graphical display was only to organize the codes obtained during the process of analysis (see FIGURE 2 for an example of the graphical display concerning the founder, his values and social background). [FIGURE 2 ABOUT HERE] Quantitative techniques to search for cross-case patterns Once we had obtained the final codebook, we focused our attention on analysing founder’s values. In order to do so, we filtered the code family values for the 13 cases and obtained a code frequency table of 45 values for each case. This frequency
1
See Russell Bernad and Ryen (1998: section classical content analysis).
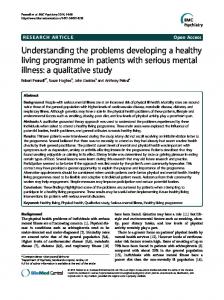
8 represents the number of times each value was mentioned by each founder. Table 1 shows the contingency table obtained from Atlas.ti. [TABLE 1 ABOUT HERE] We then moved our codes-primary document contingency table (the frequency matrix of founder's values) generated by Atlas.ti to SPSS to visually explore the relationship between codes (values) and primary documents (family firm’s founders), with the aid of a non-metric Multidimensional Scaling Technique (Kruskal and Wish, 1978). To do this, we produced a derived dissimilarity chi-squared distance (Dillon and Goldstein, 1984: 124). The chi-squared distance is similar to the Euclidean distance, with the distinction that each squared difference between profiles is weighted by the corresponding element of the average founder profile (Greenacre, 1993: 24-31). Afterwards, we used Ward’s hierarchical agglomeration algorithm (Dillon and Goldstein, 1984: 172-178) to create a founders' taxonomy. Although this technique was developed to analyze much larger data sets, it may be usefull in exploring the structure embedded in a few cases. Finally we returned to Atlas.ti and analyzed the association between founder’s values and their family backgrounds as a qualitative external validation. The non-metric multidimensional solution (Kruskal and Wish, 1978) obtained by using SPSS’ Alscal procedure gives an S-stress value of 0.265 for two dimensions (Young’s S-stress formula 1), using a derived dissimilarity measure. Although the MDS’ two axes values’ solution does not produce a good recovery of the original order in the data, further dimensions do not impressively reduce the index of misfit between both data orders, but increases the complexity. FIGURE 3 plots the values’ position in the two-dimensional derived Euclidean space. For ease of interpretation, values have
9 been labelled with a number, with the meaning of each value number listed below the figure. The first dimension is associated to the values of business orientation, entrepreneurship, ambition, growth and sacrifice in the negative direction; and negative human relations, family orientation, cosmopolitan orientation, task orientation, sense of guilt, economic interest and innovation, on the positive side. This first axis appears to reflect how founders see their firm: business as an end (left orientation) and business as a means for the family. In our sample, if founders are located on the “business as an end” orientation, the firm has a predominant role over the family. On the contrary, in the case of those located on “business as a means” axis orientations, the aims of the firm are constrained by the family. [FIGURE 3 ABOUT HERE] The second axis is associated with risk aversion, constancy, sense of family, stability and satisfaction, on the negative direction; and with determination, sense of achievement, positive failure perception, people orientation, ambition, internal control, seriousness and hard work, on the positive direction. It could be labelled group orientation (southern direction) and self-fulfilment orientation (northern direction). If founders are located on the group orientation values, their actions are constrained by the desire to be accepted by the group and family interests play an important role in their business decisions. On the other hand, those located on the self-fulfilment values axis orientation look for personal realization, and their family probably plays a minor role in their business decisions. These inferences are conditioned to our data. In order to check methodological convergence (triangulation), we performed another, more demanding analysis known as correspondence analysis (Greenacre, 1993) which looks for an exact representation of the distances between values and founder
10 profiles. There is a clear coincidence in the first and second solutions, although some discrepancy appears as well. The first two axes in correspondence analysis only account for 35.76% of the association between the group of founders and the group of values whereas non-metric MDS explains far more of the original order implied in the derived chi-squared distances. The relationship between the two procedures lends internal validity to our findings. [FIGURE 4 ABOUT HERE]
When looking at the founders’ position in the two-dimensional Euclidean space of values (S-Stress was 0.195 for two axes, and 0.091 for three), we found that founders are as far from the origin as their profile is from the founders’ average profile (see FIGURE 4). The first axis separates founders who view business as an end (5, 13, 10, 8, 11, 7, and 3) from those who view business as a means to their family life (2,1, 12, 6, 9, and 4). The second axis splits the sample between founders who seek selffulfilment values (cases 1, 2, 5, 12, 13, and 10) and those who seek social acceptance, group orientation values, (cases 6, 8, 11, 9, 4, 3, and 7).
A taxonomy of founders We could cluster founders according to their position in one of the four quadrants. However, the use of a clustering algorithm could result in more homogeneous clusters, depending on their value profiles (see Kurskal and Wish [1978]). We used Wards’ agglomerative hierarchical procedure (Dillon and Goldstein, 1984) with the original dissimilarities, derived chi-squared distances, instead of the Euclidean distances between founders in the two-dimensional non-metric MDS solution. In this way, we totally preserved the original distances between founders values’ profiles. The
11 clustering process suggests the formation of four groups of family firms' founders (See FIGURE 5). [FIGURE 5 ABOUT HERE] In order to label each group of founders we considered not only the aforesaid values but also the specific characteristics of each cluster of founders. To search for these peculiarities we went back to atlas.ti and performed a cross-case analysis of each group taking into account the rest of codes from our codebook. We looked for intragroup similarities coupled with intergroup differences. We were working without labels for each group of founders until completing the cross-case analysis for all the codebook. Finally, we labelled them according their characteristics as: Founders of Family Tradition, FoundersStrategists, Founders-Achievers, and one Founder-Inventor. The main characteristics of these groups are summarised below. Founders of Family Tradition. Group values and the idea of the business as an end dominate the value system of these founders. This group has a high frequency in values such as positive perception of human relations, ethical orientation, and family sense. Founders-Achievers. This group views their firm(s) as a means to earn a family living and, as founders of family tradition, the group-values orientation prevails in their value system. They have a high frequency in values such as short-term orientation, vocation and task orientation. Founders-Strategists: Although this group sees the business as an end, like Founders of Family Tradition, self-fulfilment values predominate in their value system. They have a high frequency in values such as sense of achievement, internal control, and long-term orientation. Founder-Inventor. As in the case of Founder-Strategists, self-fulfilment values predominate in their value system, although they view their business as a means to
12 earning a family living. Values such as innovation, family orientation, and a negative perception of human relations prevail. Qualitative external validation of our quantitative cross-case patterns Once we had obtained the various groups of founders according to their values, we focused on the relationship between each set of founders and their background (family background code) as a way to identify their distinctive characteristics that configure our taxonomy.
We present textual evidences from networks, selected
quotations (verbatim quotes) from Atlas.ti that point out similarities and differences among cases for each variable as a qualitative back-up of our quantitative patterns. Family business background. This code meant that founders have family ancestors with business experience. Most founders who saw their firms as an end (family tradition and strategist) mentioned relatives that were entrepreneurs; however, those who saw their firms as a means (achievers and inventor) had no previous family business experience. The existence of a previous family business background had a different meaning for the founder of family tradition and for the strategist. The former viewed his business activity as something natural that had been part of his life since childhood.
“(...) he had a small shop in the house and that’s where I was born, in this house and this shop. In those years, I had no other option and I gradually began to like the profession. It’s a vicious circle, the more you like something, the more you learn and the more you learn, the more you like it” 3:3 (15:23)
In the case of the strategist type, this prior family business background also represents a challenge to reach more ambitious goals. If we study the presence of a family business activity background, namely, the existence of founders' ancestors who worked in the same activity that has been the
13 origin of founders' firm, once again, this characteristic differentiates between founders of family tradition and strategists. Founders of family tradition saw their firms as a way to continue pursuing the activity of their families and strategists as a way to achieve self-fulfilment or take up an opportunity as their own. “(...) is a continuation of my father’s profession” 3:2 (14:15)
“(...) the only thing I did was to expand the business, not only in terms of size but also in terms of geographic scope” 8:2 (20:23)
Achievers and the inventor without any family background set up their business from scratch. In these cases we identified a prevalence of negative factors in their startups that related mainly to the impossibility of finding a job that fit their knowledge and skills. “(...) I encountered a lot of difficulty in finding work because what I know how to do isn’t done here (...)” 1:130 (116:118)
“(...) since there were no employment possibilities around here, I set up business, it wasn’t much of a business at the start, I did everything... I fixed cars, boats, anything I could and gradually I got more involved until I began to construct boats” 1:124 (33:36)
As we can see, the origin of the firm was completely different for each group of founders and clearly reflected their concept of the firm as an end or as a means. Achievers and the inventor set up their businesses as a way to earn a living for themselves and their families. However, in the case of founders of family tradition and strategists, this was not their priority because they had other chances.
14 In this vein, we can also identify differences among groups of founders in our sample according to their education, which ranged from a complete lack of formal studies to university degrees. Founders of family tradition and strategists had a higher level of formal education than achievers and the inventor. This can be linked to their family background, which provided them with business experience and financial resources to acquire an education. However, founders agree that their main source of business knowledge stems from their own experience.
“(...) when I was 16, I went to work in Orense and worked at the plant, in the shop of my brother-in-law. I took advantage of my free-time in the evenings to get some training (...) in business math, to prepare myself for business a little” 2:21 (198:203)
“I think from my reading. At the level of abstract ideas. In terms of the day-to-day, I think it was from my father, from my family in terms of living in a business environment, from other persons with whom you work throughout your life, as you rub shoulders with competitors, suppliers, customers. You have to learn from all these individuals, who apparently know more than you about some things. From living” 8:13 (165:173)
“From a business point-of-view, nothing. In terms of academic training, I had studied Fine Arts. I had learned a little about design work because I had worked in a French company. I had reached an agreement in which they supported me in the entire manufacturing process and business management with their name and their product, and that’s where I started. But in terms of business training, zero. Lots of will and desire to... believe in what I could develop and lots of desire to surround myself with people who would fill in what I was missing” 5:5 (77:92)
15 Although the founders mentioned that learning from experience has proven to be very important for the development of their businesses, this does not mean that they had previous business experience. Most founders in our sample had no previous business, rather they developed their business activity over the years based on their first start-up and did not learn from previous business failures as the literature points out. Finally, another aspect that literature considers important for a successful beginning and development of an entrepreneurial career is relying on the help and guidance of a mentor. However, only a few founders (four cases) in our sample mentioned them. 8) Conclusions From a qualitative approach this article shows one possible procedure to combine qualitative and quantitative instruments in order to obtain complementary findings that enhance research results. The use of qualitative data analysis software proved to be very useful, as it made data management and qualitative analysis easier and provided a quantitative path through the contingency table that served as a two-way bridge between qualitative and quantitative research methods. In our case, the creation of a taxonomy of founders as quantitative evidence helped to point out further relationships in our data that would have difficult to find using only qualitative techniques. The final qualitative external validation of our quantitative findings helped us to perform an in-depth cross-case analysis that revealed underlying relationships. The next methodological step is to confirm the validity of these results by testing them on an independent sample of data, whether quantitative or qualitative, and from different cultural contexts. REFERENCES
16 Bernard Russell, H. and Ryan, G. (1998). Qualitative and Quantitative Methods of Text Analysis. In H. Russell Bernard (Ed) Handbook of Methods in Cultural Anthropology. Walnuk Creek, CA. Altamira Press. Cappuyns, K., Gallo, M. A., and Vilaseca, A. (1998). Successful Family Business. 9th Family Business Network Conference, Paris. Corbetta, G. (1999) Los Valores de Empresa y Los Negocios Familiares. In Melé Carné, D. (Coord.) Consideraciones éticas sobre la iniciativa emprendedora y la empresa familiar (pp. 157-172). Pamplona: Ediciones Universidad de Navarra. Dillon, W. R. and M. Goldstein (1984). Multivariate Analysis—Methods and Applications. New York: John Wiley & Sons. Doerfel, M. L., and Barnett, G. A. (1999). A Semantic Network Analysis of the International Communication Association. Human Communication Research, 25, 589-603. Donckels, R. and Fröhlich, E. (1991). Are Family Businesses Really Different?. European Experiences from Stratos. Family Business Review, 4 (2), 149-170. Dyer, W G. (1986). Cultural Change in Family Firms. Anticipating and Managing Business and Family Transitions. San Francisco: Jossey Bass Publishers. Gallo, M. A. and C. García Pont, (1989). La empresa familiar en la economía española. Papeles de Economía Española, nº 39-40, 67-85. Glasser, B. G. and A. L. Strauss (1967). The Discovery of Grounded Theory. Strategies for Qualitative Research,. New York: Aldine de Gruyter. Gómez, J. L. and J. C. Martínez (1992). Las primeras 500 empresas de Galicia. La Coruña: Biblioteca Gallega. Greenacre, M., J. (1993). Correspondence Analysis in Practice. San Diego, CA: Academic Press.
17 Jang, H and Barnett, G. A. (1995) Cultural differences in organizational communication: A semantic network analysis. Bulletin de Methodolgie Sociologique, 44, 31-59. Jehn, K. A, and L. Doucet (1996) Developing Categories from Interview Data: Text Analysis and Multidimensional Scaling. Part 1.Cultural Anthropology Methods Journal, 9(1):15-16 Jehn, K.A, and L. Doucet (1997) Developing Categories for Interview Data: Consequences of Different Coding and Analysis Strategies in Understanding Text: Part 2. Cultural Anthropology Methods Journal 9(1): 1-7 Kruskal, J. B. and M. Wish (1978). Multidimensional Scaling, Sage University Paper series on Quantitative Application in the Social Sciences, 07-011. Beverly Hills and London: Sage Pubs. Lafuente, F. A, Salas F. V. and Pérez, S. R. (1985). Tipos de Empresario y de Empresa. El Caso de las Nuevas Empresas Españolas. Economía Industrial, NovemberDecember, 139-151. Monge, P. P., and Eisenberg, E. M. (1987). Emergent communication networks. In F. Jablin, L. Putnam, K. Roberts, & L. Porter, (Eds.), Handbook of organizational and management communication (pp. 204-242). Beverly Hills, CA: Sage. Muhr, T. (1997). ATLAS/ti, User's Manual and Reference, Version 4.1, Berlin: Scientific Software Development. Patton, M. Q. (1990) Qualitative Evaluation and Research Methods. London: Sage. Rice, R. E., and Danowski, J. A. (1993). Is it really just like a fancy answering machine? Comparing semantic networks of different types of voice mail users. Journal of Business Communication, 30, 369-397.
18 Stohl, C. (1993) European managers’ interpretation of participation: A semantic network analysis. Human Communication Research, 20, 97-117. Ward, J. L. (1987). Keeping the Family Business Healthy: How to plan for continuing growth, profitability, and family leadership. San Francisco: Jossey-Bass. Ward, J. L. (1999). Valores que sintetizan las empresas familiares. In Melé Carné, D. (Coord.) Consideraciones éticas sobre la iniciativa emprendedora y la empresa familiar, (pp. 149-155). Pamplona: Ediciones Universidad de Navarra.
19
FIGURE 1: Analytical Procedure 1- Full transcripts of interviews 2- Adaptation of transcripts to work with Atlas.ti 3- Creation of textual quotations 4- Revision
ATLAS.ti
5- Descriptive coding
TEXT. & CONCEPT. ANALYSIS
6- Revision 7- Descriptive code reduction 8- Revision
Codebook
9- Conceptual code reduction, and code families
Contingency table
10- Revision 11- Networks 12- Revision 13- Case taxonomy
SPSS: MDS & Ward's algorithm
14- Conceptual networks display 15- Textual evidences from networks 16- Founders' types and summary matrix of variables 17- Coherence matrix between groups of founders and their behaviour Discussion and conclusions
ATLAS. ti CONCEPTUAL NETWORKS MATRIX ANALYSIS
20 FIGURE 2: Founder's Relationships ~Founder's Formal Education
~Family Background -
~Family Background + ~Factor -
~Business Experience
~Hard Childhood
~Founder's Mentor ~Start up cause
~Activity Background -
~Activity Background +
CF:Background
Founder
~Stability
CF:Founders' Values
~Innovation
~Growth ~Satisfaction
~Economic Interest
~Ambition ~Negative human relations
~Hard Work
~Negative Failure Perception ~External Control
~Seriousness ~Honesty
~Task Orientation ~Family Sense
~Positive Failure Perception
~Constancy
~Risk Aversion
~Prosperous life
~Positive human relations
~Simplicity
~Risk-taking
~Internal Control
~Entrepreneurship ~Active life ~Autonomy
~Sacrifice ~Rigor
~People Orientation
~Determination
~Short term orientation
~Gratitude
~Long term orientation
~Ethical orientation
~Cosmopolitan Orientation
~Altruism ~Local Orientation
~Family Orientation
~Sense of Guilt ~Vocation
~Sense of achievement
~Business Orientation
21 TABLE 1: Contingency table of values and founders VALUES Altruism Ambition Autonomy Risk aversion Human relations Human relations + Constancy External cont. Internal cont. Entrepreneurship Growth Dependence Determination Egotism Sense of family Stability Gratitude Honesty Innovation Economic Interest Opportunistic Orienta Cosmopolitan Orienta Short-term Orient Business Orient Ethical Orient Family Orient Local Orient. Long-term orient People orient Task orient. -Failure Perception +Failure Perception Risk-taking Rigor Sacrifice Satisfaction Simplicity Sense of guilt Sense of achievement Seriousness Hard work Active life Contemplative life Prosperous life Vocation Total
3
4
PRIMARY DOCUMENTS 5 6 7 8 9 1 0 0 0 1 4 1 0 2 0 2 0 3 1 1 0 0 4 1 1 0 0 0 0 1 2 0 3 0 0 4 0 1 0 1 0 0 1 3 0 4 0 1 1 0 8 0 1 2 1 5 1 2 2 5 0 0 0 0 0 7 0 4 0 0 0 0 0 0 0 0 0 5 0 3 0 1 1 0 1 0 0 3 0 0 0 0 0 1 0 0 2 4 3 7 0 1 1 0 0 0 0 0 0 0
1
2
6 0 3 0 11 0 2 0 4 0 0 0 9 0 2 0 1 0 8 2 0
1 1 1 0 0 0 0 2 2 0 5 0 14 0 1 2 0 3 1 1 0
1 3 0 4 0 1 5 0 1 0 9 0 0 0 5 1 1 1 2 0 0
0 1 0 0 2 0 6 0 1 0 1 0 0 0 2 4 0 3 0 2 0
7
2
1
3
3
0
0
0
0 0 1 8 0 2 0 1 0 0 0 0 0 3 0 2 10
0 0 4 3 0 0 2 0 1 4 0 6 0 4 0 0 4
0 3 4 2 0 2 0 0 0 0 0 1 3 1 0 0 1
0 0 1 10 0 0 0 0 0 1 0 1 1 2 0 0 0
0 3 0 1 0 4 0 0 0 0 0 0 1 1 0 0 3
0 3 0 2 0 0 0 0 0 0 1 0 2 0 0 0 0
1 2 1 9 0 2 0 0 0 1 0 0 2 6 3 0 0
2 8 0 0 1 0 93
2 5 0 0 0 0 71
0 2 0 0 0 0 64
3 5 0 0 1 0 50
0 2 0 0 0 0 55
1 5 0 0 0 0 20
2 3 3 0 3 1 73
Total 10 3 3 0 0 1 1 2 1 2 2 2 0 1 0 0 0 1 1 0 2 0
11 0 2 0 0 0 0 1 0 2 0 4 0 1 0 2 3 0 0 1 0 0
12 2 8 0 0 1 0 1 0 2 1 0 0 3 0 1 0 0 2 6 3 0
12 1 10 1 0 0 0 2 2 2 5 7 0 3 0 3 0 0 2 0 0 0
16 35 12 10 16 7 25 9 22 20 43 0 42 0 24 13 6 13 34 12 0
5
0
1
1
0
23
0 4 0 0 0 1 1 0 0 0 0 0 2 1 1 1 2
0 1 1 3 0 1 0 0 0 0 2 0 1 3 2 0 1
0 5 5 0 0 1 3 0 0 2 0 0 1 1 0 0 0
0 5 1 2 1 1 0 0 0 1 1 1 2 3 0 0 1
0 1 0 4 1 1 2 0 0 2 0 2 2 1 0 0 1
0 8 2 2 1 2 3 0 0 2 0 1 3 3 2 0 3
1 35 20 46 3 17 11 1 1 13 4 12 20 39 8 3 26
2 2 1 0 0 0 34
0 1 1 0 1 0 45
1 3 2 0 0 0 46
0 1 1 0 0 3 41
5 8 4 0 3 2 70
3 10 2 0 0 0 85
21 55 14 0 9 6 747
22
Configuración de estímulos derivada FIGURE 3: Plot of the founders’ value system in the Euclidean space
Modelo de distancia euclídea 3
Self-fulfilment values 12 2 38
2 10 1
Dimensión 2
26 29 8 16
9
3925
24
Business as an end 21
0
32 22
11 -1
37 31
6 34 7
4120 15
28
36 1 18 35 27 3 40
5
Business as a means
19 23 17
30 13 14 33 4
Group orientation values
-2 -3
-2
-1
0
1
2
3
Dimensión 1 1st AXIS: BUSINESS DIMENSION: 2nd AXIS: PSYCHOSOCIAL DIMENSION: Positive axis, Self-fulfilment values Positive axis, Business as a means Negative axis, Group orientation values Negative axis, Business as an end Meaning of numbers’ values in the plot of Figure 1 1 Altruism 22 Ethical orientation 2 Ambition 23 Family orientation 3 Autonomy 24 Local orientation 4 Risk aversion 25 Long-term orientation 5 Negative human relations 26 People orientation 6 Positive human relations 27 Task orientation 7 Constancy 28 Negative perception of failure 8 External control 29 Positive perception of failure 9 Internal control 30 Risk-taking 10 Entrepreneurship 31 Rigor 11 Growth 32 Sacrifice 12 Determination 33 Satisfaction 13 Sense of family 34 Simplicity 14 Stability 35 Sense of guilt 15 Gratitude 36 Sense of achievement 16 Honesty 37 Seriousness 17 Innovation 38 Hard work 18 Economic interest 39 Active life 19 Cosmopolitan orientation 40 Prosperous life 20 Short-term orientation 41 Vocation 21 Business orientation
23
Configuración de estímulos derivada
FIGURE 4: Single plot of founders in the values’ space (dimensions one and two)
Modelo de distancia euclídea
1,5
c ase 5
1,0 c ase 1
case 13
,5
case 12 case 10 c ase 8 case 11
0,0
c ase 6 c asec9ase 4
Dimensión 2
-,5 c ase 3 -1,0 -1,5
c ase 7
-2,0 -2
-1
0
1
2
3
4
Dimensión 1 1st AXIS: BUSINESS DIMENSION: Positive axis, Business as a means Negative axis, Business as an end
2nd AXIS: PSYCHOSOCIAL DIMENSION: Positive axis, Self-fulfilment values Negative axis, Group orientation values
24
FIGURE 5: Clustering of founders profiles
1st AXIS: BUSINESS DIMENSION: Positive axis, Business as a means Negative axis, Business as an end
2nd AXIS: PSYCHOSOCIAL DIMENSION: Positive axis, Self-fulfilment values Negative axis, Group orientation values