used scanning electron microscopy (SEM) and a computer- ... electron microscopy were prepared by placing drops of the phytolith ..... a grazer or browser.
A typologic and morphometric study of variation in phytoliths from einkorn wheat (Triticum monococcum) TERRY B. BALL Can. J. Bot. Downloaded from www.nrcresearchpress.com by BRIGHAM YOUNG UNIVERSITY LIBRARY - PROVO on 04/01/15 For personal use only.
Departrnerlt of Atlcietlt Scripture, Brighnrn Young University, Provo, UT 84602, U.S.A. AND
JACKD. BROTHERSON A N D JOHNS. GARDNER Department of Botany and Range Science, Brigharn Young University, Provo, UT 84602, U.S.A. Received January 2 1, 1993 N , and GARDNER, J.S. 1993. A typologic and morphometric study of variation in phytoliths from BALL,T.B., B R ~ H E R S OJ.D., einkorn wheat (Triticum monococcum). Can. J. Bot. 71: 1182 - 1 192. Variation between phytoliths produced in the laminae, inflorescence bracts, and culrns of einkorn (Triticurn nzonococcurn L.) were examined. Variation in the type of phytoliths produced and in the morphometries of the various types produced was evaluated. Morphometric data were obtained using computer-assisted image analysis. Types of phytoliths produced by various plant tissues included silica cell, large and small prickle, hair cell, trichome base, stomata, sheet element, long cell, and subepidermal cell phytoliths. Laterally dendriforrn subepidermal cell phytoliths were unique to inflorescence tissue. Long (100-250 pm), sinuate, alate trapezoid phytoliths were unique to lamina tissue. Tukey honestly significant difference comparisons indicated that there are some significant differences ( p 5 0.05) between the mean rnorphornetries of silica cell phytoliths produced in the lamina tissue and those produced in the culm and inflorescence tissues. Discriminant functions based on the morphometric data obtained were effective in distinguishing between populations of silica cell phytoliths extracted from each of the plant tissue types. These results suggest that (i) when preparing reference matrial f o r phytolith analysis, each part of a plant should be sampled and evaluated separately, and (ii) discriminant analysis of rnorphometric data obtained through image analysis is a potentially valuable research tool for the further development and application of phytolith systematics. Key words: phytoliths, image analysis, Triticum monococcum. BALL,T.B., BROTHERSON, J.D., et GARDNER, J.S. 1993. A typologic and rnorphometric study of variation in phytoliths from einkorn wheat (Triticurn monococcum). Can. J. Bot. 71 : 1182-1192. Les auteurs ont examine la variation entre les phytolithes produits dans le lirnbe, dans les bractCes de l'inflorescence et dans les chaurnes de l'engrain (Triticum rnonococcurn L.). 11s ont CvaluC la variation des types de phytolithes produits ainsi que dans les rnorphornttries des divers types produits. Les donnCes rnorphornCtriques ont CtC obtenues par analyse d'irnage assistte par ordinateur. Les types de phytolithes produits sont les phytolithes des cellules B silice, des petits et des grands aiguillons, des cellules pileuses, de la base des trichornes, des stornates, des ClCments de la gaine, des cellules longues et des cellules subtpidermiques. Les cellules subCpidermiques des tissus de l'inflorescence posskdent des phytolithes lateralernent dendriforrnes uniques. Les tissus du lirnbe ont en exclusivitC de longs (100-250 pm) phytolithes sinuCs alates et traptzo'ides. La comparaison HSD du Tukey montre des differences significatives ( p 5 0.05) entre les rnorphornCtries rnoyennes des phytolithes des cellules B silice produites dans les tissus du lirnbe, comparativement a ceux qu'on retrouve dans les tissus des chaumes et ceux de I'inflorescence. Les fonctions discrirninantes basCes sur les donntes morphornttriques obtenues se sont avCrCe aptes B distinguer entre les populations des phytolithes des cellules a silice extraits de chacun des types de tissus de la plante. Ces rCsultats suggkrent que (i) lorsqu'on prCpare du matkriel de rCfCrence pour l'analyse des phytolithes, chaque partie de la plante doit &treCchantillonnCe et analysCe sCparCrnent, et (ii) l'analyse discrirninante des donnCes morphomCtriques obtenues par analyse d'irnage constitue un outil de recherche acceptable pour le dCveloppernent ultCrieur et l'application de la systkmatique des phytolithes. Mots clis : phytolithes, analyse d'image, Triticum monococcum. [Traduit par la rUaction]
Introduction Solid deposits of amorphous hydrated silica are formed at specific intracellular and extracellular locations in many plant taxa. These deposits of silica, as well as other types of plant mineral deposits, are called phytoliths, litrally meaning plantrocks. Many plants produce phytoliths with morphological characteristics that appear unique to a given taxon, a phenomenon giving them taxonomic significance. Because phytoliths are mineral, they resist decomposition. When plant tissue decomposes, any phytoliths it has produced are released into the surrounding environment, where they maintain their morphological integrity, even if they are burned, buried, or ingested. Such released phytoliths become microfossils of the plants that produced them. From the beginning of the 20th century microfossil phytolith analysis has proved valuable in archaeological research (Rovner 1983). Pr~nledin Canada / Imprim6 au Canada
Microfossil phytoliths have been collected from such diverse sources as paleosols exposed by erosion or excavation (Piperno 1988), ceramics and bricks made from clay upon which vegetation once grew, or to which plant fibers were added (R.L. Rands and M.M. Bargielski, unpublished paper1),tooth tartar and coprolites of herbivores (Armitage 1975; Bryant and Williams-Dean 1976), the surface of stone tools used to process vegetation (Kamminga 1979; Anderson 1980), and sedimentary rocks (Jones 1964). Once collected and analyzed, microfossil phytoliths can provide researchers with significant archaeobotanical information. Piperno (1988) and Pearsall (1989) demonstrated how 'Unpublished paper presented at the 51st Annual Meeting of the Society for American Archaeology, New Orleans, 1986; available from the authors.
1183
BALL ET AL.
TABLE1. Description of the size morphometries analyzed Morphometry
Description
Area Convex area Perimeter Convex perimeter Lengtha Breadth Fiber length Width Equivalent diameter
Simple area of the feature Area within a taut string around the feature Length of the feature boundary Length of a taut string around the feature Longest cord within the feature Minimum caliper diameter of the feature Length of the feature along its medial axis The minor dimension of the feature Diameter of a circle with the same area as the feature Radius of largest circle that can be drawn in the feature
TABLE 2. Description of the shape morphometries analyzed Morphometry
Description
Can. J. Bot. Downloaded from www.nrcresearchpress.com by BRIGHAM YOUNG UNIVERSITY LIBRARY - PROVO on 04/01/15 For personal use only.
-
Inscribed radius
'Length as measured by IAS 1s not equ~valentto length as measured by eyeplece micrometer
the use of phytolith analysis in archaeology enhances recovery of data at sites where the preservation of other plant remains is poor. They further indicate that when phytolith analysis is used in conjunction with other plant remains, it adds precision and support to any interpretations made. Variations in the simple shapes and types of phytoliths produced in different parts of a single plant species have frequently been reported (Parry and Smithson 1964, 1966; Blackman 1971; Terrell and Wergin 1981; Brown 1984; Piperno 1988; Mulholland et al. 1988, 1990). Studies of this nature are an important requisite to the continued and improved application of phytolith analysis in taxonomic and archaeological research. The purpose of the study reported herein was to analyze the variation between phytoliths produced in the inflorescence bracts, culms, and laminae of another archaeologically important species, Triticum monococcum (Einkorn). Einkorn is a diploid wheat thought to have been domesti~ been cultivated since cated from Triticum boeoticum. 1 t has neolithic times in Europe and the Ancient Near East and is currently grown in most countries of the European continent (Renfrew 1973). Previous studies investigating einkorn phytoliths include Kaplan et al. (1992), who reported on the types of phytoliths produced by many of the cereal grains, and Rosen (1992), who reported on the types and sizes (width and height) of phytoliths produced in the epidermis of the inflorescence bracts in several wild and domestic grasses. In our study, we analyzed not only the variation in the types of phytoliths produced by the different plant parts of Einkorn but also used scanning electron microscopy (SEM) and a computerassisted image analysis system (IAS) to evaluate and quantify the variation in 18 morphological parameters of shape and size, i.e., morphometries of the various types of phytoliths produced in the different plant parts (Tables 1 and 2; for a review of IAS and morphometric analysis of phytoliths see Rovner and Russ 1992).
Material and methods Seeds of one accession of T. rnorzococcurn were obtained from the National Small Grains Collection of the USDA Agricultural Research Service in Aberdeen, Idaho. These were planted, germinated, and the young plants vernalized for 6 weeks at 40" Fahrenheit (5°C) to ensure future seed set. After vernalization, the plants were allowed to mature, set seed, and dry. Plant tissue from the culms, laminae, and inflorescence bracts was then harvested. Phytoliths produced in
Form factor Roundness Convexity Solidity Compactness Aspect ratio Elongation Curl
4 x area x a over perimeter2; 1.0 for a perfect circle; diminishes for irregular shapes 4 x area over a x length2; 1.0 for a perfect circle; diminishes with elongation of-the feature Ratio of convex perimeter to perimeter; 1.0 for a perfectly convex shape; diminishes if there are surface indentations Ratio of area to convex area; 1.0 for a perfectly convex shape; diminishes if there are surface indentations Ratio of the equivalent diameter of the length Ratio of length to width Ratio of fiber length to width Ratio of length to fiber length
the three types of plant tissue were extracted and prepared for SEM following a modified version of the procedures of L. Kaplan and M.B. Smith (unpublished paper') as follows: (i) Plant tissue from which phytoliths were to be extracted was chopped, placed in a clean beaker, and sonicated for 10 min in distilled water. The tissue was rinsed several times in distilled water and dried by placing the beakers in a drying oven overnight at 60°C. Chromic acid was then added to the beakers at a ratio of about 40 mL of acid to 0.5 g of dried tissue to digest the organic materials of the tissue and thus yield a suspension of extracted phytoliths. The digestion reaction was accelerated by heating the tissue-acid mixture at approximately 40°C for 20 min under a fume hood. (ii) Following digestion, the phytoliths and acid were separated by centrifugation. The supernatant was removed with a pipette and discarded. The precipitate was then resuspended in distilled water, and again separated by centrifugation. Resuspension and centrifugation were repeated three times in distilled water, followed by three times in absolute ethanol. (iii) Samples for electron microscopy were prepared by placing drops of the phytolith suspension on clean cover slips that were adhered to stubs using double-sided tape. After air drying, the stubs were sputter coated with approximately 10 nm of gold, and the cover slips grounded to the stubs using silver paint. SEM images of the extracted phytoliths were recorded using a videocassette recorder connected to the video signal of a Quantel Crystal unit attached to a JEOL 840A microscope. A 5-kV accelerating potential and 15-mm working distance at magnifications from 250 to 2000 were used. The morphometric analysis of the images was performed using a Macintosh IIci computer equipped with a Data Translation DT-2255 frame grabber board (Data Translation Inc., Marlboro, Md.) and "Prism" IAS software (Dapple Systems, Inc., Sunnyvale, Calif.). All statistical analyses of the data were performed using SYSTAT statistical software (Systat, Inc., Evanston, 111.). The types of phytoliths produced in each plant part were noted and described. Eighteen morphometric parameters dealing with size and shape were then measured for the top surfaces of a sample population of 70 silica cell type phytoliths extracted from each plant part. It was felt that a sample size of 70 would be more than adequate to provide confidence that the sample means reflected the population means. Tukey honestly significantly difference (HSD) multiple comparison tests on the data thus obtained were performed to identify any significant differences (95 % confidence level) between the mean morphometries of the silica cell phytoliths produced in the various plant parts. Tukey's test was chosen for the comparisons because it is relatively conservative in regards to both type I and type I1 statistical error. 'Unpublished paper distributed at the 45th annual meeting of the Society for American Archaeology, Philadelphia, 1980; available from the authors.
Can. J. Bot. Downloaded from www.nrcresearchpress.com by BRIGHAM YOUNG UNIVERSITY LIBRARY - PROVO on 04/01/15 For personal use only.
Can. J. Bot. Downloaded from www.nrcresearchpress.com by BRIGHAM YOUNG UNIVERSITY LIBRARY - PROVO on 04/01/15 For personal use only.
BALL ET AL.
1185
Can. J. Bot. Downloaded from www.nrcresearchpress.com by BRIGHAM YOUNG UNIVERSITY LIBRARY - PROVO on 04/01/15 For personal use only.
1186
CAN. J . BOT. VOL. 71, 1993
sizes and shapes of hair cell phytoliths was observed. They ranged from small, fragile hairs (Figs. 1, 10, 14) to large (600 pm) macrohairs (Figs. 9, 11). In contrast with the small prickles, hair cell phytoliths were narrower at the base than tall. They differed from the large prickles in being more filiform and delicate. The largest macrohairs appeared to be produced by lamina tissue. Hair cells were not common in culm tissue and could not be found on the epidermal surface of the culms. Those observed in the prepared phytolith samples may have originated from pieces of lamina sheaths still attached to the culm during tissue processing (cf. Figs. 13 and 14). Trichome bases (Figs. 15- 17) Hair cells and small prickles frequently disarticulated from their silicified bases leaving nearly round to oblong trichome base phytoliths. The bases had margins ranging from entire to sinuous. Frequently a row of pits circling just inside the outer margin of the bases was observed. Trichome base phytoliths were produced in all plant parts and were similar in size range. Stomata phytoliths (Figs. 18) Occasionally, the surface, cell walls, and (or) luminae of stomata accumulated silica. No stomata phytoliths were observed from inflorescence tissue but were common in culm and lamina tissue. The size ranges were similar for both plant parts. Epidermal long cell phytoliths (Figs. 19-24, 28, 29) The extracellular surface, cell walls, and (or) luminae of epidermal long cells frequently silicified. Long cell phytoliths remaining articulated are referred to as sheet elements. Those observed were thin and fragile (Figs. 19, 20, 28, 29). Sheet elements were observed in tissue from all plant parts. The margin of sheet element cells ranged from entire to sinuate to undulate. When undulate, adjacent lobes or waves were usually subequal in height. The range of wave height and wave width were overlapping for all parts, although culm sheet element long cells tended to be slightly smaller. Lamina tissue produced long (250 pm length) slightly sinuate and alate phytoliths (long trapezoids). They had flat to concave ends and sides and appeared to form as a result of the accumulation of silica in the long cells located between epidermal hairs (Figs. 22, 23). An enigmatic trapezoid phytolith, often referred to by the oxymoron long-short cells, was also produced in both culm and lamina tissue (Fig. 24). They were the result of silicification of either long silica cells or short long cells. They differed from typical silica cell phytoliths in that they were larger
( > 6 0 pm) and usually had sinuate margins. They differed from the long trapezoids discussed above in that they had convex ends and were much shorter ( < 100 pm). Other phytoliths (Figs. 2 5 -30) The silicification of subepidermal cells produced a plethora of various shaped phytoliths. Long subepidermal rods (to 700+ pm) ornamented with various shaped processes formed from the silicification of intracellular connections and pits were common. The rods were generally nearly round to oblong in cross section. Many kinds of processes on the rods were observed including aculeate, clavate, slightly dendriform, verrucate, cratiform, and (or) tuberculate (Figs. 25, 26). The processes were generally developed around the entire circumference of the rods. Verrucate and cratiform processes often developed in rows along the length of the rods. The ranges of rod length, width, and process length for all rod types were similar in all plant parts. In our study, no rods with verrucate or cratiform processes were observed in culm tissue. A unique, subepidermal, laterally dendriform phytolith was produced in the inflorescence bracts (Figs. 27-29). They were elliptical to oblong in cross section and had relatively long (to 20 + pm) dendriform processes extending outward on opposite sides. Although originally thought to be derived from epidermal long cells (Piperno 1988), they appear to be formed by silicification of the row of cells laying directly under and parallel to the inflorescence long cells (Figs. 28, 29). Kaplan et al. (1992) classified both the ornamented rod and the laterally dendriform cell phytoliths as sheet elements produced by either "depositions from watery exudates" or "multicelled sections of silica replaced epidermal tissue." Our results indicate that they are subepidermal in origin. Occasionally, phytoliths produced by the silicification of mesophyll cell walls were also observed (Fig. 30). Statistical analyses Tukey HSD comparison tests Tukey comparisons of the sample means for the morphometries of size for the top surface of silica cell phytoliths indicated that those produced in the inflorescence and culms were not significantly different ( p 5 0.05). In contrast, all the sample means of size morphometries of silica cell phytoliths produced in laminae tissue were larger (Table 4). Likewise, the shape morphometries of aspect ratio, elongation, roundness, and compactness were significantly different for lamina silica cell phytoliths than for those produced in the culm and inflor-
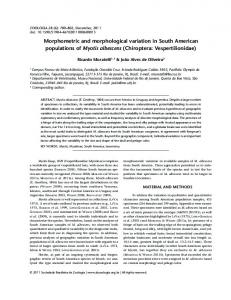
FIG.9. Scanning electron micrograph of large prickle phytolith extracted from lamina. All scale bars = 10 pm except as noted. FIG. 10. Scanning electron micrograph of lemma margin illustrating location of macrohairs (M). FIG. 11. Scanning electron micrograph of macrohair phytolith extracted from inflorescence. FIG. 12. Scanning electron micrograph of sheath epidermis illustrating structures that typically silicify. SP, small prickle; S, silica cell; H, hair cells. FIG. 13. Scanning electron micrograph of disarticulated hair cell phytolith extracted from lamina. Note how inner and outer silicified cell walls are about to disarticulate. Scale bar = 100 pm. FIG. 14. Scanning electron micrograph of culm epidermis illustrating structures that typically silicify. SP, small prickles; ST, stomata; S, silica cells. Note absence of hair cells. FIG. 15. Scanning electron micrograph of sheet element phytolith extracted from inflorescence tissue illustrating articulated trichome base phytoliths (T) with pits (P). Top view. FIG. 16. Scanning electron micrograph of disarticulated trichome base phytoliths extracted from inflorescence. Top view. FIG.17. Scanning electron micrograph of sheet element phytolith extracted from inflorescence illustrating articulated trichome base phytolith. Bottom view. FIG. 18. Scanning electron micrograph of stomata phytolith extracted from lamina. FIG. 19. Scanning electron micrograph of sheet element phytolith extracted from inflorescence illustrating undulating long cell margins. FIG.20. Scanning electron micrograph of sheet element phytolith extracted from inflorescence illustrating entire long cell margins. Scale bars = 10 pm. FIG.21. Scanning electron micrograph of disarticulating long cell phytoliths extracted from lamina. FIG.22. Scanning electron micrograph of long trapezoid phytolith extracted from lamina. Observed only in lamina tissue. FIG.23. Scanning electron micrograph of adaxial lamina epidermis illustrating in situ location of characteristic long trapezoid phytolith (LT) pictured in Fig. 22. FIG.24. Scanning electron micrograph of long-short cell phytolith extracted from lamina. FIG.25. Scanning electron micrograph of subepidermal rod-shaped phytoliths extracted from lamina. Still slightly articulated. Note verrucate and cratiform processes on the rods. FIG.26. Scanning electron micrograph of subepidermal rod-shaped phytolith extracted from inflorescence. Note clavate processes. Scale bars = 10 pm.
Can. J. Bot. Downloaded from www.nrcresearchpress.com by BRIGHAM YOUNG UNIVERSITY LIBRARY - PROVO on 04/01/15 For personal use only.
Can. J. Bot. Downloaded from www.nrcresearchpress.com by BRIGHAM YOUNG UNIVERSITY LIBRARY - PROVO on 04/01/15 For personal use only.
1188 CAN. I. BOT. VOL. 71, 1993
Can. J. Bot. Downloaded from www.nrcresearchpress.com by BRIGHAM YOUNG UNIVERSITY LIBRARY - PROVO on 04/01/15 For personal use only.
BALL ET AL.
1189
C A N . J.
Can. J. Bot. Downloaded from www.nrcresearchpress.com by BRIGHAM YOUNG UNIVERSITY LIBRARY - PROVO on 04/01/15 For personal use only.
1190
BOT. VOL. 71,
1993
FIG. 27. Scanning electron micrograph of laterally dendriform subepidermal phytolith extracted from inflorescence. Observed only in inflorescence tissue. FIG. 28. Scanning electron micrograph of silicified inflorescence tissue illustrating in situ location of laterally dendriform subepidermal phytoliths (D), long cells (L), and trichome base (T). FIG. 29. Scanning electron micrograph of silicified inflorescence tissue illustrating in situ location of laterally dendriform subepidermal phytoliths (D) and long cells (L). FIG. 30. Scanning electron micrograph of mesophyll phytolith extracted from lamina illustrating cell wall silicification. Scale bars = 10 pm.
escence tissue. Additionally, the mean form factor of the lamina phytoliths was smaller than that of inflorescence phytoliths, while the mean convexity of the lamina phytoliths was less than that of culm phytoliths. None of the other morphometries of shape differed significantly between plant parts (Table 5).
of this model are found in Table 6. In our test of these discriminant functions on the samples of 100 silica cell phytoliths from each tissue type, 68% of the inflorescence phytoliths, 77% of the lamina phytoliths, and 67% of the culm phytoliths were correctly classified. In each case, the majority of phytoliths were identified with the correct populations (Table 7).
Discriminant analysis Best discriminant resolution was obtained when all 16 of the morphometries shown to be significantly different by the Tukey comparisons were used in the discriminant functions, i.e., when the insignificant morphometries of solidity and curl were not included in the model (Table 5). Accordingly, the best model tested was as follows: 16 significantly different morphometries = constant plant part. The canonical coefficients for the discriminant functions derived from the analysis
Discussion Our results indicate that phytoliths produced by the inflorescence bracts, laminae, and culms for the accession of T. monococcum tested varied both typologically and morphometrically . This conclusion suggests that when collecting reference data for wheat phytolith analysis, samples of a single plant part may not be representative of either the types or the morphometries of phytoliths produced by the whole plant.
+
BALL ET AL.
TABLE4. Descriptive statistics and results of Tukey HSD comparisons for size morphometries of the top surfaces of silica cell phytoliths produced by different parts of Triticurrz rnonococcurn Culm
Can. J. Bot. Downloaded from www.nrcresearchpress.com by BRIGHAM YOUNG UNIVERSITY LIBRARY - PROVO on 04/01/15 For personal use only.
Inflorescence
Lamina
Morphometry
Min.
Max.
Mean
Min.
Max.
Mean
Min.
Max.
Area Convex area Perimeter Convex perimeter Length Breadth Fiber length Width Equivalent diameter Inscribed radius
241.6 241.6 60.4 57.8 22.2 14.4 22.2 13.9 17.4 7.4
678.8 679.5 101.1 95.7 36.3 27.0 38.0 26.3 29.4 13.2
448.6 450.4 81.4 77.0 28.2 21.0 29.9 20.1 23.7 10.5
268.0 270.2 63.8 60.9 22.0 14.0 23.5 13.5 18.5 7.0
850.7 851.0 119.4 112.5 45.2 3 1.6 45.7 30.4 32.9 15.3
527.8 529.5 88.3 84.3 3 1.O 22.3 32.5 21.4 25.7 11.0
388.0 391.1 75.7 72.2 25.9 19.1 27.3 17.5 22.2 9.4
1493.3 1496.2 157.7 147.3 58.8 35.7 61.6 34.9 43.6 17.7
Mean
-
823.8 829.1 111.2 105.3 39.1 27.2 41.4 26.2 31.9 13.5
NOTE: Tukey tests indicate that lamina means are significantly larger than culm and inflorcsccnce means at p 5 0.05. N = 70. All linear measurements are in micrometres, all area measurements in square micrometres.
TABLE 5. Descriptive statistics and results of Tukey HSD comparisons for shape morphometries of the top surfaces of silica cell phytoliths produced by different parts of Triticurn monococcum Inflorescence Morphometry
Min.
Max.
Mean
Culm Min.
Max.
Lamina Mean
Min.
Max.
Mean
Roundness Compactness Aspect ratio Elongation Form factor Convexity Solidity Curl NOTE: Significance was determined at p 5 0.05; N = 70. "Mean is significantly smaller than culm and inflorescence means. is significantly larger than culm and inflorescence means. 'Mean is significantly smaller than inflorescencc mean. " ~ e a nis significantly smaller than culm mean. "No significant differences between any sample means.
can
TABLE 6. Coefficients of discriminant functions for silica cell phytoliths extracted from various plant parts of Triticurn rnonococcurn
TABLE7. Results of discriminant analysis of silica cell phytoliths extracted from various parts of Triticurn rnonococcurn Predicted plant part
Coefficients Morphometry
x coordinate
y coordinate
Area Convex area Perimeter Convex perimeter Length Breadth Fiber length Width Equivalent diameter Inscribed radius Form factor Roundness Convexity Compactness Aspect ratio Elongation NOTE: These coefficients were standardized by the within-groups standard deviations. Since they are not raw coefficients, there is no need for a constant.
Actual plant part Inflorescence Laminae Culms Total
Inflorescence
Lamina
Culm
Total
68 2 23 93
0 77 10 87
32 21 67 120
100 100 100 300
NOTE: Predictions were based on discriminant functions derived from 16 morphometries; N = 100 per plant pan.
The typologic and morphometric variation in phytoliths produced by different plant parts may prove to be beneficial to archaeobotanists. With the continued development of systematics for microfossil phytoliths, researchers should be able to identify not only the taxa, but also the parts of the plants used or processed at a particular site. Rosen (1992) showed how such information can assist the researcher in making inferences about the use of activity areas at sites from which the phytoliths were collected. Variation between phytoliths produced by different plant
Can. J. Bot. Downloaded from www.nrcresearchpress.com by BRIGHAM YOUNG UNIVERSITY LIBRARY - PROVO on 04/01/15 For personal use only.
1192
CAN. I. BOT. VOL. 71, 1993
parts may prove useful to other disciplines as well. For exarnple, by extracting phytoliths from teeth tartar, paleontologists may be able to determine what parts of a plant constituted the preferred diet of an extinct species or whether the species was a grazer or browser. In practice, the plant part or taxa producing a particular microfossil phytolith population will most easily be determined typologically. For instance, in the case of einkorn, if laterally dendriform phytoliths are present, then one can assume that inflorescence tissue contributed phytoliths to the population. If long alate trapezoid long cell phytoliths are observed, then it can be concluded that lamina tissue probably contributed to the assemblage. If there is a paucity of hair cell phytoliths combined with the presence of long-short cell phytoliths and the absence of long trapezoids, then the phytoliths most likely originated from culm tissue. Morphometric and statistical analysis may be used to validate conclusions based on typologic differences or in the absence of distinctive phytolith types, as is often the case in archaeological settings, to make inferences about the kinds of tissue or taxa that produced a phytolith assemblage. Overlaps in the ranges of the morphometries of phytoliths produced in the different plant parts indicate that the morphometries of neither individual phytoliths nor of small sample sizes can be used with confidence to determine the plant part that produced them. However, the Tukey tests indicate that the mean morphometries of a large sample size of silica cells can be used to distinguish phytolith populations produced by lamina tissue from those produced by culm and inflorescence tissue. The canonical discriminant analysis results suggest that discriminant functions may also be useful in determining the kind of plant tissue that produced a particular phytolith assemblage. It should be noted that although a majority of the silica cell phytoliths were correctly classified by the discriminant functions tested in this study, there was also a considerable percentage misclassified, i.e., 23 - 33 % . This observation suggests once again that the procedure is not robust unless an adequately large sample size is evaluated.
Acknowledgements We wish to thank the National Small Grains Collection of the USDA Agricultural Research Service in Aberdeen, Idaho, for providing the einkorn seed used in this study. We also wish to thank Michael D. Standing for his assistance in the Electron Optics Laboratory, and Wilford M. (Bill) Hess for providing computer facilities. This material is based on work supported under a National Science Foundation Fellowship. Anderson, P.C. 1980. A testimony of prehistoric tasks: diagnostic residues on stone tool working edges. World Archaeol. 12: 181 194. Armitage, P.L. 1975. The extraction and identification of opal phytoliths from the teeth of ungulates. J. Archaeol. Sci. 2: 187- 197.
Ball, T.B., and Brotherson, J.D. 1992. The effect of varying environmental conditions on phytolith morphometries in two species of grass (Boriteloua curtipenduln and Panicutn virgatum). Scanning Electron Microsc. 6: 1163 - 1182. Blackman, E. 1971. Opaline silica bodies in the range grasses of southern Alberta. Can. J. Bot. 49: 769-781. Brown, D.A. 1984. Prospects and limits of a phytolith key for grasses in the central United States. J. Archaeol. Sci. 11: 345368. Bryant, V.M., Jr., and Williams-Dean, G. 1976. The coprolites of man. In Avenues of antiquity. Edited by B. Fagan. W.H. Freeman and Co., San Francisco. pp. 257-266. Jones, R.L. 1964. Note on occurrence of opal phytoliths in some cenozoic sedimentary rocks. J. Paleontol. 38: 773-775. Kamminga, J. 1979. The nature of use-polish and abrasive smoothing on stone tools. It1 Lithic use-wear analysis. Edited by B. Hayden. Academic Press, New York. pp. 143- 157. Kaplan, L., Smith, M.B., and Sneddon, L.A. 1992. Cereal grain phytoliths of Southwest Asia and Europe. In Phytolith systematics. Edited by G. Rapp, Jr. and S.C. Mulholland. Plenum Press, New York. pp. 149- 174. Lachenburch, P.A. 1975. Discriminant analysis. Hafner Press, New York. Mulholland, S.C., Rapp, G., Jr., and Ollendorf, A.L. 1988. Variation in phytoliths from corn leaves. Can. J. Bot. 66: 2001 -2008. Mulholland, S.C., Rapp, G., Jr., Ollendorf, A.L., and Regal, R. 1990. Variation in phytolith assemblages within a population of corn (cv. Mandan Yellow Flour). Can. J. Bot. 68: 1638- 1645. Parry, D.W., and Smithson, F. 1964. Types of opaline silica depositions in the leaves of British grasses. Ann. Bot. (London), 28: 169- 185. Parry, D.W., and Smithson, F. 1966. Opaline silica in the inflorescence of some British grasses and cereals. Ann. Bot. (London), 30: 525 -538. Pearsall, D.M. 1989. Paleoethnobotany: A handbook of procedures. Academic Press, San Diego. Piperno, D.R. 1988. Phytoliths analysis: an archaeological and geological perspective. Academic Press, San Diego. Renfrew, J.M. 1973. Paleoethnobotany. Columbia University Press, New York. Rosen, A.M. 1992. Preliminary identification of silica skeletons from near eastern archaeological sites: an anatomical approach. In Phytolith systematics. Edited by S. Mulholland and G. Rapp, Jr. Plenum Press, New York. pp. 129-147. Rovner, I. 1983. Plant opal phytolith analysis: major advances in archaeobotanical research. In Advances in archaeological method and theory. Vol. 6. Edited by M. Schiffer. Academic Press, New York. pp. 225-266. Rovner, I., and Russ, J.C. 1992. Darwin and design in phytolith systematics: Morphometric methods for mitigating redundancy. Itz Phytolith systematics. Edited by S. Mulholland and G. Rapp, Jr. Plenum Press, New York. pp. 253-276. Terrell, E.E., and Wergin, W.P. 1981. Epidermal features and silica deposition in lemmas and awns of Zizania (Gramineae). Am. J. Bot. 68: 697-707.