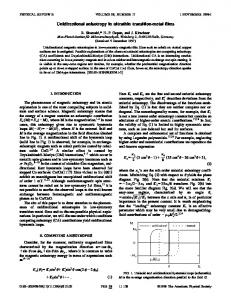
spleen liver. 0. 50. 100. DiI+. /CD6. 8. + c e lls. % o. f a ll C. D. 6. 8. + c e lls. DiI+/CD68+ cells after 48h. Figure S1 â Related to Figure 1. CD11b. DiI. F4/80 merge.
Cell Reports, Volume 23
Supplemental Information
A Unidirectional Transition from Migratory to Perivascular Macrophage Is Required for Tumor Cell Intravasation Esther N. Arwert, Allison S. Harney, David Entenberg, Yarong Wang, Erik Sahai, Jeffrey W. Pollard, and John S. Condeelis
Supplemental experimental procedures Primers (Sigma) used for qPCR: mCXCR4: For: 5'-AGCCTGTGGATGGTGGTGTTTC-3', Rev: 5’- CCTTGCTTGATGACTCCCAAAAG -3' Housekeeping genes: CPH: For: 5'- ATGGTCAACCCCACCGTG-3', Rev: 5' -TTCTTGCTGTCTTTGGAACTTTGTC - 3', GAPDH For: 5’-GTGCAGTGCCAGCCTCGTCC-3’, Rev: 5’-GCCACTGCAAATGGCAGCCC-3’ ACTB For: 5’-GGAAGGTGACAGCATTGCTTC-3’, Rev: 5’-GGTCTCAAGTCAGTGTACAGG-3’ Antibodies used for IF & FACS Antigen
Fluorochrome
Host
Clone/antibody #
Provider
Dilution
CD45
BV510/PE/FITC
Rat mono
30-F11
Biolegend
1:100
CD31
biotin
Rat mono
390
Biolegend
1:100
CD31
AF488
Goat poly
# FAB3628G
R&D systems
1:50
CD68
AF488/594/647
Rat mono
FA-11
Biolegend
1:100
CD11b
FITC/APC
Rat mono
M1/70
eBioscience
1:100
Gr-1
PE-cy7
Rat mono
RB6-8C5
eBioscience
1:100
F4/80
FITC/PE/APC/AF594
Rat mono
BM8
eBioscience
1:100
CD206
AF647
Rat mono
C068C2
Biolegend
1:200
streptavidin
488/555/647
N/A
N/A
Invitrogen
1:800
unconjugated
Rat mono
V.7C7
Santa Cruz
1:50/1:200
aSMA
Cy3
Mouse mono
1a4
Sigma
1:200
CXCR4
unconjugated
Rabbit mono
UMB2
Abcam
1:200
CXCR4
unconjugated
Rabbit poly
# H-188
Santa Cruz
1:50
Vimentin
unconjugated
Mouse mono
LN-6
Sigma
1:200
CXCL12
unconjugated
Rabbit poly
# 14-7992-81
Biolegend
1:100
endomucin
FITC/AF680 or
Figure S1 – Related to Figure 1 B
A
CTCs with clodronate Liposomes CTCs with Clodronte liposomes
2-7 days
CTC/ml blood
1500
Collect tissues, CTCs
IV DiI/Clo liposomes – label/kill phagocytic cells
1000
500
***
F4/80
merge
d7 lo C
C
C
CD68
DiI
Merge
CD68
DiI
Merge
1.49
0 er
sp *
30 20 10
=5 D
ay
=3 D
ay
=2 ay D
ay
=1
0
40
Gr-1
0.89
DiI
D=3 DiI
D=10 DiI
DiI/endo
DiI/endo
*** ***
30 20 10 0
10
ns
0.26
DiI
I DiI+ cells/FoV
0.56
D
ns
H # DiI+ cells per FoV (20x)
40
D
0.030
DiI
liv
en le
ou m DiI+ cells % of CD11b+ cells
DiI+ in blood portion
1.26
F4/80
CD11b
50
tu
G
PyMT tumor - 48h after DiI
F
100
r
DiI+/CD68+ cells % of all CD68+ cells
DiI+/CD68+ cellscells after 48h DiI+/CD68+ after 48h
3
E
Spleen – 48h
Liver- 48h
DiI
D
tumor- 48h
D
lo
on tr
ol
d2
0
C CD11b
***
Figure S1 – DiI liposomes and EdU label few cells inside the tumor – related to Figure 1 (A) Schematic overview of experiments with DiI and clodronate liposomes. (B) Number of CTCs found per ml of blood in PyMT mice treated with PBS or clodronate liposomes: two and seven days after treatment. (C) Immunofluorescence (IF) imaging of PyMT tumor sections 48h after DiI liposome injection. TAMs are stained by CD11b (green) and F4/80 (red), a few DiI+ cells (grey) are indicated by an arrowhead. Scale bar is 10μm (D) IF imaging of liver or spleen sections 48h after DiI liposome injection. Macrophages are visualized by CD68-FITC (green), cells with DiI appear in red, nuclear counterstain: DAPI (blue). Scale bar is 20μm (E) Quantification of the proportion of CD68+ macrophages that took up DiI 48h after DiI liposome injection in tumor, spleen and liver. (F) Representative FACS plots gated on Single cells, DAPI- (alive), CD45+ cells showing DiI positive cells on X-axis and CD11b+, F4/80 or Gr-1 on Y-axis. Note that virtually all DiI+ cells are also CD11b+. (G) Quantification of the proportion of CD11b myeloid cells in the blood-portion of the tumor isolated used for FACS analysis that took up DiI at different times after DiI liposome injection. (H) IF imaging of a PyMT tumor at different days after DiI liposome injection, showing cells that ingested DiI (red), endothelial cells (green), nuclear counter stain: DAPI (blue). Scale bar is 10μm. (I) Number of DiI+ cells within a field of view, based on images like (H) and Fig 1B. Data shows mean SD, each data point represents an individual animal (C).
Figure S2 – Related to Figure 1
B
A Tumor/dextran vessels/Collagen/ CSF1R-eGFP
Start: 0’
75’
Tumor/dextran vessels/Collagen/ CSF1R-eGFP
D
C 1.5
** *
IV EdU – label dividing cells Incl monocytes
1.0
At different time points after EdU Collect blood, tissues
E
0.5
Tumor
Bone marrow
Spleen
la
r
0.0
CD31/EdU/CD68
9h after EdU injection
EdU/CD11b
9h after EdU injection
EdU/CD68
9h after EdU injection
no
npe
riv
pe
as
riv
cu
as
la
r
cu
average displacement (µm/frame) over total movie
CSF1R-eGFP motility
Figure S2 – DiI liposomes and EdU label few cells inside the tumor – related to Figure 1. (A) Still from Movie S1 indicating different types of CSF1R-eGFP niches: within the tumor cell nest (yellow), perivascular (orange) and non-perivascular cells (purple) in stromal, collagen-rich areas (white arrows indicating collagen fibers identified by second harmonic signal. (B) An example of the tracking of CSF1R-eGFP+ cells at start (arrowheads indicating starting points of cells: orange (perivascular) and purple (stromal/non-perivascular) and end of tracking. Different color lines represent individual paths, note perivascular cells do not move away throughout movie therefor the tracking-line will appear as a dot. (C) Speed analysis of CSF1R-eGFP+ cells within PyMT tumors. eGFP+ cells were picked at start of movie based on their location and followed as long as they were visible with ImageJ manual tracking plug-in (n=3 PyMT animals) Data shows mean SEM, each data point represents an individual macrophage. (D) Schematic illustration of the EdU labelling experiment design. (E) Fluorescent micrographs of section of tumor (left panel), bone marrow smear (middle panel) and blood smear (right panel). EdU+ cells (red), macrophages are visualized by CD68 (green) and blood vessels by CD31 (cyan). Myeloid cells in the bone marrow are visualized by CD11b (green). White arrowheads indicate a few proliferating CD11b+ in the bone marrow or CD68+ cells in the spleen. Scale bar is 20μm. Note that there are no EdU+/CD68+ cells found in the tumor at this time point (left panel) or in the blood (Fig 1E), while several EdU+/CD11b+ cells are found within the bone marrow and a few EdU+/CD68+ cells in the spleen.
Figure S3 Related to Figure 2
B
A Control
5day b/b > 3 day recovery-
CD68 Endo DAPI
CD68 Endo DAPI
C
D 5day b/b > 7 day recovery-
5day b/b > 9 day recovery
CD68 Endo DAPI
CD68 Endo DAPI
Figure S3 – Additional marker stainings of macrophage depletion experiments – related to Figure 2. (A-D) IF imaging of PyMT tumor sections at different days after final B/B treatment. TAMs are visualized with CD68 (cyan) and endomucin (magenta), nuclei are stained with DAPI (grey), scale bar is 25μm
Figure S4 – Related to Figure 2 A
CD206Endo
CD68 Endo
CD206CD68 Endo DAPI
Control
CD206Endo
CD68 Endo
CD206CD68 Endo DAPI
CD206Endo
CD68 Endo
CD206CD68 Endo DAPI
CD206Endo
CD68 Endo
CD206CD68 Endo DAPI
D4
D7
D10
%CD206+ TAMs perivascular 100 80 *
60 40 * *
20
proportion CD206+/CD68+ TAMs
C 1.0
ns
ratio CD206/CD68
ns
0
ns
0.8 0.6 0.4 0.2
d9 /1 0
d6 /7
d3 /4
d1
c
d9 /1 0
d6 /7
d3 /4
d1
0.0 c
%CD206+/CD68+ perivascular
B
Figure S4 – Additional marker stainings of macrophage depletion experiments – related to Figure 2. (A) IF imaging of MaFIA tumor sections at different times after the final b/b treatment. TAMs are visualized with CD206/MRC1 (cyan), CD68 (yellow) and blood vessels with endomucin (magenta), nuclei are stained with DAPI (grey), scale bar is 25μm. (B Quantification of images as seen in (B) showing the % of perivascular TAMs that are also CD206 positive. (C) Quantification of images as seen in (B) showing the frequency of CD206 positive TAMs.
Figure S5 – Related to Figure 2 A
B
Control
CD68 Endo
20
*
Endo VEGFA
CD68 Endo VEGFA
* d9 /1 0
0
c
D4
40
d6 /7
CD68 Endo VEGFA
ns
60
d3 /4
Endo VEGFA
ns
80
d1
CD68 Endo
VEGF+/CD68+ % perivascular
%VEGF+ TAMs perivascular 100
C
D7 proportion VEGF+/CD68+
Endo VEGFA
CD68 Endo VEGFA
D10
ns
0.4 0.2
*
*
Endo VEGFA
d9 /1 0
d6 /7
d3 /4
0.0 c
CD68 Endo
ns
0.6
d1
CD68 Endo
ratio VEGF+/CD68+
0.8
CD68 Endo VEGFA
D
CD68 Endo
Lyve CD68 Endo
Lyve CD68 Endo DAPI
Figure S5– Additional marker stainings of macrophage depletion experiments – related to Figure 2. (A) IF imaging of MaFIA tumor sections at different times after the final b/b treatment. TAMs are visualized with CD68 (green), VEGFA (red) and blood vessels with endomucin (cyan), nuclei are stained with DAPI (blue), scale bar is 25μm. (B) Quantification of images as seen in (E) showing the % of perivascular TAMs that are also VEGFA positive. (C) Quantification of images as seen in (E) showing the frequency of VEGFA positive TAMs. (D) IF imaging of PyMT tumor sections. TAMs are visualized with CD68 (yellow), lymphatic vessels with lyve-1 (cyan) and blood vessels with endomucin (magenta), nuclei are stained with DAPI (grey), scale bar is 25μm
Figure S6 – Related to Figure 3
A
B
Figure S6 – Exemplar flow cytometry of CCR2 WT and KO adoptive transfer – related to Figure 3. (A, B) Representative logarithmic contour FACS plots used in the analysis of the adoptive transfer experiments with CCR2KO and WT monocytes in tumor (A) or bone marrow (B). Gated on alive, singlets, CD45+, CD11b+ cells. Horizontal axis shows CellTrace Violet, while vertical axis shows CSFE intensity.
Figure S7 – Related to Figure 4 A
C
D
B
Vimentin
CXCL12 Vimentin
CXCL12
!SMA CXCL12
CXCL12
CXCL12 Vimentin
!SMA
Endo !SMA CXCL12
CXCL12 !SMA Vimentin
Desmin
CXCL12
CXCL12
CXCL12 !SMA Vimentin
Vimentin
!SMA
Endomucin CXCL12 Desmin
Figure S7 – Stromal fibroblasts, not pericytes are expressing CXCL12 – related to Figure 4. (A) IF imaging of PyMT tumor sections. Fibroblasts are visualized with vimentin (green), CXCL12 (red) and nuclei are stained with DAPI (blue), scale bar is 25μm. White arrows show co-localization of CXCL12 with vimentin, while blue arrows show CXCL12 positive cells that are not vimentin positive. (B) IF imaging of PyMT tumor sections. Fibroblasts are visualized with aSMA (red), CXCL12 (green), endothelial cells with endomucin (cyan) and nuclei are stained with DAPI (blue), scale bar is 25μm. White arrows show a slight co-localization of CXCL12 with aSMA, while blue arrows show CXCL12 positive cells that are not vimentin positive. (C) low powered IF image of PyMT tumor section stained with CXCL12 (cyan), aSMA (yellow) and vimentin (magenta) and DAPI in (grey), white arrows indicate CXCL12 CAFs that are double positive for vimentin and aSMA, while green arrow show CXCL12 CAFs that are single positive for either vimentin or aSMA. Scale bar is 25μm. (D) IF staining of a PyMT section. Pericytes are visualized with Desmin (green) CXCL12 (red) and blood vessels with endomuscin (cyan). Scale bar is 25μm