A-UNIFAC Modeling of Binary and Multicomponent Phase Equilibria of Fatty Esters+Water+Methanol+Glycerol N. Garridoa, O. Ferreirab, R. Lugoc, J.-C. de Hemptinnec, M. E. Macedoa, S.B. Bottinid,* a Department of Chemical Engineering, FEUP, University of Porto, Porto, Portugal b Departamento de Tecnologia Química e Biológica - Instituto Politécnico de Bragança, Campus de Santa Apolónia, Ap. 1134 5301-857 Bragança, Portugal c Institut Français du Pétrole – Direction Chimie et Physico-Chimie Appliquées, 1 & 4 av de Bois Préau, 92852 Rueil Malmaison, France d Planta Piloto de Ingeniería Química – PLAPIQUI, Universidad Nacional del Sur, Camino La Carrindanga Km 7.5 – CC 717, Bahía Blanca, Argentina Corresponding author: Tel.: +54 2914861700; fax: +54 2914861600; E-mail address:
[email protected] (S.B. Bottini) Keywords: thermodynamic modeling, A-UNIFAC, biodiesel
Abstract The production of methyl and ethyl esters of fatty acids is of great industrial interest, considering the direct application of these esters as biodiesel. Prediction of the phase behaviour of mixtures containing fatty esters, alcohols, glycerol and water is of utmost importance for the design and optimization of biodiesel purification and by-products recovery processes. In this work we show the capability of A-UNIFAC to correlate and predict the phase behaviour of these mixtures. This GE model is an extension of UNIFAC that explicitly includes association effects between groups, based on the statistical Wertheim theory [1]. A-UNIFAC with the final set of parameters is able to predict with good agreement experimental data on binary and ternary liquid-liquid equilibria of glycerol, methanol and fatty esters as well as infinite dilution activity coefficient for these systems. Additionally, satisfactory results are obtained for the prediction of liquid-liquid equilibrium of binary mixtures containing water and fatty acid esters. 1. Introduction Biodiesel can be prepared by transesterification of triglycerides with an excess of alcohol, to produce methyl or ethyl esters of fatty acids and glycerol. After reaction, several separation processes are required for the purification of biodiesel and the recovery of by-products. Knowledge of phase equilibria of the reactive mixture comprising fatty esters, alcohols, glycerol and water is therefore essential for the design and optimization of these processes. Considering the presence of several hydrogen bonding components, the associating AUNIFAC activity coefficient model is applied to describe binary and ternary liquid-liquid equilibria (LLE) of glycerol, methanol and fatty acid esters mixtures, as well as LLE of water and methyl esters. The parameterization methodology is described in section 3 and the results obtained are shown and discussed in section 4. The main conclusions are finally presented in section 5. 2. A-UNIFAC model
Mengarelli et al. [1] have proposed a modified UNIFAC model that takes into account association effects. This GE model adds a group-contribution association term to the original UNIFAC combinatorial and residual expressions (Fredenslund et al., 1975). The association term is based on Wertheim’s theory for fluids with highly directed attractive forces [2]. The general expression for the association contribution to the activity coefficient is a function of the fraction of non-bonded sites in the solution ( X Ak ) and in pure-component i ( X iAk ):: ln γ iassoc =
NGA k =1
ν ki
ln Ak
X Ak X iAk − 1 + + ri ρ k X iAk 2
Ak
1 − X Ak 2
(1)
In this equation ν ki is the number of groups of type k in a molecule of component i, ρj represents the density of associating group k in the mixture and ri represents the UNIQUAC molecular volume of species i (evaluated from UNIFAC group volume parameters Rk in the usual way; i.e. summation over all NG groups within molecule i: ri =
NG k =1
ν ki Rk ). The
summation in eq. (1) extends to all NGA associating groups and Ak associating sites. The fraction of non-bonded sites X Ak is a function of the associating group density ρj and the A B association strength ∆ k j between site A of group k and site B of group j . This fraction is given by the following expression [1]: 1 X Ak = (2) NGA Ak B j Bj 1+ ρ j∆ X j =1 B j
A similar equation is applied to caculate the fraction of non-bonded sites in pure component i: 1 X iAk = (3) NGA Bj Ak B j 1+ ( ρ j )i ∆ X i j =1 B j
In these equations ρ j and (ρ j )i represent the density of associating group j in the mixture and in pure associating component i, respectively, evaluated through the value of the UNIQUAC molecular volume of specie i: NC
ρj =
ν ij xi
i =1 NC
i =1
(ρ )
=
(4) ri xi
ν ij
(5) ri where xi is the mole fraction of component i in the mixture. The densities calculated by the last equations are dimensionless and characterize the concentration of associating group j in the solution and in pure component i. AB AB The association strength ∆ k j is a function of two association parameters: the energy ( ε k j ) AB and volume ( κ k j ) of association. A B A B A B ∆ k j = κ k j [exp( ε k j / kT ) − 1] (6) j i
3. Model Parameterization 3.1 Association parameters Association effects in methanol, water and glycerol are represented by the same hydrogenbonding hydroxyl group (OH) having two associating sites (one electronegative O and one electropositive H). There is one associating group in methanol and water and three in glycerol. Group CCOO in fatty esters can cross-associate with the electropositive site of the hydroxyl OH group. The values for the hydroxyl (OH) and ester (CCOO) self- and cross-association parameters were already available [3] and are presented in Table 1. Table 1. Energy /k and volume association parameters for the A-UNIFAC model [3]
κ
/k (K) Self-association OH Cross-association OH – CCOO
3125.0 1975.0
0.0062 0.071
3.2 Residual interaction parameters The introduction of an association contribution to the activity coefficient, makes it necessary to determine a new set of parameters for the interaction between associating and nonassociating functional groups. The residual parameters for the interactions between water and ester functional groups were previously estimated using low-pressure VLE data and infinite dilution activity coefficienta γ ∞ in binary mixtures of esters and water [3]. For the quantification of the residual non-idealities, both methanol and glycerol molecules are represented by the molecular groups CH3OH and C3H8O3. The residual interaction parameters between CH3OH and C3H8O3 were obtained by fitting isothermal liquid-liquid equilibrium data on the ternary system dodecanoic acid methyl ester-methanol–glycerol [4]. The glycerol/paraffin (C3H8O3/CH2) and glycerol/ester (C3H8O3/CCOO) interaction parameters were estimated from experimental data on liquid-liquid equilibria and γ ∞ of the binary systems dodecanoic acid methyl ester (DAME)-glycerol and hexanoic acid methyl ester (HAME)-glycerol in the range of 320 K to 438 K [4]. The residual group interaction parameters used in this work are reported in Table 2. Table 2. Residual group interaction parameters am,n (K) for the A-UNIFAC model
m CH2 C3H8O3 CH3OH CCOO H2O
CH2 0.0 -51.2c -19.78b 114.8a 136.8b
C3H8O3 c
101.5 0.0 427.6e 20.0c n.a.
n CH3OH b
122.7 -193.6e 0.0 18.49d 251.2b
CCOO a
232.1 886.3c 200.2d 0.0 150.3b
H2O 380.5b n.a. -167.6b -72.73b 0.0
a: original UNIFAC parameters [5]; b: [3]; c: [6]; d: [7]; e: this work; n.a.: not available.
4. Results and discussion In this section several correlation and prediction results are presented.
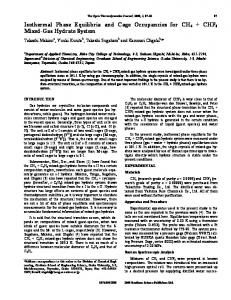
4.1 Binary systems of esters and water An important biofuel quality parameter is its maximum water content. Thus, the correct description of the solubility of water in fatty acid esters is of major importance during production and storage of biodiesel.
T/K
The A-UNIFAC model has been previously applied to describe low pressure VLE data and γ ∞ of binary systems of water and short-chain esters [3]. In this work the same association and residual parameters are used to predict liquid-liquid equilibrium of water and several fatty acid esters. Figures 1 and 2 show that A-UNIFAC predictions are in good agreement with the experimental information available.
420
390
390
T/K
420
360
360
330
330
300 0.E+00
300 0.80
2.E-05 3.E-05 x ester
5.E-05
0.85
0.90 x ester
0.95
1.00
Figure 1. Liquid-liquid equilibrium of octanoic acid methyl ester + water: A-UNIFAC predictions (solid lines) and experimental data (symbols) [4].
0.07
methyl hexanoate methyl heptanoate methyl octanoate
0.06
methyl tetradecanoate methyl octadecanoate
x water
0.05
methyl dodecanoate
0.04 0.03 0.02 0.01 285
295
305
315
325
335
345
T/K
Figure 2. Water solubility in several fatty methyl esters: A-UNIFAC predictions (solid lines) and experimental data (symbols) [8].
4.2 Binary systems of esters and glycerol
500
500
450
450 T/K
T/K
Figures 3-8 compare experimental data [4] with A-UNIFAC correlation of liquid-liquid equilibrium and infinite dilution activity coefficients of the system ester / glycerol.
400 350
350
300
300 0.980 0.985
0
0.01 0.02 0.03 0.04 0.05 x glycerol
0.990 0.995 x glycerol
1.000
Figure 4. Comparison between A-UNIFAC correlated (solid lines) and experimental (symbols) solubility of HAME in glycerol phase.
500
500
450
450 T/K
T/K
Figure 3. Comparison between A-UNIFAC correlated (solid lines) and experimental (symbols) solubility of glycerol in HAME phase.
400
400
350
350
300
300 0.980 0.985 0.990 0.995 1.000 x glycerol
0
0.01 0.02 0.03 0.04 0.05 x glycerol
Figure 5. Comparison between A-UNIFAC correlated (solid lines) and experimental (symbols) solubility of glycerol in DAME phase.
γ∞
400
15000
Figure 6. Comparison between A-UNIFAC correlated (solid lines) and experimental (symbols) solubility of DAME in glycerol phase.
γ∞
12000
160 120
9000
80
6000
40
3000 0 370
390
410 T/K
430
0 370
450
Figure 7. Comparison between A-UNIFAC correlated (solid lines) and experimental (symbols) infinite dilution activity coefficients of DAME in glycerol.
390
410 T/K
430
450
Figure 8. Comparison between A-UNIFAC correlated (solid lines) and experimental (symbols) infinite dilution activity coefficients of glycerol in DAME.
4.3 Ternary systems of esters, methanol and glycerol
The A-UNIFAC model with the parameters listed in Tables 1 and 2 was used to calculate the fluid phase equilibrium boundaries of fatty acid methyl ester-methanol-glycerol mixtures at several temperatures [4,6]. Table 3 reports the mean standard deviations in the calculation of methanol distribution coefficients by the A-UNIFAC model. The distribution coefficient was defined as the ratio between the methanol mole fraction in the fatty acid methyl ester and glycerol phases. Table 4 gives the mean and maximum absolute differences between calculated and experimental molar fractions of glycerol in the fatty ester phase and molar fractions of fatty ester in the glycerol phase. Table 3. Mean standard deviations in the calculation of methanol distribution coefficients by the A-UNIFAC model Standard Deviations % (*) 12.73 6.13 16.36
System HAME – glycerol – methanol DAME – glycerol – methanol Methyl oleate (MO) – glycerol – methanol (*)
= 100 ×
[(
−
]2
)
; NP = number of experimental points
Table 4. Absolute deviations between calculated and experimental mole fractions of diluted components using A-UNIFAC System
Mol fraction of glycerol in the fatty ester rich phase
HAME + methanol + glycerol DAME + methanol + glycerol MO + methanol + glycerol
Mean difference 0.0384 0.0179 0.0050
Maximum difference 0.1064 0.0388 0.0381
Mol fraction of fatty ester in the glycerol phase Mean difference 0.0084 0.0080 0.0056
Maximum difference 0.0368 0.0154 0.0111
Figures 9 to 12 compare experimental data with A-UNIFAC calculations. xXmethanol Methanol 0.0 1.0 T=333.5K
0.2 0.4
0.8
Kmethanol K meth
0.4
0.8
X Glycerol x glycerol
0.7
0.6
0.6
1.0 0.0
1 0.9
0.8
0.2
0.6 0.5 0.4 0.3 0.2
T=333.5K
T=352.8K
0.1 0
0.2
0.4
0.6
0.8
1.0
0.0
HAME xXHAME
0
0.1
0.2
0.3
0.4
0.5
X methin HAME phasephase x methanol HAME
0.6
Figure 9. Comparison between A-UNIFAC predicted (solid lines) and experimental (dashed lines) [4] tie-lines of the ternary system HAME-methanol-glycerol at 333.5 K.
Figure 10. Comparison between A-UNIFAC predicted (solid lines) and experimental (symbols) [4] distribution coefficients of methanol in ternary system HAMEmethanol-glycerol.
xXmethanol Methanol 0.0 1.0 T=313.15K
0.2
0.8
0.4 0.6
0.4
0.8 1.0 0.0
Glycerol xX glycerol
Kmethanol K methanol
0.6
0.2
0.2
0.4
0.6
0.8
1.0
0.0 MO xX MO
Figure 11. Comparison between A-UNIFAC predicted (solid lines) and experimental (symbols) [6] distribution coefficients of methanol in ternary system MO-methanolglycerol at 313.15 K.
0.9 0.8 0.7 0.6 0.5 0.4 0.3 0.2 0.1 0.0
T=313K
0.0
0.1
T=333KC
0.2
0.3
0.4
T=353K
0.5
X methin MOMO phase x methanol phase
0.6
0.7
Figure 12. Comparison between A-UNIFAC predicted (solid lines) and experimental (symbols) [6] distribution coefficients of methanol in ternary system MO-methanolglycerol.
5. Conclusions The A-UNIFAC model gives a good representation of the liquid-liquid equilibria of mixtures containing glycerol, methanol and fatty esters as well as infinite dilution activity coefficients in these systems. This group-contribution model can be further extended to describe the phase equilibria of multicomponent mixtures of interest in biodiesel production.
References [1] A.C. Mengarelli, E.A. Brignole, S.B. Bottini, Fluid Phase Equilib. 163 (1999) 195-207. A. Fredenslund, R.L. Jones, J.M. Prausnitz, AIChE. J. 21 (1975) 1086-1099 [2] M. Wertheim, J. Stat. Phys. 35 (1984) 19. [3] O. Ferreira, E.A. Macedo, S.B. Bottini, Fluid Phase Equilibria 227 (2005) 165-176. [4] F.M. Korgitzsch, Study of Phase Equilibria as a Fundament for the Refinement of Vegetable and Animal Fats and Oils. Ph.D. Dissertation, TU Berlin, 1993. [5] J. Gmehling, P. Rasmussen, A. Fredenslund, Ind. Eng. Chem. Process Des. Dev. 21 (1982) 118–127. [6] A.E. Andreatta, L.M. Casás, P. Hegel, S.B. Bottini, E.A. Brignole, Ind. Eng. Chem. Res. 47 (2008) 5157-5164. [7] L.M. Casás, B. Orge, O. Ferreira, J. Chem. Eng. Data 53 (2008) 89–93. [8] M.B. Oliveira, F.R. Varanda, I.M. Marrucho, A.J. Queimada, J.A.P. Coutinho, Ind. Eng. Chem. Res. 47 (2008) 4278–4285.