www.sciedu.ca/air
Artificial Intelligence Research
2014, Vol. 3, No. 3
ORIGINAL RESEARCH
A unified approach to content-based indexing and retrieval of digital videos from television archives Celso L. Souza1 , Flávio L. C. Pádua∗2 , Cristiano F. G. Nunes2 , Guilherme T. Assis3 , Giani D. Silva4 1
Department Department 3 Department 4 Department 2
of of of of
Computer Science, Instituto Federal do Sudeste de Minas Gerais, São João del-Rei, Brazil Computing, Centro Federal de Educação Tecnológica de Minas Gerais, Belo Horizonte, Brazil Computing, Universidade Federal de Ouro Preto, Ouro Preto, Brazil Languages, Centro Federal de Educação Tecnológica de Minas Gerais, Belo Horizonte, Brazil
Received: July 30, 2014 DOI: 10.5430/air.v3n3p49
Accepted: August 24, 2014 Online Published: September 4, 2014 URL: http://dx.doi.org/10.5430/air.v3n3p49
Abstract This work addresses the development of a unified approach to content-based indexing and retrieval of digital videos from television archives. The proposed approach has been designed to deal with arbitrary television genres, making it suitable for various applications. To achieve this goal, the main steps of a content-based video retrieval system are addressed in this work, namely: video segmentation, key-frame extraction, content-based video indexing and the video retrieval operation itself. Video segmentation is addressed as a typical TV broadcast structuring problem, which consists in automatically determining the boundaries of each broadcasted program (like movies, news, among others) and inter-program (for instance, commercials). Specifically, to segment the videos, Electronic Program Guide (EPG) metadata is combined with the detection of two special cues, namely, audio cuts (silence) and dark monochrome frames. On the other hand, a color histogram-based approach performs key-frame extraction. Video indexing and retrieval are accomplished by using hashing and k-d tree methods, while visual signatures containing color, shape and texture information are estimated for the key-frames, by using image and frequency domain techniques. Experimental results with the dataset of a multimedia information system especially developed for managing television broadcast archives demonstrate that our approach works efficiently, retrieving videos in 0.16 seconds on average and achieving recall, precision and F1 measure values, as high as 0.76, 0.97 and 0.86 respectively.
Key Words: Television archives, Content-based video retrieval, TV broadcast structuring, Video indexing
1
Introduction
Over the years, the television production and distribution has shifted from a linear and analog process based on physical media to another one that is mostly digital, which allows a programmable and nonlinear access to television content.[1] In this scenario, huge digital video archives have been created by television companies, supporting for example, producers to store and edit new video productions, reporters to search relevant videos to re-use as background information and media researchers to investigate aspects of what has been broadcast.[2] Those video archives represent a vital component of the world’s heritage and when combined with novel comput-
ing technologies have contributed to conceive new services around television and video platforms, such as Interactive TV[3] and Internet Television.[4–6] Specifically, when the Internet environment is considered, some challenging aspects must be faced with respect to procedures to highlight and share program-related materials, as well as the inclusion of user-generated content. A critical task in all of those applications consists in to manage video content as an information resource, receiving significant attention from both industry and academia and that demands on structuring, analysis, summarizing, indexing and searching methods.[7] As a step toward this goal, we present a unified approach to content-based index-
∗ Correspondence: Flávio L. C. Pádua; Email:
[email protected]; Address: Departamento de Computacao, Centro Federal de Educação Tecnológica de Minas Gerais, Av. Amazonas, 7675, Zip Code: 30.510-000, Belo Horizonte, Brazil.
Published by Sciedu Press
49
www.sciedu.ca/air
Artificial Intelligence Research
2014, Vol. 3, No. 3
ing and retrieval of digital videos from television archives. The attribute “unified” refers to the ability of the proposed approach to deal with arbitrary television genres, covering all the main steps of a content-based video retrieval system, namely: video segmentation, key-frame extraction, contentbased video indexing and the retrieval operation itself.
herent structure of scenes and shots in narratives of movies and TV shows. Dialog patterns are modeled by using multiple shot threads, which are together with a contextual visual dynamics embedded into a unified framework to capture the video hierarchy. Experiments were performed on datasets of a popular TV show, demonstrating the accuracy [16] present an The literature on content-based video retrieval and its evalu- of the proposed solution. Manson & Berrani automatic system, named DealTV, for TV broadcast strucation is vast and impossible to cover here completely. Some turing. The proposed system performs the segmentation of authors classify the research on this topic in three fundathe TV stream and classifies the segments by using an inmental areas, namely, video analysis, video abstraction, and video retrieval.[8–11] Although a lot of efforts have been de- ductive logic programming-based technique. The system voted into these three areas, both the computational cost and was evaluated by using a dataset containing real TV broadthe accuracy of the existing systems are still far from satis- cast collected from a French channel over two weeks. The factory. A common problem is that in a general setting, the authors report an average precision of 0.98 for the segment [17] low-level features do not have a direct link to high-level con- classification using the ILP-based technique. The authors cepts. This raises the question: how this semantic gap can propose a multimodal scheme to segment and represent TV video streams. In terms of visual analysis, they have debe bridged? veloped a concept named program-oriented informative imVideo analysis addresses the extraction of visual features, age (POIM) to identify the candidate points correlated with such as color, texture, shape and salient points, as performed the boundaries of individual programs. Regarding audio in Refs. 12-14, to cite just a few. In Ref. 12, for example, analysis, a multiscale Kullback–Leibler (K–L) distance is the authors present an automatic video genre classification proposed to locate audio scene changes. The proposed apsystem for classifying the types of TV programs, based on proach has achieved a precision of 0.89 and a recall of 0.93 several low level audio-visual features, such as, color, tex- on average. In Ref. 18, the authors present an advertisement ture, signal energy and mel-frequency cepstral coefficients, detector system that automatically detects the commercial as well as cognitive and structural information derived from breaks from the bitstream of digitally captured television faces and video shots. The proposed system was evaluated broadcasts. Basically, they propose an approach that deusing TV programs from Italian and French TV channels, tects groups of black-frames and audio-depressions, which achieving an overall accuracy as high as 94.5%. Dhöring & contribute to identify advertisement breaks. The Discrete Lienhart[13] propose a real-time technique for mining TV Cosine Transform (DC-DCT) coefficients of the frames are broadcasts for recurring video sequences. The proposed analyzed to determine if they could be classified as ‘black’ technique is specially applied to log broadcast commercials ones. The proposed system was evaluated using 10 clips fully automatically. An inverted index is used to identify comprising 315 minutes of digital video and containing similar frames and, in this case, images are mapped to the 11 ad-breaks, achieving a recall as high as 98%. In the index by estimating a gradient-based image feature, which present work, video abstraction is performed for TV broadin turn is mapped to the index via a hash function. This ap- cast structuring and summarization. To achieve this goal, a proach is similar to the one proposed in the present work, similar strategy to the one presented in Ref. 18 is applied, where video indexing is accomplished by using a hashing that is, segmentation cues (e.g., black frames and silence method. The authors[14] propose a framework for analysis segments) are determined, which are further combined with and summarization of soccer videos using cinematic and the information provided by the electronic program guide object-based features. The framework includes low-level (EPG), resulting in an accurate and efficient method. algorithms, such as dominant color region detection and robust shot boundary detection, as well as some higher-level Finally, the third area is video retrieval, which is based on algorithms for goal and penalty box detection. Experiments the extracted metadata and allows users to query and search were conducted over a data set, consisting of more than 13 the video database.[19–21] In this context, Huurnink et al[19] hours of soccer video. As proposed in Refs. 12, 13, visual have investigated how content-based video search can ensignatures are estimated in this work containing color, shape hance the performance of traditional archive retrieval and and texture information for representing the key-frames of propose an evaluation methodology related to the needs and video recordings, by using image and frequency domain circumstances of the audiovisual archive considered. To techniques. achieve this goal, the authors use logged searches, content Video abstraction, in turn, refers to the representation of visual information, by applying, for instance, key-frame detection and shot clustering techniques.[15–18] The information content extracted from video analysis and abstraction processes are usually referred to as metadata. In Ref. 15, the authors propose a probabilistic framework to recover the in50
purchases, session information, and simulators to create realistic query sets and relevance judgments. Methods are presented for reconciling retrieval on information sources at different levels (shot-level and program-level). The authors report that combining catalog-based video search with content retrieval search more than doubled the shot retrieval ISSN 1927-6974
E-ISSN 1927-6982
www.sciedu.ca/air
Artificial Intelligence Research
performances. On the other hand, Jeong et al[20] present an automatic video annotation technique, which employs ontologies to facilitate the video retrieval and sharing process in the smart TV environment. Moreover, the authors propose video concept detection approaches using semantic inference rules and SVM classifier for video search, sharing, and browsing. The proposed system was evaluated using parts of National Geographic videos, achieving average recall and precision values as high as 80%. In Ref. 21, the authors present the Físchlár system, which automatically indexes broadcast television content for subsequent non-linear browsing. Several video indexing tools are applied, such as shot boundary detection, key-frame extraction, shot clustering and news story segmentation. The Físchlár system has inspired the development of a similar tool, named SAPTE (Sistema de Apoio a Pesquisas sobre Televisão) at the Research Center on Television at Federal Center of Technological Education of Minas Gerais in Brazil,[22] which has incorporated the proposed approach in this work. The remainder of this paper is organized as follows. Section 2 covers the proposed approach to content-based indexing and retrieval of television broadcast archives. Experimental results are presented in Section 3, followed by the conclusions and discussion in Section 4.
2
The proposed approach
This section describes the proposed approach for contentbased indexing and retrieval of digital videos from television
2014, Vol. 3, No. 3
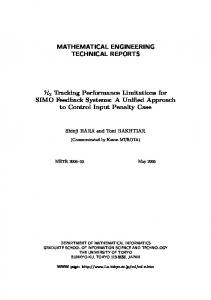
archives, which is divided in four main steps, as illustrated in Figure 1. The first step consists in to automatically recover the structure of the TV stream, which corresponds to a full-day TV schedule (24-hour recording). This is generally referred to as TV broadcast structuring or TV broadcast segmentation. As a result of this step, all TV program and interprogram blocks are properly segmented and stored in the SAPTE video database.[22] In this work, a program block represents a segment of the complete program, usually, broadcasted between commercial breaks. Similarly, an inter-program block corresponds to a specific part of a commercial break. The second step consists in to summarize the videos of TV programming blocks, by extracting key-frames, which represent salient and most informative contents. Depending on the content complexity of a video, one or more key-frames can be extracted. The use of key-frames greatly reduces the amount of data required in video indexing and provides an organizational framework for dealing with video content. In the third step, the proposed approach performs the indexing of each video segment, by computing visual signatures or content-based indexes for each key-frame extracted. Those visual signatures are based on color, shape and texture information and are stored in the index database of SAPTE.[22] Finally, the fourth step consists in to retrieve the videos of interest by using image queries, that is, a content-based video retrieval approach. The four steps aforementioned are described in the following.
Figure 1: Overview of the proposed approach for content-based retrieval of videos from television archives.
Published by Sciedu Press
51
www.sciedu.ca/air
Artificial Intelligence Research
2.1 TV broadcast structuring The first step of the proposed approach consists in automatically determining the boundaries (i.e., the start and end) of each broadcasted program (movies, news, series, among others) and inter-program (commercial breaks) of a fullday TV schedule. Towards this aim, segmentation cues are determined, specifically, audio cuts (silence segments) and dark monochrome frames, which are combined with the information provided by the electronic program guide (EPG), resulting in an accurate and efficient method. The result of the TV broadcast segmentation step consists in two main video sets P and C: P = {pji |i = 1 · · · n, j = 1 · · · mi },
(1)
C = {cui |i = 1 · · · n, u = 1 · · · ki }.
(2)
The set P represents the complete list of program blocks broadcasted, where pji represents the j-th block of the i-th program, n represents the total number of programs and mi represents the total number of blocks of the i-th program. On the other hand, the set C represents the interprogram blocks, where cui represents the u-th block of the commercial break broadcasted during the i-th program and ki represents the total number of blocks of the corresponding commercial break. The TV broadcast structuring step starts by extracting the EPG metadata, as well by detecting depressions (silence) in the audio volume and dark monochrome frames in the
2014, Vol. 3, No. 3
video recording, which are common practices used by TV stations to separate program blocks. EPG metadata includes different kinds of information about TV programs, such as, title, genres, cast, date, time and the channel on which the program is broadcasted. To obtain the EPG information, a script has been implemented according to the guidelines provided by the Brazilian standard ABNT NBR 15604, which describes the functions and features of receivers for the Brazilian Digital Television System. On the other hand, to detect dark monochrome frames, we apply the video filter provided by the FFmpeg multimedia framework,[23] while to detect silence segments, we measure the energy level of the audio signal by calculating its root mean square (RMS) within a frame (signal volume), by using Equation (3): v u N −1 u1 X s2 (i), vf = t N i=0 f
(3)
where vf , N and sf (i) denote the signal volume, the number of samples and the i-th sample of the frame f , respectively. If the energy level of a frame is lower than a predetermined threshold, we consider it as a potential silence segment. As proposed by Coimbra & Goularte,[24] we consider the value for that threshold as -60 dB. Moreover, as the length of silence segments is variable, it is important to define a minimum length to avoid false positives. Therefore, as proposed by Wang et al,[17] we consider only silence segments lasting for at least 0.3s.
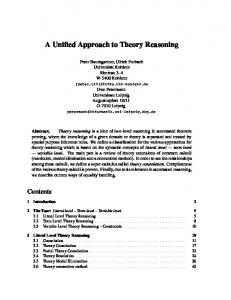
Figure 2: The TV broadcast structuring step. In order to perform the TV broadcast structuring, a threestep algorithm is applied. Firstly, the boundaries of each broadcasted program and inter-program, provided by the EPG, are refined (or corrected), by using the temporal co52
ordinates of the dark monochrome frames and silence segments detected, since EPG metadata are frequently imprecise and do not take into account late modifications of the TV schedule. ISSN 1927-6974
E-ISSN 1927-6982
www.sciedu.ca/air
Artificial Intelligence Research
Specifically, the program and inter-program boundaries are compared with the temporal coordinates of the detected cues, and, next, substituted by the temporally closest ones (either from the silence segment or from the dark monochrome frame). As a result, a more accurate EPG, here named EPG+, is obtained, as illustrated in Figure 3. The second step, in turn, consists in to determine the boundaries of each block of a program or inter-program, but now using the EPG+ information together with the temporal coordinates of the dark frames and silence segments detected between the start and end of the program or inter-program considered. The third and final step consists in to segment the video recording itself, considering the boundaries determined in the two previous steps. The resulting program and inter-program blocks are stored in the SAPTE video database.[22]
2.2 Video summarization The second step consists in to provide a succinct representation of the video data (TV programming blocks), contributing to efficient indexing and retrieval operations. A video summary must contain its most relevant content, avoiding any redundancy, but at the same time, preserving the original message of the video.[25, 26] In this scenario, the method proposed for this step consists in to find an appropriate set of key-frames that cover all significant events of the video, while minimizing redundancy of information, as illustrated
2014, Vol. 3, No. 3
in Figure 4. Basically, key-frame extraction is performed by measuring the similarity of color histograms of consecutive frames of the video of interest. Color histograms have been selected because of their simplicity and robustness to small changes in camera motion.[27] Therefore, our method provides a balance between computational complexity and the quality of results. In this work, we use the RGB color space for histogram computation. Importantly, the quantization of the color histogram of each component (R, G and B) is set to 16 bins. Next, those histograms are normalized in the range of 0–1 by dividing each value by the maximum value in the respective component. Finally, the three histograms are then combined to get a global histogram of size 48 for the frame. In order to measure the similarity between color histograms of two consecutive frames, we apply the Bhattacharyya distance,[28] whose effectiveness and robustness to noise in such a kind of application have been demonstrated, for instance, by Bhalerao & Rajpoot.[29] The Bhattacharyya distance between two color histograms is computed by Equation (4):
d(H1 , H2 ) =
p
1 − φ(H1 , H2 ),
(4)
where d(·) denotes the Bhattacharyya distance, H1 and H2 are the normalized color histograms and φ(·) is the Bhattacharyya coefficient, which is computed according to Equation (5):
Figure 3: Usage of dark monochrome frames and audio cuts (silence) to refine the EPG information. proportional to the Bhattacharyya coefficient. This means that the best match of histograms will result in a minimum [30] Considering that Bhattacharyya distance gives φ(H1 , H2 ) = H1 (i)H2 (i), (5) distance. a value between 0 and 1, the similarity of color histograms i=1 is more significant when the value is closer to zero. As where i indicates the bin index of the histogram being com- proposed by Chen et al,[31] we consider that two images pared and B is the number of bins. Note that the Bhat- under comparison are potential key-frames when the Bhattacharyya distance uses the correlation between the bin con- tacharyya coefficient φ(·) is larger than or equal to 0.9. tents as a measure of histogram similarity, being inversely B p X
Published by Sciedu Press
53
www.sciedu.ca/air
Artificial Intelligence Research
2014, Vol. 3, No. 3
After determining the potential key-frames by using the aforementioned methods, we finally apply the local feature descriptor SIFT[32] to detect and remove near-duplicate keyframe pairs, that is, key-frames that are similar or nearly duplicate of each other, but appear differently due to, for instance, variations introduced during acquisition time, lens setting, lighting condition and editing operation. Local feature descriptors have demonstrated to be a useful alternative for near-duplicate image detection.[33, 34] By using those methods, salient regions in each potential key-frame can be extracted with local point (key-point) detectors and their descriptors, which are mostly invariant to local transformations. Specifically, let k1 and k2 be the number of keypoints of frames 1 and 2, respectively. Those frames are considered near-duplicate or similar key-frames (redundant information), if the number of corresponding key-points between the two frames is larger than |k1 − k2 |. At the end of this process, we obtain a set of key-frames that succinctly represent the video under analysis.
in their databases.[2] In this scenario, content-based indexing approaches have been increasingly proposed, as alternative and promising solutions, which are based on the extraction of visual signatures for the key-frames of the videos of interest.[35, 36] Those visual signatures essentially serve as the index terms and are commonly composed by features such as color, texture, shape, salient points and sketch,[36] which have demonstrated to be very important cues. In this work, the visual signature of a key-frame is based on the combination of color, shape and texture information, being stored in the index database of the SAPTE system.[22] Regarding the color features extracted, we initially compute some low order statistical moments, specifically, the mean and standard deviation values for each color component in the RGB space, obtaining the partial color descriptor q in Equation (6):
2.3 Video indexing Television archives require efficient indexing to facilitate fast access to digital videos of broadcasted programs stored
where µR , µG and µB are the mean values and σR , σG and σB are the standard deviation values of color components R, G and B, respectively.
q = [µR
σR
µG
σG
µB
σB ],
(6)
Figure 4: The key-frame extraction approach used during the video summarization step. Next, we compute color histogram descriptors from the HSV color space, which are able to capture the color distribution with reasonable accuracy for search and retrieval applications. The HSV space was developed to provide an intuitive representation of color and to approximate the way in which humans perceive and manipulate color.[37] Specifically, three histograms are computed, namely, hH , hS and hV (one for each component H, S and V ), which are then quantized into 16 bins each and normalized in the range of 0–1. As a result, we obtain the color descriptor c in Equation (7), which contains a total of 54 elements: c = [q
hH
hS
hV ].
α1 = η20 + η02 ,
(8)
2 α2 = (η20 − η02 )2 + 4η11 ,
(9)
(7)
On the other hand, to extract shape features of a key-frame 54
we use the seven orthogonal invariant moment descriptors of second and third order proposed by Hu.[38] The first six descriptors encode shapes with invariance to translation, scale and rotation, while the seventh descriptor ensures skew invariance. Those seven moments are presented in Equations (8) to (14):
α3 = (η30 − 3η12 )2 + (3η21 − η03 )2 , ISSN 1927-6974
(10)
E-ISSN 1927-6982
www.sciedu.ca/air
Artificial Intelligence Research
α4 = (η30 + η12 )2 + (η21 + η03 )2 ,
2014, Vol. 3, No. 3
(11)
α5 = (η30 −3η12 )(η30 +η12 )((η30 +η12 )2 −3(η21 +η03 )2 )+(3η21 −η03 )(η21 +η03 )×(3(η30 +η12 )2 −(η21 +η03 )2 ), (12)
α6 = (η20 − η02 )((η30 + η12 )2 − (η21 + η03 )2 ) + 4η11 (η30 + η12 )(η21 + η03 ),
(13)
α7 = (3η21 −η03 )(η30 +η12 )((η30 +η12 )2 −3(η21 +η03 )2 )−(η30 −3η12 )(η21 +η03 )×(3(η30 +η12 )2 −(η21 +η03 )2 ), (14) where ηij is the central moment of order i + j of image f (x, y) with centroid coordinates (xc , yc ), given by: Z
∞
Z
∞
ηij = −∞
(x − xc )i (y − yc )j f (x, y)dxdy. (15)
−∞
As a result, we obtain the shape descriptor s in Equation (16), which contains a total of 7 elements:
s = [α1
α2
α3
α4
α5
α6
α7 ].
where µji and σij are the mean and standard deviation values, respectively, of the j-th sub-image (D, H and V ) of the i-th color component (R, G and B). As a final result, we obtain for each key-frame the visual signature w of Equation (19), which contains 79 elements (54 color features, 7 shape features and 18 texture features):
w = [c
s
t].
(19)
(16)
2.3.1 Indexing data structure Finally, the texture information present in the visual signa- In this work, we propose a k-d tree based indexing method ture of a key-frame is extracted from the energy distribution for video retrieval. In such a video indexing mechanism, a of wavelet coefficients in the frequency domain, by using the multidimensional tree structure is used,[40] where each node Discret Wavelet Transform (DWT) of Daubechies.[39] The stores an index term corresponding to the visual signature Daubechies wavelets are compactly supported orthonormal of a given key-frame, as illustrated in Figure 5. That viwavelets, which are usually denoted by DN , where N sual signature (or index term) defines a point in a Euclidean stands for the order of the wavelet. In this work, we have space. In fact, the k-d tree structure organizes indexes into chosen the Daubechies wavelet D4, which has four scaling k dimensions (a k-dimensional Euclidean space), where k is determined by the visual signature size. Since the comcoefficients that are presented in Equation (17): putational cost to store the k-d tree in main memory is high, we keep its efficiency by splitting it in T smaller parts (sub√ √ √ √ 1+ 3 3+ 3 3− 3 1 − 3 trees), which are stored in secondary memory. The basic √ , λ1 = √ , λ2 = √ , λ3 = √ λ0 = idea consists in to hash the visual signatures of key-frames 4 2 4 2 4 2 4 2 (17) so that the similar ones are mapped to the same subtree with high probability (the number of subtrees is much smaller Specifically, texture features are extracted from Daubechies than the universe of possible key-frames). The hash funcwavelet coefficients by means of a three-level decomposi- tion applied is based on the modular arithmetic and, differtion. In this scenario, each color component in the RGB ently from conventional applications of hash functions, aims space is decomposed into four sub-images, namely, approx- to maximize probability of collision of similar key-frames imation, horizontal, vertical and diagonal at initial scale, and rather than avoid collisions. This approach is similar to the [41] which, in many for the next two scale decompositions, each approximation well-known locality-sensitive hashing, ways, mirrors data clustering and nearest neighbor search. component is divided again into four new sub-images. AfThe insertion operation of an index term into the proposed ter the key-frame decomposition, we compute the mean and standard deviation values for the horizontal, vertical and di- k-d tree structure is presented in Algorithm 1. Initially, agonal sub-images of each color component, resulting in the the visual signature of the key-frame to be indexed is provided. Next, the address of the potential subtree where the texture descriptor t with 18 elements: key-frame’s visual signature should be inserted is computed by using a hash function. From this address and the keyt = {µji σij |i = {R, G, B} and j = {D, H, V }}, (18) frame’s signature w, a position p is estimated, which indiPublished by Sciedu Press
55
www.sciedu.ca/air
Artificial Intelligence Research
cates the potential node in the subtree where the signature w should be inserted. The next step consists in to access the node indicated by p and check whether it is free. If this is the case, the visual signature w is inserted in that node. Otherwise, w is inserted in the next available position sequentially.
2.4 Video retrieval Once the index terms of the videos have been obtained, a content-based retrieval strategy is performed. The proposed approach supports the query by example paradigm, where the user formulates a query by providing examples of images with semantic contents that are similar to the ones he/she expects to find in the key-frames of the videos he/she wants to retrieve. The main advantage of the query by example paradigm is that the user is not required to provide an explicit description of the videos of interest, which is instead computed online by the system. The system starts by converting the query image into a visual signature, according to the method described in Section 2.2. Next, by using the hash function proposed in Section 2.3, which is based on the modular arithmetic, the address of the subtree that contains the index terms of the potential videos of interest is estimated. Finally, the visual signature of the query image is compared with the visual signatures of the key-frames in the subtree analyzed.
2014, Vol. 3, No. 3
is the angle between their corresponding vectors in the Euclidean space. Inner products are recognized for their simplicity, low computational cost and the ability to produce good results in problems related to measuring image similarity.[36] For two similar images, cos θ ≈ 1 is expected, and, for two very different images, cos θ ≈ 0. A threshold δs is empirically established so that two images are considered similar if cos θ ≥ δs . Finally, a nearest neighbor search algorithm is applied to find the key-frames in the tree that are nearest to the query image, as illustrated in Figure 5. In this case, a search distance threshold δd is usually defined, which can metaphorically represent the radius of a sphere (search region) in the k-d tree space. This kind of search is more efficient since it eliminates large portions of the search space. The retrieved videos are presented in the descending order of similarity.
3
Experimental results
In order to demonstrate the advantages and limitations of the proposed approach, we performed three groups of experiments, which evaluate the methods for TV broadcast structuring, video summarization and content-based video indexing and retrieval. Those experiments were carried out using (i) a Dell OptiPlex 780 workstation with an Intel Core 2 Duo E7500 processor and 2 GB of main memory, running 64-bit Ubuntu OS 11.04, (ii) a device to capture the videos of programs broadcasted by the free-to-air Brazilian Rede Minas TV channel at Full HD (1920 × 1080) resolution and (iii) a Dell PowerVault NX3100 storage server with 2 Intel Xeon E5620 processors and 12×3 TB SAS disks assembled into a RAID 50 configuration for security and speed of access to data stored. Algorithm 1 Insertion of index terms into k-d tree Input Data: visual signature w. Begin address ← HASH function (w); read subtree(address); p ← SearchPosition(subtree(address), w); if p has element then p ← next empty position; end p ← w; End
Figure 5: k-d tree model used to store the index terms (visual signatures of key-frames). 3.1 TV broadcast structuring In this section, we evaluate the proposed method for TV broadcast structuring. The dataset used consists of a real TV broadcast collected from the free-to-air Brazilian Rede wq · wk = kwq k · kwk k cos θ, (20) Minas TV channel during a period of eleven days, totalizwhere wq and wk are the visual signatures of the query im- ing 244 hours of programs and interprograms (commercial age and key-frame under comparison, respectively, while θ breaks).
In this case, we use as similarity metric the well-known inner product, as defined in Equation (20):
56
ISSN 1927-6974
E-ISSN 1927-6982
www.sciedu.ca/air
Artificial Intelligence Research
In order to evaluate our solution, we have manually segmented and labeled the TV broadcast, obtaining 935 and 937 program and interprogram blocks, respectively. This has provided a ground-truth that has been used to compute evaluation metrics such as precision, recall and F1 measure. To the best of our knowledge, there is no available international corpus that can be used as a baseline for comparing different TV broadcast structuring methods. In this context, for example, the TREC Video Retrieval Evaluation (TRECVid) database only provides a corpus of already segmented TV programs, that is, it does not contain any continuously recorded TV broadcast over several days. In Table 1 we present the values of precision, recall and F1 measure obtained in this group of experiments. Note
2014, Vol. 3, No. 3
that our method has achieved the average F1 measure values of 0.92 and 0.93 with respect to the segmentation of programs and interprograms, respectively. The segmentation of program and interprogram blocks was accomplished with similar performance. The observed standard deviations values are low, indicating that the data are clustered closely around the mean and suggesting a reliable scenario. Only for the days 22/01/2012 and 30/01/2012, we have obtained F1 measure values lower than 0.90, what is justified by the severe changes in the broadcast programming, due to the transmission of soccer games, which were not originally planned. Those experimental results suggest that the proposed approach represents a simple and effective solution to the problem of TV broadcast structuring.
Table 1: Performance evaluation of the TV broadcast structuring method. Day (dd/mm/yyyy) 22/01/2012 23/01/2012 24/01/2012 26/01/2012 29/01/2012 30/01/2012 31/01/2012 01/02/2012 02/02/2012 03/02/2012 05/02/2012 Average Value Standard Deviation
3.2
Program Segmentation Precision Recall 0,82 0,81 0,97 0,91 0,99 0,98 1,00 0,99 0,90 0,91 0,84 0,82 0,93 0,93 0,93 0,93 0,94 0,95 0,95 0,94 0,94 0,94 0,93 0,92 0,06 0,06
Video summarization
The goal of the second group of experiments consists in to evaluate the accuracy of the proposed method for video summarization. The evaluation of a video summary is not a straightforward task, due to the common lack of an objective ground-truth. Therefore, to make this problem manageable, we use in this work the evaluation method proposed by Avila et al,[27] called Comparison of U ser Summaries (CUS), which is similar to the solution proposed in Ref. 42. According to the CUS method, the video summary is built manually in a preliminary step by a number of different users. Those users summaries, in turn, represent the groundtruth and are then compared with the summary obtained by the automatic method for video summarization. Color histograms are used to compare the key-frames of different summaries, whereas the distance among them is measured by Manhattan distance (the comparison threshold has been set to 0.5). The main goals of CUS are (i) to reduce the subjectivity of the evaluation task, (ii) to quantify the summary quality and (iii) to allow comparisons among different methods.[27] Our experiments have been performed on 50 videos selected Published by Sciedu Press
Interprogram Segmentation Precision Recall 0,89 0,90 0,98 0,95 0,96 0,95 0,97 0,96 0,91 0,92 0,93 0,91 0,94 0,94 0,93 0,92 0,95 0,92 0,95 0,93 0,91 0,91 0,94 0,93 0,03 0,02
F1 Measure 0,82 0,94 0,99 1,00 0,91 0,83 0,93 0,93 0,95 0,95 0,94 0,92 0,06
F1 Measure 0,89 0,96 0,95 0,97 0,91 0,92 0,94 0,92 0,94 0,94 0,91 0,93 0,02
from the Open Video Project.[43] Those videos are the same ones used by Avila et al[27] to evaluate their methodology for estimating static video summaries, named VSUMM, whose results are considered in this work as a baseline for comparison purposes. All videos are in MPEG-1 format (30 fps, 352 × 240 pixels) with a duration varying from 1 to 4 minutes. Additionally, the user summaries (ground-truth) are the same ones created in Ref. 27 by 50 users, specifically, 250 video summaries (5 different user summaries for each video). As proposed by Avila et al,[27] the quality of the automatically generated summary is measured by two metrics, namely, the accuracy rate α and the error rate ε, which are computed according to Equations (21) and (22): α=
na , nu
(21)
ε=
n ¯a , nu
(22)
where na is the number of matching key-frames from the 57
www.sciedu.ca/air
Artificial Intelligence Research
2014, Vol. 3, No. 3
automatic summary, n ¯ a is the number of non-matching keyframes from the automatic summary and nu is the number of key-frames from the user summary. The values for α range from 0 (no matchings between keyframes from automatic summary and user summary) to 1 (when all key-frames from user summary match key-frames from automatic summary). Importantly, α = 1 does not necessarily mean that all key-frames from automatic summary and user summary are matched. That is, if the number of key-frames from the user summary is smaller than the number of key-frames from automatic summary and α = 1, then some key-frames from automatic summary did not match.[27] Similarly, the values for ε range from na /nu (na is the number of key-frames from the automatic summary) to 0 (when all key-frames from automatic summary match key-frames from user summary). The accuracy rate α and the error rate ε are complementary metrics, so that, the highest summary quality occurs when α = 1 and ε = 0, which means that all key-frames from automatic and user summaries have been matched. In Table 2 we present the average accuracy rate α ¯ and average error rate ε¯, as well as their corresponding variances σα2¯ and σε2¯ , considering the application of our approach (described in Section 2.2), as well as the two slightly different versions of VSUMM, namely, VSUMM1 (one key-frame is selected per cluster) and VSUMM2 (one key-frame is selected per key-cluster, that is, a cluster whose size is larger than half the average cluster size).
based video indexing and retrieval. Specifically, 5,759 keyframes were extracted from the 90 program blocks by using the method described in Section 2.2, and subsequently stored and indexed by the k-d tree proposed in Section 2.3.
Table 2: Average accuracy rate α ¯ and average error rate ε¯, obtained for the proposed approach and VSUMM.
•Scenario 2: the query images belong to the image sequences of the videos considered, but are not key-frames. Similarly to scenario 1, 60 query images have been randomly selected from the videos, representing two-thirds of the dataset;
Metrics
2 2
Proposed approach
VSUMM1
VSUMM2
0.80
0.85
0.70
0.04
0.02
0.02
0.35
0.35
0.24
0.02
0.18
0.10
The results in Table 2 show that the proposed approach has a quite similar performance to VSUMM1 (similar α ¯ and the same ε¯) and a much better performance than VSUMM2 . Therefore, those results suggest that our approach represent a promising alternative to the problem of video summarization, specially, when considered its simplicity and efficiency.
3.3 Content-based video indexing and retrieval As a final experiment, we evaluated the proposed methodology for content-based video indexing and retrieval. In this case, we considered a dataset containing 90 videos (program blocks) of 11 different programs of the Brazilian Rede Minas TV channel (see Table 3). All those videos were previously stored and indexed at SAPTE system (Pereira et al, 2012), which has incorporated our approach for content58
Table 3: TV programs indexed at SAPTE system and used to evaluate the content-based video retrieval approach. Program name Cocoricó na Cidade Brasil das Gerais Catalendas Clube do Esporte Jornal Minas 1a Edição Jornal Minas 2a Edição Meu amigãozão Opinião Minas Repórter Brasil Repórter Eco Total
Number of blocks 2 7 5 1 19 21 1 2 27 3 90
Three main test scenarios have been defined: • Scenario 1: the query images are key-frames of the videos considered. In this scenario, 60 query images have been randomly selected from the whole set of key-frames (about 10%), considering the constraint that they should represent two-thirds of the dataset;
•Scenario 3: the query images do not belong to the image sequences of the videos in the dataset. Again, 60 query images have been defined. Importantly, those query images contain semantic contents, which were not observed in the image sequences of the dataset. For scenarios 1 and 2, the corresponding ground-truths were determined by visual inspection and further used to compute the evaluation metrics precision, recall and F1 measure. On the other hand, for scenario 3, we have not determined a ground-truth, since it was conceived under the perspective that no videos should be returned to the user when its query images were presented to the SAPTE system. In Table 4 we present the average values of precision, recall, F1 measure and search time, obtained for scenario 1, taking into account the variation of the search distance threshold δd of the k-d tree in interval [1, 240,001], and without performing the filtering process enabled by the similarity measurement between the visual signatures of the query image and key-frames in the k-d tree. ISSN 1927-6974
E-ISSN 1927-6982
www.sciedu.ca/air
Artificial Intelligence Research
Table 4: Average values of precision, recall, F1 measure and search time, obtained for scenario 1, taking into account the variation of the search distance threshold δd . d 1 20,001 40,001 60,001 80,001 100,001 120,001 140,001 160,001 180,001 200,001 220,001 240,001
Precision 1,0000 0,0987 0,0498 0,0432 0,0415 0,0411 0,0409 0,0409 0,0408 0,0408 0,0408 0,0408 0,0408
Recall 0,5456 0,9072 0,9852 0,9885 1,0000 1,0000 1,0000 1,0000 1,0000 1,0000 1,0000 1,0000 1,0000
F1 Measure 0,7060 0,1781 0,0947 0,0828 0,0797 0,0790 0,0786 0,0785 0,0785 0,0784 0,0784 0,0784 0,0784
Time (ms) 143 140 139 140 142 140 139 143 139 139 139 140 139
The ideal value for δd is the one that ensures a maximum
2014, Vol. 3, No. 3
recall (all relevant videos are returned to the user, given a specific query image) at a computational cost that does not compromise the method’s applicability in the context of the SAPTE system. From Table 4, we note that the maximum recall value (1.0) is firstly reached for δd = 80,001. Note that for different values of δd , there are no significant changes in the search time, suggesting that the computational cost of the method is independent of this parameter. Moreover, the values of precision and F1 measure are strongly affected by δd , stabilizing at about 0.041 and 0.080, respectively, for δd ≥ 80,001. Finally, the results in Table 4 demonstrate the importance of applying a similarity measurement between the visual signatures of the query image and key-frames in the k-d tree, in order to avoid the retrieval of irrelevant results, which strongly affect the precision and F1 measure values. Therefore, in order to evaluate the impact of such a filtering process, we have tested our approach with different values for the similarity threshold δs .
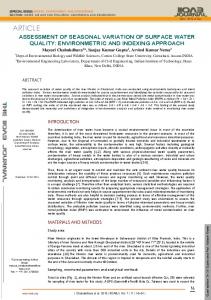
Figure 6: (a) Precision-recall curves and (b) F1 measure curves, varying the search distance threshold δd in interval [1, 100,001] and the similarity threshold δs in interval [0.94 0.99]. Specifically, we present in Table 5 and Figures 6(a) and 6(b) the average values of precision, recall, F1 measure and search time, for scenario 1, taking into account the variation of the similarity threshold δs in interval [0.94 0.99], which has been empirically determined as the one that produces the best retrieval results. Considering the F1 measure as our reference metric (the weighted harmonic mean of precision and recall), we may observe from Table 5 and Figure 6(b), that δs = 0.98 produces the best results, namely, 0.9711, 0.7644 and 0.8555 for precision, recall and F1 measure, respectively. In this case, the videos have been retrieved in 0.16 seconds on average.
note that the proposed approach can achieve good retrieval results, even when the query images are not key-frames, but are present in the image sequences of the videos of interest. For scenario 3, the queries did not return any videos, as expected, thus indicating the absence of videos in the dataset with key-frames that contain similar semantic contents.
4
Concluding remarks
This work presents a unified approach to content-based indexing and retrieval of digital videos from television archives. The number of research issues addressed in this Finally, the content-based retrieval approach was evaluated problem and their scope are very large and are expanding in scenarios 2 and 3. For those cases, we have considered rapidly with advances in computing and communication. δd = 80,001 and δs = 0.98. For scenario 2, we have obtained Nevertheless, the experimental results demonstrate that our the average values of 0.8414, 0.7484 and 0.7922 for pre- approach, which combines simple and efficient solutions, cision, recall and F1 measure, respectively. Therefore, we works successfully, retrieving videos of a television archive Published by Sciedu Press
59
www.sciedu.ca/air
Artificial Intelligence Research
2014, Vol. 3, No. 3
in about 0.16 seconds on average and achieving recall, precision and F1 measure values, as high as 0.76, 0.97 and 0.86 respectively.
by opening up their transaction logs and databases to study the valuable information inside. In this context, contentbased video retrieval and the television archive can mutually benefit from each other. Table 5: Average values of precision, recall, F1 measure and search time for scenario 1, considering δd = 80,001 and Future work includes (1) testing the approach on larger taking into account the variation of the similarity threshold datasets in order to better evaluate its scalability, (2) developing more compact visual signatures in order to reduce δs in interval [0.94 0.99]. the computational cost of the approach, (3) developing a Precision Recall F1 Measure Time (ms) s multimodel human-computer interface that can convey the 0.94 0.3570 0.9161 0.5137 159 query intentions more accurately and improve the accuracy 0.95 0.4959 0.8869 0.6361 157 of the retrieval results, (4) performing hierarchical analysis 0.96 0.7190 0.8542 0.7808 160 of video contents, building hierarchical semantic relations 0.97 0.8926 0.7978 0.8425 163 between scenes, shots, and key-frames, and (5) developing 0.98 0.9711 0.7644 0.8555 159 affective computing-based video retrieval methods. 0.99
0.9917
0.6942
0.8167
158
Acknowledgements We strongly recommend that television companies invest in embedding content-based video retrieval into their workflows. Television archives can not only profit from contentbased video retrieval results, but also contribute to research
References [1] Rubin, N. Preserving digital public television: Not just an archive, but a new attitude to preserve public broadcasting. Library Trends. 2009; 57(3): 393-412. http://dx.doi.org/10.1353/lib.0.0043 [2] Hollink, L., Schreiber, G., Huurnink, B., Van Liempt, M., de Rijke, M., Smeulders, A., Oomen, J., & de Jong, A. A multidisciplinary approach to unlocking television broadcast archives. Interdisciplinary Science Reviews. 2009; 34(2-3): 253-267. [3] Cesar, P., & Chorianopoulos, K. The evolution of TV systems, content, and users toward interactivity. Foundations and Trends in Human-Computer Interaction. 2009; 2(4): 373-95. [4] Abrahamsson, H., & Nordmark, M. Program popularity and viewer behaviour in a large tv-on-demand system. In Proceedings of the 2012 ACM conference on Internet measurement conference. 2012. (pp. 199-210). ACM. [5] Zeadally, S., Moustafa, H., & Siddiqui, F. Internet protocol television (IPTV): architecture, trends, and challenges. Systems Journal, IEEE. 2011; 5(4): 518-527. [6] Fontaine, G., Borgne-Bachschmidt, L., & Leiba, M. Scenarios for the internet migration of the television industry. Communicataions and Strategies. 2010; (77): 21-34. [7] Smeaton, A. F. Techniques used and open challenges to the analysis, indexing and retrieval of digital video. Information Systems. 2007; 32(4): 545-559. http://dx.doi.org/10.1016/j.is.2006.09.001 [8] Ren, W., Singh, S., Singh, M., & Zhu, Y. S. State-of-the-art on spatio-temporal information-based video retrieval. Pattern Recognition. 2009; 42(2): 267-282. [9] Snoek, C. G., & Worring, M. Multimodal video indexing: A review of the state-of-the-art. Multimedia tools and applications. 2005; 25(1): 5-35. [10] Antani, S., Kasturi, R., & Jain, R. A survey on the use of pattern recognition methods for abstraction, indexing and retrieval of images and video. Pattern recognition. 2002; 35(4): 945-965. [11] Dimitrova, N., Zhang, H. J., Shahraray, B., Sezan, I., Huang, T., & Zakhor, A. Applications of video-content analysis and retrieval. IEEE multimedia. 2002; 9(3): 42-55.
60
The authors gratefully acknowledge the financial support of FAPEMIG-Brazil under Procs. APQ-01180-10 and APQ02269-11; CEFET-MG under Procs. PROPESQ-088/12 and PROPESQ-076/09; CAPES-Brazil and CNPq-Brazil.
[12] Ekenel, H. K., & Semela, T. Multimodal genre classification of TV programs and YouTube videos. Multimedia tools and applications. 2013; 63(2): 547-567. [13] Döhring, I., & Lienhart, R. Mining tv broadcasts for recurring video sequences. In Proceedings of the ACM International Conference on Image and Video Retrieval (p. 28). ACM. 2009. [14] Ekin, A., Tekalp, A. M., & Mehrotra, R. Automatic soccer video analysis and summarization. Image Processing, IEEE Transactions on. 2003; 12(7): 796-807. [15] Liu, C., Wang, D., Zhu, J., & Zhang, B. Learning a Contextual Multi-Thread Model for Movie/TV Scene Segmentation. IEEE transactions on multimedia. 2013; 15(4): 884-897. [16] Manson, G., & Berrani, S. A. Automatic TV broadcast structuring. International journal of digital multimedia broadcasting, 2010 [17] Wang, J., Duan, L., Liu, Q., Lu, H., & Jin, J. S. A multimodal scheme for program segmentation and representation in broadcast video streams. Multimedia, IEEE Transactions on. 2008; 10(3): 393-408. [18] Sadlier, D. A., Marlow, S., O’Connor, N., & Murphy, N. Automatic TV advertisement detection from MPEG bitstream. Pattern Recognition. 2002; 35(12): 2719-2726. [19] Huurnink, B., Snoek, C. G., de Rijke, M., & Smeulders, A. W. Content-based analysis improves audiovisual archive retrieval. Multimedia, IEEE Transactions on. 2012; 14(4): 1166-1178. [20] Jeong, J. W., Hong, H. K., & Lee, D. H. Ontology-based automatic video annotation technique in smart TV environment. Consumer Electronics, IEEE Transactions on. 2011; 57(4): 1830-1836. [21] O’Connor, N. E., Marlow, S., Murphy, N., Smeaton, A. F., Browne, P., Deasy, S., Lee, H. & McDonald, K. Fischlar: an online system for indexing and browsing broadcast television content. In Acoustics, Speech, and Signal Processing, 2001. Proceedings.(ICASSP’01). 2001 IEEE International Conference on. 2001; 3: 1633-1636. IEEE. [22] Pereira, M. H., Pádua, F. L., Silva, G. D., Assis, G. T., & Zenha, T. M. 2012. A multimedia information system to support the discourse analysis of video recordings of television programs. In Information Systems and Technologies (CISTI), 2012 7th Iberian Conference on (pp. 1-6). IEEE. ISSN 1927-6974
E-ISSN 1927-6982
www.sciedu.ca/air
Artificial Intelligence Research
[23] Bellard, F., & Niedermayer, M. (2012). FFmpeg. Availabel from: http://ffmpeg. org. [24] Coimbra, D. B., & Goularte, R. 2009. Digital video scenes identification using audiovisual features. In Proceedings of the XV Brazilian Symposium on Multimedia and the Web (p. 43). ACM. [25] Xu, Q., Liu, Y., Li, X., Yang, Z., Wang, J., Sbert, M., Scopigno, R. Browsing and exploration of video sequences: A new scheme for key frame extraction and 3D visualization using entropy based Jensen divergence. Information Sciences. 2014; 278: 736-756. http://dx.doi.org/10.1016/j.ins.2014.03.088 [26] Ejaz, N., Tariq, T. B., & Baik, S. W. Adaptive key frame extraction for video summarization using an aggregation mechanism. Journal of Visual Communication and Image Representation. 2012; 23(7): 1031-1040. [27] Avila, S. E. F., Lopes, A. P. B., Luz, A., & Araújo, A. A. VSUMM: A mechanism designed to produce static video summaries and a novel evaluation method. Pattern Recognition Letters. 2011; 32(1): 56-68. [28] Bhattacharyya, A. On a measure of divergence between two multinomial populations. Sankhya: The Indian Journal of Statistics. 1946: 401-406. [29] Bhalerao, A. H., & Rajpoot, N. M. Discriminant feature selection for texture classification. In Proceedings of British Machine Vision Conference. 2003. [30] Song, H., Yin, G., & Jiang, T. Auto White Balance Based on the Similarity of Chromaticity Histograms. Journal of Computational Information Systems. 2013; 9(7): 2557–2564. [31] Chen, L. H., Lai, Y. C., & Mark Liao, H. Y. Movie scene segmentation using background information. Pattern Recognition. 2008; 41(3): 1056-1065. [32] Lowe, D. G. Distinctive image features from scale-invariant keypoints. International journal of computer vision. 2004; 60(2): 91110. http://dx.doi.org/10.1023/B:VISI.0000029664.99615.94 [33] Ngo, C. W., Zhao, W. L., & Jiang, Y. G. 2006, October. Fast tracking of near-duplicate keyframes in broadcast domain with transitivity propagation. In Proceedings of the 14th annual ACM international conference on Multimedia (pp. 845-854). ACM.
Published by Sciedu Press
2014, Vol. 3, No. 3
[34] Zhang, D. Q., & Chang, S. F. 2004, October. Detecting image nearduplicate by stochastic attributed relational graph matching with learning. In Proceedings of the 12th annual ACM international conference on Multimedia (pp. 877-884). ACM. [35] Hu, W., Xie, N., Li, L., Zeng, X., & Maybank, S. A survey on visual content-based video indexing and retrieval. Systems, Man, and Cybernetics, Part C: Applications and Reviews, IEEE Transactions on. 2011; 41(6): 797-819. [36] Datta, R., Joshi, D., Li, J., & Wang, J. Z. Image retrieval: Ideas, influences, and trends of the new age. ACM Computing Surveys (CSUR). 2008; 40(2): 5. [37] Van de Sande, K. E., Gevers, T., & Snoek, C. G. Evaluating color descriptors for object and scene recognition. Pattern Analysis and Machine Intelligence, IEEE Transactions on. 2010; 32(9): 15821596. [38] Hu, M. K. Visual pattern recognition by moment invariants. Information Theory, IRE Transactions on. 1962; 8(2): 179-187. http://dx.doi.org/10.1109/TIT.1962.1057692 [39] Daubechies, I. The wavelet transform, time-frequency localization and signal analysis. Information Theory, IEEE Transactions on. 1990; 36(5): 961-1005. http://dx.doi.org/10.1109/18.57199 [40] Jia, Y., Wang, J., Zeng, G., Zha, H., & Hua, X. S. (2010, June). Optimizing k-d trees for scalable visual descriptor indexing. In Computer Vision and Pattern Recognition (CVPR), 2010 IEEE Conference on (pp. 3392-3399). IEEE [41] Paulevé, L., Jégou, H., & Amsaleg, L. Locality sensitive hashing: A comparison of hash function types and querying mechanisms. Pattern Recognition Letters. 2010; 31(11): 1348-1358. [42] Guironnet, M., Pellerin, D., Guyader, N., & Ladret, P. Video summarization based on camera motion and a subjective evaluation method. EURASIP Journal on Image and Video Processing, 2007. [43] Geisler, G., Marchionini, G., Wildemuth, B. M., Hughes, A., Yang, M., Wilkens, T., & Spinks, R. (2002, April). Video browsing interfaces for the open video project. In CHI’02 Extended Abstracts on Human Factors in Computing Systems (pp. 514-515). ACM.
61