ranking functions, called PRFÏ and PRFe, that generalize or can approximate many of the ... social networks and scientific domains, the observed interac-.
VLDB Journal manuscript No. (will be inserted by the editor)
A Unified Approach to Ranking in Probabilistic Databases Jian Li · Barna Saha · Amol Deshpande
the date of receipt and acceptance should be inserted later
Abstract Ranking is a fundamental operation in data analysis and decision support, and plays an even more crucial role if the dataset being explored exhibits uncertainty. This has led to much work in understanding how to rank the tuples in a probabilistic dataset in recent years. In this article, we present a unified approach to ranking and top-k query processing in probabilistic databases by viewing it as a multi-criterion optimization problem, and by deriving a set of features that capture the key properties of a probabilistic dataset that dictate the ranked result. We contend that a single, specific ranking function may not suffice for probabilistic databases, and we instead propose two parameterized ranking functions, called PRFω and PRFe , that generalize or can approximate many of the previously proposed ranking functions. We present novel generating functions-based algorithms for efficiently ranking large datasets according to these ranking functions, even if the datasets exhibit complex correlations modeled using probabilistic and/xor trees or Markov networks. We further propose that the parameters of the ranking function be learned from user preferences, and we develop an approach to learn those parameters. Finally, we present a comprehensive experimental study that illustrates the effectiveness of our parameterized ranking functions, especially PRFe , at approximating other ranking functions and the scalability of our proposed algorithms for exact or approximate ranking.
1 Introduction Recent years have seen a dramatic increase in the number of applications domains that naturally generate uncertain data and that demand support for executing complex decision Computer Science Department, University of Maryland, College Park 20742, MD, USA
support queries over them. These include information retrieval [20], data integration and cleaning [2, 17], text analytics [24, 30], social network analysis [1], sensor data management [11, 16], financial applications, biological and scientific data management, etc. Uncertainty arises in these environments for a variety of reasons. Sensor data typically contains noise and measurement errors and is often incomplete because of sensor faults or communication link failures. In social networks and scientific domains, the observed interaction or experimental data is often very noisy, and ubiquitous use of predictive models adds a further layer of uncertainty. Use of automated tools in data integration and information extraction introduce significant uncertainty in the output. By their very nature, many of these applications require support for ranking or top-k query processing over large volumes of data. For instance, consider a House Search application where a user is searching for a house using a real estate sales dataset that lists the houses for sale. Such a dataset, which may be constructed by crawling and combining data from multiple sources, is inherently uncertain and noisy. In fact, the houses that the user prefers the most, are also the most likely to be sold by now. We may denote such uncertainty by associating with each advertisement a probability that it is still valid. Incorporating such uncertainties into the returned answers is, however, a challenge considering the complex interplay between the relevance of a house by itself, and the probability that the advertisement is still valid. Many other application domains also exhibit resource constraints of some form, and we must somehow rank the entities or tuples under consideration to select the most relevant objects to focus our attention on. For example, in financial applications, we may want to choose the best stocks in which to invest, given their expected performance in the future (which is uncertain at best). In learning or classification tasks, we often need to choose the best “k” features to use [55]. In sensor networks or scientific databases, we may
2
not know the “true” values of the physical properties being measured because of measurement noises or failures [16], but we may still need to choose a set of sensors or entities in response to a user query. Ranking in presence of uncertainty is non-trivial even if the relevance scores can be computed easily (the main challenge in the deterministic case), mainly because of the complex trade-offs introduced by the score distributions and the tuple uncertainties. This has led to many ranking functions being proposed for combining the scores and the probabilities in recent years, all of which appear quite natural at the first glance (we review several of them in detail later). We begin with a systematic exploration of these issues by recognizing that ranking in probabilistic databases is inherently a multi-criterion optimization problem, and by deriving a set of features, the key properties of a probabilistic dataset that influence the ranked result. We empirically illustrate the diverse and conflicting behavior of several natural ranking functions, and argue that a single specific ranking function may not be appropriate to rank different uncertain databases that we may encounter in practice. Furthermore, different users may weigh the features differently, resulting in different rankings over the same dataset. We then define a general and powerful ranking function, called PRF, that allows us to explore the space of possible ranking functions. We discuss its relationship to previously proposed ranking functions, and also identify two specific parameterized ranking functions, called PRFω and PRFe , as being interesting. The PRFω ranking function is essentially a linear, weighted ranking function that resembles the scoring functions typically used in information retrieval, web search, data integration, keyword query answering etc. [8, 15, 26, 33, 51]. We observe that PRFω may not be suitable for ranking large datasets due to its high running time, and instead propose PRFe , which uses a single parameter, and can effectively approximate previously proposed ranking functions for probabilistic databases very well. We then develop novel algorithms based on generating functions to efficiently rank the tuples in a probabilistic dataset using any PRF ranking function. Our algorithm can handle a probabilistic dataset with arbitrary correlations; however, it is particularly efficient when the probabilistic database contains only mutual exclusivity and/or co-existence correlations (called probabilistic and/xor trees [41]). Our main contributions can be summarized as follows: • We develop a framework for learning ranking functions over probabilistic databases by identifying a set of key features, by proposing several parameterized ranking functions over those features, and by choosing the parameters based on user preferences or feedback. • We present novel algorithms based on generating functions for efficiently ranking very large datasets. Our key al-
J. Li, B. Saha, A. Deshpande
•
•
•
•
gorithm is an O(n log n) algorithm for evaluating a PRFe function over datasets with low correlations (specifically, constant height probabilistic and/xor trees). The algorithm runs in O(n) time if the dataset is pre-sorted by score. We present a polynomial time algorithm for ranking a correlated dataset when the correlations are captured using a bounded-treewidth graphical model. The algorithm we present is actually for computing the probability that a given tuple is ranked at a given position across all the possible worlds, and is of independent interest. We develop a novel, DFT-based algorithm for approximating an arbitrary weighted ranking function using a linear combination of PRFe functions. We show that a PRFω ranked result can be seen as a consensus answer under a suitably defined distance function – a consensus answer is defined to be the answer that is closest in expectation to the answers over the possible worlds. We present a comprehensive experimental study over several real and synthetic datasets, comparing the behavior of the ranking functions and the effectiveness of our proposed algorithms.
Outline: We begin with a brief discussion of the related work (Section 2). In Section 3, we review our probabilistic database model and the prior work on ranking in probabilistic databases, and propose two parameterized ranking functions. In Section 4, we present our generating functionsbased algorithms for ranking. We then present an approach to approximate different ranking functions using our parameterized ranking functions, and to learn a ranking function from user preferences (Section 5). In Section 6, we explore the connection between PRFω and consensus top-k query results. In Section 7, we observe an interesting property of the PRFe function that helps us gain better insight into its behavior. We then present a comprehensive experiment study in Section 8. Finally, in Section 9, we develop an algorithm for handling correlated datasets where the correlations are captured using bounded-treewidth graphical models.
2 Related Work There has been much work on managing probabilistic, uncertain, incomplete, and/or fuzzy data in database systems (see, e.g., [11, 13, 20, 23, 37, 40, 52]). The work in this area has spanned a range of issues from theoretical development of data models and data languages to practical implementation issues such as indexing techniques; several research efforts are underway to build systems to manage uncertain data (e.g., MYSTIQ [13], Trio [52], ORION [11], MayBMS [37], PrDB [48]). The approaches can be differentiated based on whether they support tuple-level uncertainty where “existence” probabilities are attached to the tuples
A Unified Approach to Ranking in Probabilistic Databases
of the database, or attribute-level uncertainty where (possibly continuous) probability distributions are attached to the attributes, or both. The proposed approaches differ further based on whether they consider correlations or not. Most work in probabilistic databases has either assumed independence [13, 20] or has restricted the correlations that can be modeled [2, 40, 47]. More recently, several approaches have been presented that allow representation of arbitrary correlations and querying over correlated databases [23, 38, 48]. The area of ranking and top-k query processing has also seen much work in databases (see, e.g., Ilyas et al.’s survey [28]). More recently, several researchers have considered top-k query processing in probabilistic databases. Soliman et al. [49] defined the problem of ranking over probabilistic databases, and proposed two ranking functions to combine tuple scores and probabilities. Yi et al. [53] present improved algorithms for the same ranking functions. Zhang et al. [54] present a desiderata for ranking functions, and propose the notion of Global Top-k answers. Ming Hua et al. [27] propose probabilistic threshold ranking, which is quite similar to Global Top-k. Cormode et al. [12] also present a semantics of ranking functions and a new ranking function called expected rank. Liu et al. [44] propose the notion of k-selection queries; unlike most of the above definitions, the result here is sensitive to the actual tuple scores. We will review these ranking functions in detail in next section. Ge et al. [21] propose the notion of typical answers, where they propose returning a collection of typical answers instead of just one answer. This can be seen as complementary to our approach here; one could show the typical answers to the user to understand the user preferences during an exploratory phase, and then learn a single ranking function to rank using the techniques developed in this article. There is also work on top-k query processing in probabilistic databases where the ranking is by the result tuple probabilities (i.e., probability and score are identical) [45]. The main challenge in that work is efficient computation of the probabilities, whereas we assume that the probability and score are either given or can be computed easily. The aforementioned work has focused mainly on tuple uncertainty and discrete attribute uncertainty. Soliman and Ilyas [50] were the first to consider the problem of handling continuous distributions. Recently, in a followup work [42], we extended the algorithm for PRF to arbitrary continuous distributions. We were able to obtain exact polynomial time algorithms for some continuous probability distribution classes, and efficient approximation schemes with provable guarantees for arbitrary probability distributions. One important ingredient of those algorithms is an extension of the generating function used in this article. Recently, there has also been much work on nearest neighbor-style queries over uncertain datasets [5, 9, 10, 39]. In fact, a nearest neighbor query (or a k-nearest neighbor
3
query) can be seen as a ranking query where the score of a point is the distance of that point to the given query point. Thus, our new ranking semantics and algorithms can be directly used for nearest neighbor queries over uncertain points with discrete probability distributions. There is a tremendous body of work on ranking documents in information retrieval, and learning how to rank documents given user preferences (see Liu [43] for a comprehensive survey). That work has considered aspects such as different ranking models, loss functions, different scoring techniques etc. The techniques developed there tend to be specific to document retrieval (focusing on keywords, terms, and relevance), and usually do not deal with existence uncertainty (although they often do model document relevance as a random variable). Furthermore, our work here primarily focuses on highly efficient algorithms for ranking using a spectrum of different ranking functions. Exploring and understanding the connections between the two research areas is a fruitful direction for further research. Finally, we note that one PRF function is only able to model preferences of one user. There is an increasing interest in finding a ranking that satisfies multiple users having diverse preferences and intents (see, e.g., [3, 4]). However, those models typically assume certain inputs. Incorporating uncertainty into those models or introducing the notion of diversity into our model is an interesting research direction.
3 Problem Formulation We begin with defining our model of a probabilistic database, called probabilistic and/xor tree [41], that captures several common types of correlations. We then review the prior work on top-k query processing in probabilistic databases, and argue that a single specific ranking function may not capture the intricacies of ranking with uncertainty. We then present our parameterized ranking functions, PRFω and PRFe .
3.1 Probabilistic Database Model We use the prevalent possible worlds semantics for probabilistic databases [13]. We denote a probabilistic relation with tuple uncertainty by DT , where T denotes the set of tuples (in Section 4.4, we present extensions to handle attribute uncertainty). The set of all possible worlds is denoted by P W = {pw1 , pw2 , ...., pwn }. Each tuple ti ∈ T is associated with an existence probability Pr(ti ) and a score score(ti ), computed based on a scoring function score : T → R. Usually score(t) is computed based on the tuple attribute values and measures the relative user preference for different tuples. In a deterministic database, tuples with higher scores should be ranked higher. We use
4
J. Li, B. Saha, A. Deshpande Time 11:40 11:55 11:35 12:10 12:25 12:15
Car Loc L1 L2 L3 L4 L5 L6
Plate No X-123 Y-245 Y-245 Z-541 Z-541 L-110
Speed
...
Prob
120 130 80 95 110 105
... ... ... ... ... ...
0.4 0.7 0.3 0.4 0.6 1.0
Tuple Id t1 t2 t3 t4 t5 t6
Possible Worlds pw1 = {t2 , t1 , t6 , t4 } pw2 = {t2 , t1 , t5 , t6 } pw3 = {t1 , t6 , t4 , t3 } pw4 = {t1 , t5 , t6 , t3 } pw5 = {t2 , t6 , t4 } pw6 = {t2 , t5 , t6 } pw7 = {t6 , t4 , t3 } pw8 = {t5 , t6 , t3 }
Prob .112 .168 .048 .072 .168 .252 .072 .108
∧ ∨
.4
t1 ,120
.7 t2 ,130
∨
∨
.4
.3
t4 ,95
t3 ,80
∨
.6
1
t5 ,110
t6 ,105
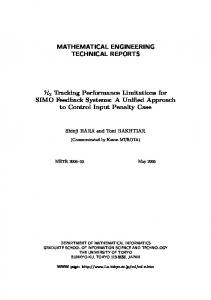
Fig. 1 Example of a probabilistic database which contains automatically captured information about speeding cars – here the Plate No. is the possible worlds key and the speed is the score attribute that we will use for ranking. Tuples t2 and t3 (similarly, t4 and t5 ) are mutually exclusive. The second table lists all possible worlds. Note that the tuples are sorted according to their speeds in each possible world. The corresponding and/xor tree compactly encodes these correlations.
Possible Worlds pw1 = {(t3 , 6), (t2 , 5), (t1 1)} pw2 = {(t3 , 9), (t1 , 7)} pw3 = {(t2 , 8), (t4 , 4), (t5 , 3)}
rpw : T → {1, . . . , n} ∪ {∞} to denote the rank of the tuple t in a possible world pw according to score. If t does not appear in the possible world pw, we let rpw (t) = ∞. We say t1 ranks higher than t2 in the possible world pw if rpw (t1 ) < rpw (t2 ). For each tuple t, we define a random variable r(t) that denotes the rank of t in DT . Definition 1 The positional probability of a tuple t being ranked at position k, denoted Pr(r(t) = k), is the total probability of the possible worlds where t is ranked at position k. The rank distribution of a tuple t, denoted Pr(r(t)), is simply the probability distribution of the random variable r(t). Probabilistic And/Xor Tree Model: Our algorithms can handle arbitrarily correlated datasets with correlations modeled using Markov networks (Section 9). However, in most of this article, we focus on the probabilistic and/xor tree model, introduced in our prior work [41], that can capture only a more restricted set of correlations, but admits highly efficient query processing algorithms. More specifically, an and/xor tree captures two types of correlations: (1) mutual ∨ (xor)) and (2) mutual co-existence exclusivity (denoted ∧ (and)). Two events satisfy the mutual co-existence cor( relation if, in any possible world, either both events occur or neither occurs. Similarly two events are mutually exclusive if there is no possible world where both happen. Formally, in tree T , we denote the set of children of node v by ChT (v) and the least common ancestor of two leaves l1 and l2 by LCAT (l1 , l2 ). We omit the subscript if the context is clear. For simplicity, we separate the attributes of the relation into two groups: (1) a possible worlds key, denoted K, which is unique in any possible world (i.e., two tuples that agree on K are mutually exclusive), and (2) the value attributes, denoted A. If the relation does not have any key attributes, K = φ. Definition 2 A probabilistic and/xor tree T represents the mutual exclusion and co-existence correlations in a probabilistic relation RP (K; A), where K is the possible worlds key, and A denotes the value attributes. In T , each leaf de∨ or . ∧ For notes a tuple, and each inner node has a mark, ∨ node u and each of its children v ∈ Ch(u), there is each a nonnegative value p(u,v) associated with the edge (u, v). Moreover, we require:
.3
∨
t3 , 6
t2 , 5
.4
.3
∧
∧ t1 , 1
t3 , 9
Prob .3 .3 .4
∧ t1 , 7
t2 , 8
t4 , 4
t5 , 3
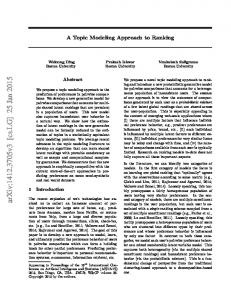
Fig. 2 Example of a highly correlated probabilistic database with 3 possible worlds and the and/xor tree that captures the correlation.
P • (Probability Constraint) v:v∈Ch(u) Pr(u, v) ≤ 1. • (Key Constraint) For any two different leaves l1 , l2 ∨ node.1 holding the same key, LCA(l1 , l2 ) is a Let Tv be the subtree rooted at v and Ch(v) = {v1 , . . . , v` }. The subtree Tv inductively defines a random subset Sv of its leaves by the following independent process: • If v is a leaf, Sv = {v}. ∨ node, then • If Tv roots�at a Svi with prob p(v,vi ) P` Sv = ∅ with prob 1 − i=1 p(v,vi ) ∧ node, then Sv = ∪`i=1 Svi • If Tv roots at a x-tuples (which can be used to specify mutual exclusivity correlations between tuples) correspond to the special ∧ node as the case where we have a tree of height 2, with a ∨ nodes in the second level. Figure 2 shows root and only an example of an and/xor tree that models the data from a traffic monitoring application [49], where the tuples represent automatically captured traffic data. The inherent uncertainty in the monitoring infrastructure is captured using an and/xor tree, that encodes the tuple existence probabilities as well as the correlations between the tuples. For example, ∨ node indicates t1 is present with probability the leftmost ∨ node dictates that exactly one of t2 and .4 and the second ∧ node tells us the random t3 should appear. The topmost ∨ nodes coexist. sets derived from these Probabilistic and/xor trees significantly generalize xtuples [47, 53], block-independent disjoint tuples model, and p-or-sets [14], and can, in fact, represent an arbitrary 1
The key constraint is imposed to avoid two leaves with the same key but different attribute values coexisting in a possible world.
A Unified Approach to Ranking in Probabilistic Databases
finite set of possible worlds. This can be done by listing all ∧ node for each world, and possible worlds, creating one ∨ node as the root to capture that these worlds are using an mutually exclusive. Figure 2 shows an example of this. The correlations captured by an and/xor tree can be represented by probabilistic c-tables [23] and provenance semirings [22]. However, that does not directly imply an efficient algorithm for ranking. We remark that Markov or Bayesian networks are able to capture more general correlations in a compact way [48]; however, probability computations on them (inference) is typically exponential in the treewidth of the model. The treewidth of an and/xor tree (viewing it as a Markov network) is not bounded, and hence the techniques developed for those models can not be used to obtain polynomial time algorithms for and/xor trees. And/xor trees also exhibit superficial similarities to ws-trees [38], which can also capture mutual exclusivity and coexistence between tuples. We note that no prior work on ranking in probabilistic databases has considered more complex correlations than x-tuples.
3.2 Ranking over Probabilistic Data: Definitions and Prior Work The interplay between probabilities and scores complicates the semantics of ranking in probabilistic databases. This was observed by Soliman et al. [49], who first considered this problem and presented two definitions of top-k queries in probabilistic databases. Several other definitions of ranking have been proposed since then. We briefly review the ranking functions we consider in this work. – Uncertain Top-k (U-Top) [49]: Here the query returns the k-tuple set that appears as the top-k answer in most possible worlds (weighted by the probabilities of the worlds). – Uncertain Rank-k (U-Rank) [49]: At each rank i, we return the tuple with the maximum probability of being at the i’th rank in all possible worlds. In other words, URank returns: {t∗i , i = 1, 2, .., k}, where t∗i = argmaxt (Pr(r(t) = i)). Note that, under these semantics, the same tuple may be ranked at multiple positions. In our experiments, we use a slightly modified version that enforces distinct tuples in the answer (by not choosing a tuple at a position if it is already chosen at a higher position). – Probabilistic Threshold Top-k (PT(h)) [27]2 : The original definition of a probabilistic threshold query asks for all tuples with probability of being in top-h answer larger than a pre-specified threshold, i.e., all tuples t such that Pr(r(t) ≤ h) > threshold. For consistency with other 2
This is quite similar to the Global Top-k semantics [54].
5
ranking functions, we slightly modify the definition and instead ask for the k tuples with the largest Pr(r(t) ≤ h) values. – Expected Ranks (E-Rank) [12]: The tuples are ranked in the increasing order by the expected value of their ranks across the possible worlds, i.e., by: P pw∈P W Pr(pw)rpw (t), where rpw (t) is defined to be |pw| if t ∈ / pw. – Expected Score (E-Score): Another natural ranking function, also considered by [12], is simply to rank the tuples by their expected score, Pr(t)score(t). – k-selection Query [44]: A k-selection query returns the set of k tuples, such that the expected score of the best available tuple across the possible worlds is maximized. – Consensus Top-k (Con-Topk): This is a semantics for top-k queries developed under the framework of consensus answers in probabilistic databases [41]. We defer its definition till Section 6 where we discuss in detail its relationship with the PRF function proposed in this article. Normalized Kendall Distance: To compare different ranking functions or criteria, we need a distance measure to evaluate the closeness of two top-k answers. We use the prevalent Kendall tau distance defined for comparing top-k answers for this purpose [19]. It is also called Kemeny distance in the literature and is considered to have many advantages over other distance metrics [18]. Let K1 and K2 denote two top-k ranked lists. Then Kendall tau distance between K1 and K2 is defined to be: P ˆ j), dis(K1 , K2 ) = K(i, (i,j)∈P (K1 ,K2 )
where P (K1 , K2 ) is the set of all unordered pairs of K1 ∪K2 . Given such a pair (i, j), we use notation i >K1 j to denote that either (1) i ∈ K1 , j ∈ K1 and i is ranked higher than j ˆ j) = 1 if either: in K1 , or (2) i ∈ K1 , j ∈ / K1 . Then, K(i, (1) i >K1 j and i 0 ω (t, i) Pr(r(t) = i) Special case of PRF: ω (t, i) = wi , wi = 0, ∀i > h Special case of PRFω : wi = αi , α ∈ C Special case of PRFω : wi = −i Delta function: δ (p) = 1 if p is true, δ (p) = 0 o.w.
Table 2 Notation
general form is defined to be: X Υω (t) = ω(t, rpw (t)) · Pr(pw) pw:t∈pw
=
X X
ω(t, i) Pr(pw ∧ rpw (t) = i)
pw:t∈pw i>0
=
X
ω(t, i) · Pr(r(t) = i).
i>0
A top-k query returns k tuples with the highest |Υω | values. In most cases, ω is a real positive function and we just need to find the k tuples with highest Υω values. However we allow ω to be a complex function in order to approximate other functions efficiently (see Section 5.1). Depending on the actual function ω, we get different ranking functions with diverse behaviors. Before discussing the relationship to prior ranking functions, we define two special cases. PRFω (h): One important class of ranking functions is when ω(t, i) = ω(i) (i.e., independent of t); ω(i) = 0 ∀i > h for some positive integer h (typically h � n). This forms one of prevalent classes of ranking functions used in domains such as information retrieval and machine learning, with the weights typically learned from user preferences [8, 15, 26, 33]. Also, the weight function ln 2 ω(i) = ln(i+1) (called discount factor) is often used in the context of ranking documents in information retrieval [29]. PRFe (α) : This is a special case of PRFω (h) where ω(i) = αi , where α is a constant and may be a real or a complex number. Here h = n (no weights are 0). Typically we expect |α| ≤ 1, otherwise we have the counterintuitive behavior that tuples with lower scores are preferred. PRFω and PRFe form the two parameterized ranking functions that we propose in this work. Although PRFω is the more natural ranking function and has been used elsewhere, PRFe is more suitable for ranking in probabilistic databases for various reasons. First, the features as we have defined above are not completely arbitrary, and the features Pr(r(t) = i) for small i are clearly more important than the ones for large i. Hence in most cases we would like the weight function, ω(i), to be monotonically nonincreasing. PRFe naturally captures this behavior (as long as |α| ≤ 1). More importantly, we can compute the PRFe
7
function in O(n log n) time (O(n) time if the dataset is presorted by score) even for datasets with low degrees of correlations (i.e., modeled by and/xor trees with low heights). This makes it significantly more attractive for ranking over large datasets. Furthermore, ranking by PRFe (α), with suitably chosen α, can approximate rankings by many other functions reasonably well even with only real α. Finally, a linear combination of exponential functions, with complex bases, is known to be very expressive in representing other functions [6]. We make use of this fact to approximate many ranking functions by linear combinations of a small number of PRFe functions, thus significantly speeding up the running time (Section 5.1). Relationship to other ranking functions: We illustrate some of the choices of weight function, and relate them to prior ranking functions.3 We omit the subscript ω if the context is clear. Let δ(p) denote a delta function where p is a boolean predicate: δ(p) = 1 if p = true, and δ(p) = 0 otherwise. – Ranking by probabilities: If ω(t, i) = 1, the result is the set of k tuples with the highest probabilities [45]. – Expected Score: By setting ω(t, i) = score(t), we get the E-Score: X Υ (t) = score(t) Pr(pw) = score(t) Pr(t) pw:t∈pw
= E[score(t)] – Probabilistic Threshold Top-k (PT(h)): If we choose ω(i) = δ(i ≤ h), i.e., ω(i) = 1 for i ≤ h, and = 0 otherwise, then we have exactly the answer for PT(h). – Uncertain Rank-k (U-Rank): Let ωj (i) = δ(i = j), for some 1 ≤ j ≤ k. We can see the tuple with largest Υωj value is the rank-j answer in U-Rank query [49]. This allows us to compute the U-Rank answer by evaluating Υωj (t) for all t ∈ T and j = 1, . . . , k. – Expected ranks (E-Rank): Let PRF` (PRF linear) be another special case of the PRFω function, where wi = ω(i) = −i. The PRF` function bears a close similarity to the notion of expected ranks. Recall that the expected rank of a tuple t is defined to be: X E[rpw (t)] = Pr(pw)rpw (t) pw∈P W
where rpw (t) = |pw| if ti ∈ / pw. Let C denote the expected size of a possible world. It is easy to see that: Pn C = i=1 pi due to linearity of expectation. Then the expected rank of t can be seen to consist of two parts: 3 The definition of the U-Top introduced by Soliman et al. [49] requires that the retrieved k tuples belong to a valid possible world. However, it is not required in our definition, and hence it is not possible to simulate U-Top using PRF.
8
J. Li, B. Saha, A. Deshpande
(1) the contribution of possible worlds where t exists: er1 (t) =
X
i × Pr(r(t) = i) = −Υ (t)
i>0
where Υ (t) is the PRF` value of tuple t.4 (2) the contribution X of worlds where t does not exist: er2 (t) = Pr(pw)|pw|
4 Ranking Algorithms We next present an algorithm for efficiently ranking according to a PRF function. We first present the basic idea behind our algorithm assuming mutual independence, and then consider correlated tuples with correlations represented using an and/xor tree. We then present a very efficient algorithm for ranking using a PRFe function, and then briefly discuss how to handle attribute uncertainty.
pw:t∈pw /
= (1 − p(t))(
X
Pr(ti | t does not exist))
ti 6=t
If the tuples are independent of each other, then we have: X
Pr(ti | t does not exist) = (C − p(t))
ti 6=t
Thus, the expected ranks can be computed in the same time as PRF` in tuple-independent datasets. This term can also be computed efficiently in many other cases, including in datasets where only mutual exclusion correlations are permitted. If the correlations are represented using a probabilistic and/xor tree (see Section 4.2) or a low-treewidth graphical model (see Section 9), then we can compute this term efficiently as well, thus generalizing the prior algorithms for computing expected ranks. – k-selection Query [44]: It is easy to see that a k-selection query is equivalent to setting: ω(t, i) = δ(i = 1)score(t). As we can see, many different ranking functions can be seen as special cases of the general PRF ranking function, supporting our claim that PRF can effectively unify these different approaches to ranking uncertain datasets. Finally, we note that, when choosing the positional probabilities as the only “features”, we made an implicit assumption that the actual values (magnitudes) of the scores do not matter (this property was called “value invariance” by Cormode et al. [12]). However, that may not be true in some application domains. In its most general form, PRF allows tuple-specific and hence score-dependent weights, but such weight functions are not easy to learn, and significant domain expertise may be needed to design them. We can also explicitly use score as an additional feature; the contribution of this feature to the PRF values of the tuples can be computed in O(n) time (our algorithms for computing PRF values have at least O(n log n) complexity). Further, except for the special algorithm for learning a single PRFe function (Section 5.2), the other learning algorithms discussed in this article can be easily adapted to include the score feature. For simplicity, we omit the score feature in the rest of the article. 4 Note that, in the expected rank approach, we pick the k tuples with the lowest expected rank, but in our approach, we choose the tuples with the highest PRF function values, hence the negation.
4.1 Assuming Tuple Independence First we show how the PRF function can be computed in O(n2 ) time for a general weight function ω, and for a given set of tuples T = {t1 , . . . , tn }. In all our algorithms, we assume that ω(t, i) can be computed in O(1) time. Clearly it is sufficient to compute Pr(r(t) = j) for any tuple t and 1 ≤ j ≤ n in O(n2 ) time. Given these values, we can directly compute the values of Υ (t) in O(n2 ) time. (Later, we will present several algorithms which run in O(n) or O(n log n) time which combine these two steps for some special ω functions). We first sort the tuples in a non-increasing order by their scores; assume t1 , . . . , tn indicates this sorted order. Suppose now we want to compute Pr(r(ti ) = j). Let Ti = {t1 , t2 , . . . , ti } and σi be an indicator variable that takes value 1 if ti is present in a possible world, and 0 otherwise. Further, let σ = hσ1 , . . . , σn i denote a vector containing all the indicator variables. Then, we can write Pr(r(ti ) = j) as follows: Pr(r(ti ) = j) X = Pr(ti )
Pr(pw)
pw:|pw∩Ti−1 |=j−1
X
= Pr(ti ) σ:
i−1 P
σl =j−1
Y l i. Hence, we can expand F i to compute the coefficients in O(i2 ) time. This allows us to compute Pr(r(ti ) = j) for ti in O(i2 ) time; Υ (ti ), in turn, can be written as: X X Υ (ti ) = ω(ti , j) · Pr(r(ti ) = j) = ω(ti , j)cj (1) j
j
which can be computed in O(i2 ) time. Example 2 Consider a relation with 3 independent tuples t1 , t2 , t3 (already sorted according to the score function) with existence probabilities 0.5, 0.6, 0.4, respectively. The generating function for t3 is: 3
3
2
F (x) = (.5 + .5x)(.4 + .6x)(.4x) = .12x + .2x + .08x This gives us: Pr(r(t3 ) = 1) = .08, Pr(r(t3 ) = 2) = .2, Pr(r(t3 ) = 3) = .12
If we expand each F i for 1 ≤ i ≤ n from scratch, we need O(n2 ) time for each F i and O(n3 ) time in total. However, the expansion of F i can be obtained from the expansion of F i−1 in O(i) time by observing that: F i (x) =
� Pr(ti ) i−1 � F (x) 1−Pr(ti−1 )+Pr(ti−1 )x (2) Pr(ti−1 )
This trick gives us a O(n2 ) time complexity for computing the values of the ranking function for all tuples. See Algorithm 1 for the pseudocode. Note that O(n2 ) time is asymptotically optimal in general since the computation involves at least O(n2 ) probabilities, namely Pr(r(ti ) = j) for all 1 ≤ i, j ≤ n. For some specific ω functions, we may be able to achieve faster running time. For PRFω (h) functions, we only need
4.2 Probabilistic And/Xor Trees Next we generalize our algorithm to handle a correlated database where the correlations can be captured using an and/xor tree. In fact, many types of probability computations on and/xor trees can be done efficiently and elegantly using generating functions. Here we first provide a general result and then specialize it for PRF computation. As before, let T = {t1 , t2 , . . . , tn } denote the tuples sorted in a non-increasing order of their score function, and let Ti = {t1 , t2 , . . . , ti }. Let T denote the and/xor tree. Suppose X = {x1 , x2 , . . .} is a set of variables. Define a mapping π which associates each leaf l ∈ T with a variable π(l) ∈ X . Let Tv denote the subtree rooted at v and let v1 , . . . , vh be v’s children. For each node v ∈ T , we define a generating function Fv (X ) = Fv (x1 , x2 , . . .) recursively: • If v is a leaf, Fv (X ) = π(v). ∨ node, • If v is a Ph Ph Fv (X ) = (1 − l=1 p(v,vl ) ) + l=1 p(v,vl ) Fvl (X ) Qh ∧ node, Fvi (X ) = • If v is a l=1 Fvl (X ). The generating function F(X ) for tree T is the one defined above for the root. It is easy to see, if we have a constant number of variables, the polynomial can be exP panded in the form of i1 ,i2 ,... ci1 ,i2 ... xi11 xi22 . . . in polynomial time. Now recall that each possible world pw con∨ and tains a subset of the leaves of T (as dictated by the ∧ nodes). The following theorem characterizes the relation ship between the coefficients of F and the probabilities we are interested in. Q i Theorem 1 The coefficient of the term j xjj in F(X ) is the total probability of the possible worlds for which, for all j, there are exactly ij leaves associated with variable xj . See Appendix A for the proof. We first provide two simple examples to show how to use Theorem 1 to compute the
10
J. Li, B. Saha, A. Deshpande
.3
∧
∨
.7x3 + .3x2
x3
∧
x2
t3 , 6
t2 , 5
t1 , 1
t3 , 9
x
x
x
x
(i)
(.6 + .4x)(.3 + .7x)(.6x + .4y)x
∧
.4
.3
∧
x3
∨ .6 + .4x ∨ .4
.3 + .7x
.7
.3
t1 , 7
t2 , 8
t4 , 4
t5 , 3
t1 ,120
t2 ,130
t3 ,80
x
x
x
x
x
x
1
.4
∨ .6x + .4y ∨ .6
1
t4 ,95
t5 ,110
t6 ,105
y
x
x
(ii)
x
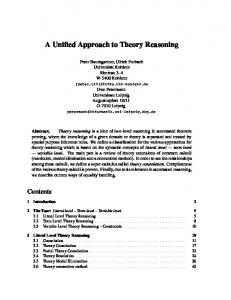
Fig. 3 PRF computation on and/xor trees: (i) The left figure corresponds to the database in Figure 2; the generating function obtained by assigning the same variable x to all leaves gives us the distribution over the sizes of the possible worlds. (ii) The right figure illustrates the construction of the generating function for computing Pr(r(t4 ) = 3) in the and/xor tree in Figure 1.
Algorithm 2: ANDXOR-PRF-RANK(T ) π (ti ) ← 1∀i {π (ti ) is the variable associated to leaf ti } for i = 1 to n do if i 6= 1 then s(ti−1 ) ← x π (ti ) ← y F i (x, y ) = GENE(Ti , π ) P P Expand F i (x, y ) in the form j c0j xj + ( j cj xj−1 )y Pn Υ (ti ) = j =1 ω (ti , j )cj return k tuples with largest Υ values Subroutine: GENE(T , π ) r is the root of tree T if T is a singleton node then return π (r) else Ti is P the subtree rooted at ri for ri ∈ Ch(r) p = r ∈Ch(r) p(r,ri ) i ∨ node thenP if r is a return 1 − p + ri ∈Ch(r) p(r,ri ) · GENE(Ti , t) ∧ node if r is a Q then return ri ∈Ch(r) GENE(Ti , t)
probabilities of two events related to the size of the possible world, and then show how to use the same idea to compute Pr(r(t) = i). Example 3 If we associate all leaves with the same variable x, the coefficient of xi is equal to Pr(|pw| = i). The above can be used to obtain a distribution on the possible world sizes (Figure 3(i)). Example 4 If we associate a subset S of the leaves with variable x, and other leaves with constant 1, the coefficient of xi is equal to Pr(|pw ∩ S| = i). Next we show how to compute Pr(r(ti ) = j) (i.e., the probability ti is ranked at position j). Let s denote the score of the tuple. In the and/xor tree T , we associate all leaves with score value larger than s with variable x, the leaf (ti , s) with variable y, and the rest of leaves with constant 1. Let the resulting generating function be F i . By Theorem 1, the coefficient of xj−1 y in the generating function F i is exactly Pr(r(ti ) = j). See Algorithm 2 for the pseudocode of the algorithm. Example 5 We consider the database in Figure 1. Suppose we want to compute Pr(r(t4 ) = 3). We associate variable
x to t1 , t2 , t5 and t6 since their scores are larger than t4 ’s score. We also associate y to t4 itself and 1 to t3 whose score is less than t4 ’s score. The generating function for the right hand side tree in Figure 3 is (.6+.4x)(.3+.7)(.4x+.6y)x = .168x4 + 0.112x3 y + 0.324x3 + 0.216x2 y + 0.108x2 + 0.072xy. So we get that Pr(r(t5 ) = 3) is the coefficient of x2 y which is 0.216. From Figure 1, we can also see Pr(r(t5 ) = 3) = Pr(pw3 ) + Pr(pw5 ) = .048 + .168 = .216. If we expand Fvi for each internal node v in a naive way (i.e., we do polynomial multiplication one by one), we can show the running time is O(n2 ) at each internal node, O(n3 ) for each tree F i and thus O(n4 ) overall. If we do divideand-conquer at each internal node and use the FFT-based (Fast Fourier Transformation) algorithm for the multiplication of polynomials, the running time for each F i can be improved to O(n2 log2 n). See Appendix B for the details. In fact, we can further improve the running time to O(n2 ) for each F i and O(n3 ) overall. We outline two algorithms in Appendix B. 4.3 Computing a PRFe Function Next we present an O(n log n) algorithm to evaluate a PRFe function (the algorithm runs in linear time if the dataset is pre-sorted by score). If ω(i) = αi , then we observe that: Υ (ti ) =
n X
Pr(r(ti ) = j)αj = F i (α)
(3)
j=1
This surprisingly simple relationship suggests we don’t have to expand the polynomials F i (x) at all; instead we can evaluate the numerical value of F i (α) directly. Again, we note that the value F i (α) can be computed from the value of F i−1 (α) in O(1) time using Equation (2). Thus, we have O(n) time algorithm to compute Υ (ti ) for all 1 ≤ i ≤ n if the tuples are pre-sorted. Example 6 Consider Example 2 and the P RF e function for t3 . We choose ω(i) = .6i . Then, we can see that F 3 (x) = (.5 + .5x)(.4 + .6x)(.4x). So, Υ (t3 ) = F 3 (.6) = (.5 + .5 × .6)(.4 + .6 × .6)(.4 × .6) = .14592.
A Unified Approach to Ranking in Probabilistic Databases
11
We can use a similar idea to speed up the computation if the tuples are correlated and the correlations are represented using an and/xor tree. Let Ti be the and/xor tree where π(tj ) = x for 1 ≤ j < i, π(ti ) = y and π(tj ) = 1 for i j > i. Suppose function for P P the generating PnTi is jF (x, y) = 0 j j−1 )y and Υ (ti ) = j=1 α cj . We obj cj x + ( j cj x serve an intriguing relationship between the PRFe value and the generating function: Υ (ti ) =
X j
cj αj =
�X
c0j αj + (
j
X j
� X cj αj−1 )α − c0j αj j
= F i (α, α) − F i (α, 0). Given this, Υ (ti ) can be computed in linear time by bottom up evaluation of F i (α, α) and F i (α, 0) in T i . If we simply repeat it n times, once for each ti , this gives us a O(n2 ) total running time. By carefully sharing the intermediate results among computations of Υ (ti ), we can improve the running time to O(n log n + nd) where d is the height of the and/xor tree. This improved algorithm runs in iterations. Suppose the tuples are already pre-sorted by their scores. Initially, the label of all leaves, i.e., π(ti ), is 1. In iteration i, we change the label of leaf ti−1 from y to x and the label of ti from 1 to y. The algorithm maintains the following information in each inner node v: the numerical values of Fvi (α, α) and Fvi (α, 0). The values on node v need to be updated when the value of one of its children changes. Therefore, in each iteration, the computation only happens on the two paths, one from ti−1 to the root and one from ti to the root. Since we update at most O(d) nodes for each iteration, the running time is O(nd). Suppose we want to update the information on the path from ti−1 to the root. We first update the Fvi (., .) values for the leaf ti−1 . Since Ftii−1 = π(ti−1 ) = x, we have Ftii−1 (α, α) = α and Ftii−1 (α, 0) = α. We assume v’s child, say u, just had its values changed. The updating rule for Fvi (., .)(both Fvi (α, α) and Fvi (α, 0)) in node v is as follows. ∧ node, Fvi (., .) ← Fvi−1 (., .)Fui (., .)/Fui−1 (., .) 1. v is a ∨ node, then: 2. v is a
Fvi (., .) ← Fvi−1 (., .) + p(v,u) Fui (., .) − p(v,u) Fui−1 (., .) The values on other nodes are not affected. The updating rule for the path from ti to the root is the same except that for the leaf ti , we have Ftii (α, α) = α and Ftii (α, 0) = 0 since Ftii (x, y) = π(ti ) = y. See Algorithm 3 for the psuedocode. We note that, for the case of x-tuples, which can be represented using a two-level tree, this gives us an O(n log n) algorithm for ranking according to PRFe .
Algorithm 3: ANDXOR-PRFe -RANK(T ) Fti (α, α) = 1, Fti (α, 0) = 1, ∀i for i = 1 to n do if i 6= 1 then Fti−1 (α, α) = α, Fti−1 (α, 0) = α UPDATE(T , ti−1 ) Fti (α, α) = α, Fti (α, 0) = 0 UPDATE(T , ti ) Υ (ti ) = Fr (α, α) − Fr (α, 0) return k tuples with largest Υ values Subroutine: UPDATE(T , v ) while v is not the root do
u←v v ← parent(v ) ∧ node then if v is a Fv (., .) ← Fv (., .)Fui (., .)/Fu (., .) ∨ node then if v is a Fv (., .) ← Fv (., .) + p(v,u) Fu (., .) − p(v,u) Fu (., .)
4.4 Attribute Uncertainty or Uncertain Scores We briefly describe how we can do ranking over tuples with discrete attribute uncertainty where the uncertain attributes are part of the tuple scoring function (if the uncertain attributes do not affect the tuple score, then they can be ignored for the ranking purposes). More generally, this approach can handle the case when there is a discrete probability distribution over the score of the tuple. P Assume j pi,j ≤ 1 for all i. The score scorei of tuple ti takes value vi,j with probability pi,j and P ti does not appear in the database with probability 1 − j pi,j . It is easy to see the PRF value of ti is X Υ (ti ) = ω(ti , k) Pr(r(ti ) = k) k>0
=
X
ω(ti , k)
X� X j
Pr(r(ti ) = k ∧ scorei = vi,j )
j
k>0
=
X
ω(ti , k) Pr(r(ti ) = k ∧ scorei = vi,j )
�
k>0
The algorithm works by treating the alternatives of the tuples (with a separate alternative for each different possible score for the tuple) as different tuples. In other words, we create a new tuple ti,j for each vi,j value. ti,j has existence probability pi,j . Then, we add an xor constraint over the alternatives {ti,j }j of each tuple ti . We can then use the algorithm for the probabilistic and/xor tree model to find the values of the PRF function for each ti,j separately. Note that Pr(r(ti ) = k ∧ scorei = vi,j ) is exactly the probability that r(ti,j ) = k in the and/xor tree. Thus, by the above equation, we have P that Υ (ti,j ) =P k>0 ω(ti , k) Pr(r(ti ) = k ∧ scorei = vi,j ) and Υ (ti ) = j Υ (ti,j ). Therefore, in a final step, we calculate the Υ score for each original tuple ti by adding the Υ scores of its alternatives {ti,j }j . If the original tuples were independent, the complexity of this algorithm is O(n2 ) for
12
J. Li, B. Saha, A. Deshpande
Independent tuples And/Xor tree (height=d) And/Xor tree
PRF O(n2 ) O(n3 ) or O(n2 (log n)2 d) O(n3 )
PRFω (h) O(nh + n log n) O(n3 ) or O(n2 (log n)2 d) O(n3 )
PRFe O(n log n) O(nd + n log n) P O( i di + n log n)
Table 3 Summary of the running times. n is the number of tuples. di is the depth of tuple ti in the and/xor tree.
computing the PRF function, and O(n log n) for computing the PRFe function where n is the size of the input, i.e., the total number of different possible scores.
4.5 Summary We summarize the complexities of the algorithms for different models in Table 3. Now, we explain some entries in the table which has not been discussed. The first is the PRF computation over an and/xor tree with height d. We have two choices here. One is just to use the algorithm for arbitrary and/xor trees, i.e., to use the algorithm in Appendix B to expand F i (x, y) for each i, which runs in O(n2 ) time. The overall running time is O(n3 ). The other one is to use the divide-and-conquer algorithm in Appendix B to expand ∧ node in F i (x, y). We can easily the polynomial for each see that expanding nodes for each level of the tree requires at most O(n(log n)2 ) time. Therefore, the running time for expanding F i (x, y) is at most O(n(log n)2 )d) and the overall running time is O(n2 (log n)2 d) which is much better than O(n3 ) if d � n. For PRFω (h) computation over and/xor trees, we do not know how to achieve a better bound as in the tuple-independent datasets. We leave it as an interesting open problem. For PRFe computation on and/xor trees, we use ANDXOR-PRFe -RANK. Now, the procedure UPDATE(T , ti ) runs in O(di ) time where di is the depth of tuple ti in the and/xor tree, i.e., the length of path from the root to ti . Therefore, the total running time is P O( i di + n log n). If the height of the and/xor tree is bounded by d, the running time is simply O(nd + n log n). 5 Approximating and Learning Ranking Functions In this section, we discuss how to choose the PRF functions and their parameters. Depending on the application domain and the scenarios, there are two approaches to this: • If we know the ranking function we would like to use (say PT(h)), then we can either simulate or approximate it using appropriate PRF functions. • If we are instead provided user preferences data, we can learn the parameters from them. Clearly, we would prefer to use a PRFe function, if possible, since it admits highly efficient ranking algorithms. For this purpose, we begin with presenting an algorithm to find an approximation to an arbitrary PRFω function using a linear combination of PRFe functions. We then discuss how
to learn a PRFω function from user preferences, and finally present an algorithm for learning a single PRFe function.
5.1 Approximating PRFω using PRFe Functions A linear combination of complex exponential functions is known to be very expressive, and can approximate many other functions very well [6]. Specifically, given a PRFω PL function, if we can write ω(i) as: ω(i) ≈ l=1 ul αli , then we have that: Υ (t) =
X
ω(i) Pr(r(t) = i) ≈
i
L X l=1
! ul
X
αli
Pr(r(t) = i)
i
This reduces the computation of Υ (t) to L individual PRFe function computations, each of which only takes linear time. This gives us an O(n log n+nL) time algorithm for approximately ranking using PRFω function for independent tuples (as opposed to O(n2 ) for exact ranking). Several techniques have been proposed for finding such approximations using complex exponentials [6, 25]. Those techniques are however computationally inefficient, involving computation of the inverses of large matrices and the roots of polynomials of high orders. In this section, we present a clean and efficient algorithm, based on Discrete Fourier Transforms (DFT), for approximating a function ω(i), that approaches zero for large values of i (in other words, ω(i) ≥ ω(i+1)∀i, ω(i) = 0, i > h). As we noted earlier, this captures the typical behavior of the ω(i) function. An example of such a function is the step function (ω(i) = 1∀i ≤ h, = 0∀i > h) which corresponds to the ranking function PT(h). At a high level, our algorithm starts with a DFT approximation of ω(i) and then adapts it by adding several damping, scaling and shifting factors. Discrete Fourier transformation (DFT) is a well known technique for representing a function as a linear combination of complex exponentials (also called frequency domain representation). More specifically, a discrete function ω(i) defined on a finite domain [0, N − 1] can be decomposed into exactly N exponentials as: ω(i) =
N −1 2π 1 X ψ(k)e N ki N
i = 0, . . . , N − 1.
(4)
k=0
where is the imaginary unit and ψ(0), · · · , ψ(N − 1) denotes the DFT transform of ω(0), · · · , ω(N − 1). If we want to approximate ω by fewer, say L, exponentials, we
A Unified Approach to Ranking in Probabilistic Databases
13
x < 2000, the periodicity is unacceptable if the number of tuples is larger than 2000 (since the positions between 2000 and 3000 (similarly, between 4000 and 5000) would be given high weights).
y=w(x) DFT DFT+DF DFT+DF+IS DFT+DF+IS+ES
1.0
y
2. (Damping Factor (DF)) To address this issue, we introduce a damping factor η ≤ 1 such that Bη aN ≤ � where � is a small positive real (for example, 10−5 ). Our new approximation becomes:
0.5
0.0 0
500
1000
1500
2000
2500
x
can instead use the L DFT coefficients with maximum absolute value. Assume that ψ(0), . . . , ψ(L − 1) are those coDF T efficients. Then our approximation ω ˜L of ω by L exponentials is given by: L−1 2π 1 X ψ(k)e N ki N
L−1 2π 1 X ψ(k)(ηe N k )i N k=0
(6)
Fig. 4 Illustrating the effect of the approximation steps: w(i) = step function with N = 1000, L = 20
DF T ω ˜L (i) =
DF T +DF DF T ω ˜L (i) = η i · ω ˜L (i) =
i = 0, . . . , N − 1. (5)
k=0
However, DFT utilizes only complex exponentials of unit norm, i.e., er (where r is a real), which makes this approximation periodic (with a period of N ). This is not suitable for approximating an ω function used in PRF, which is typically a monotonically non-increasing function. If we make N sufficiently large, say larger than the total number of tuples, then we usually need a large number of exponentials (L) to get a reasonable approximation. Moreover, computing DFT for very large N is computationally non-trivial. Furthermore, the number of tuples n may not be known in advance. We next present a set of nontrivial tricks to adapt the base DFT approximation to overcome these shortcomings. We assume ω(i) takes non-zero values within interval DF T (i) [0, N −1] and the absolute values of both ω(i) and ωL are bounded by B. To illustrate our method, we use the step function: � 1, i < N ω(i) = 0, i ≥ N with N = 1000 as our running example to show our method and the specific shortcomings it addresses. Figure 4 illustrates the effect of each of these adaptations. 1. (DFT) We perform pure DFT on the domain [1, aN ], where a is a small integer constant (typically < 10). As we can see in Figure 4 (where N = 1000 and a = 2), this results in a periodic approximation with a period of 2000. Although the approximation is reasonable for
By incorporating this damping factor, the periodicity is DF T +DF mitigated, since we have: limi→+∞ ω ˜L (i) = 0. DF T +DF Especially, ω ˜L (i) ≤ � for i > αN . 3. (Initial Scaling (IS)) However the use of damping factor introduces another problem: it gives a biased approximation when i is small (see Figure 4). Taking the DF T +DF step function as an example, ω ˜L (i) is approxi imately η for 0 ≤ i < N instead of 1. To rectify this, we initially perform DFT on a different sequence ω ˆ (i) = η −i ω(i) (rather than ω(i)) on domain ∈ [0, aN ]. Therefore, ω ˜ DF T +IS is a reasonable approximation of ω ˆ . Then, if we apply the damping factor, it will give us an unbiased approximation of ω, which we denote by ω ˜ DF T +DF +IS . 4. (Extending and Shifting (ES)) This step is in particular tailored for optimizing the approximation performance for ranking functions. DFT does not perform well at discontinuous points, specifically at i = 0 (the left boundary), which can significantly affect the ranking approximation. To handle this, we extrapolate ω to make it continuous around 0. Let the resulting function be ω ¯ which is defined on [−bN, +∞] for small b > 0. Again, taking the step function for example, � 1, −bN ≤ i < N ; we let ω ¯ (i) = Then, we shift 0, i ≥ N . ω ¯ (i) rightwards by bN to make its domain lie entirely in positive axis, do initial scaling and perform DFT on the resulting sequence. We denote the approximation of the resulting sequence by ω ˜ 0 (i)(by performing (6)). For the approximation of original ω(i) values, we only need to do corresponding leftward shifting , namely ω ˜ DF T +DF +IS+ES (i) = ω ˜ 0 (i + bN ). Figure 4 shows that DFT+DF+IS+ES gives a much better approximation than others around i = 0. Figures 4 and 5(i) illustrate the efficacy of our approximation technique for the step function. As we can see, we are able to approximate that function very well with just 20 or
14
J. Li, B. Saha, A. Deshpande 1500
y=w(x) y=w10(x) y=w20(x) y=w30(x) y=w50(x) y=w100(x)
0.5
1.0
0.5
500
0.0
0 0
500
1000
1500
2000
2500
y=w(x) y=w10(x) y=w20(x) y=w30(x) y=w50(x)
y
1000
y
y
1.0
y=w(x) y=w5(x) y=w10(x) y=w20(x) y=w50(x)
0.0 0
500
x
1000
1500
0
500
x
1000
1500
x
(i) w(i) = step function (ii) w(i) =1000-i (i1000) (iii) w(i) = an arbitrary smooth function Fig. 5 Approximating functions using linear combinations of complex exponentials: effect of increasing the number of coefficients
30 coefficients. Figure 5(ii) and (iii) show the approximations for a piecewise linear function and an arbitrarily generated continuous function respectively, both of which are much easier to approximate than the step function.
5.2 Learning a PRFω or PRFe Function Next we address the question of how to learn the weights of a PRFω function or the α for a single PRFe function from user preferences. To learn a linear combination of PRFe functions, we first learn a PRFω function and approximate it as above. Prior work on learning ranking functions (e.g., [8, 15, 26, 33]) assumes that the user preferences are provided in the form of a set of pairs of tuples, and for each pair, we are told which tuple is ranked higher. Our problem differs slightly from this prior work in that, the features that we use to rank the tuples (i.e., Pr(r(t) = i), i = 1, . . . , n) cannot be computed for each tuple individually, but must be computed for the entire dataset (since the values of the features for a tuple depend on the other tuples in the dataset). Hence, we assume that we are instead given a small sample of the tuples, and the user ranking for all those tuples. We compute the features assuming this sample constitutes the entire relation, and learn a ranking function accordingly, with the goal to find the parameters (the weights wi for PRFω or the parameter α for PRFe ) that minimize the number of disagreements with the provided ranking over the samples. Given this, the problem of learning PRFω is identical to the problem addressed in the prior work, and we utilize the algorithm based on support vector machines (SVM) [33] in our experiments. On the other hand, we are not aware of any work that has addressed learning a ranking function like PRFe . We use a simple binary search-like heuristic to find the optimal real value of α that minimizes the Kendall distance between the user-specified ranking and the ranking according to PRFe (α). In other words, we try to find arg minα∈[0,1] (dis(σ, σ(α))) where dis() is the Kendall distance between two rankings, σ is the ranking for the given
sample and σ(α) is the one obtained by using PRFe (α) function. Suppose we want to find the optimal a within the inter−L val [L, U ] now. We first compute dis(σ, σ(L + i · U10 ) for i = 1, . . . , 9 and find i for which the distance is the smallest. Then we reduce our search range to [max(L, L + (i − −L −L 1) · U10 , min(U, L + (i + 1) · U10 )] and repeat the above recursively. Although this algorithm can only converge to a local minimum, in our experimental study, we observed that all of the prior ranking functions exhibit a uni-valley behavior (Section 8), and in such cases, this algorithm finds the global optimal.
6 PRF as a Consensus Top-k Answer In this section, we show there is a close connection between PRFω and the notion of consensus top-k answer (Con-Topk) proposed in [41]. We first review the definition of a consensus top-k ranking. Definition 4 Let dis() denote a distance function between two top-k rankings. Then the most consensus answer τ is defined to be the top-k ranking for which the expected distance to the answer τpw of the (random) world pw is minimized, i.e., τ = arg min {E[dis(τ 0 , τpw )]}. 0 τ ∈Ω
dis() may be any distance function defined on pairs of topk answers. In [41], we discussed how to compute or approximate Con-Topk under a number of distance functions, such as Spearman’s rho, Kendall’s tau and intersection metric [19]. Example 7 Consider the example in Figure 1. Assume k = 2 and the distance function is the symmetric difference metric dis∆ = |(τ1 \τ2 ) ∪ (τ2 \τ1 )|. The most consensus top-2 answer is {t2 , t5 } and the expected distance is E[dis(τ 0 , τpw )] = .112 × 2 + .168 × 2 + .048 × 4 + .072 × 4 + .168 × 2 + .252 × 0 + .072 × 4 + .108 × 2. We first show that a Con-Topk answer under symmetric difference is equivalent to PT(h)(k), a special case of PRFω . Then, we generalize the result and show that any
A Unified Approach to Ranking in Probabilistic Databases
15
PRFω function is equivalent to some Con-Topk answer under a suitably defined distance function that generalizes symmetric difference. This new connection further justifies the semantics of PRFω from an optimization point of view in that the PRFω top-k answer minimizes the expected value of some distance function, and it may shed some light on designing the weight function for PRFω in particular applications. 6.1 Symmetric Difference and PT-k Ranking Function Recall PT(h)(k) query returns k tuples with the largest Pr(r(t) ≤ k) values. We show that the answer returned is the Con-Topk under symmetric difference metric dis∆ where dis∆ (τ1 , τ2 ) = |τ1 ∆τ2 | = |(τ1 \τ2 ) ∪ (τ2 \τ1 )|.5 For ease of notation, we let Pr(r(t) > i) includes the probability that t’s rank is larger than i and that t doesn’t exist. We use the symbol τ to denote a top-k ranked list. We use τ (i) to denote the ith item in the list τ for positive integer i, and τ (t) to denote the position of t ∈ T in τ . Theorem 2 If τ = {τ (1), τ (2), . . . , τ (k)} is the set of k tuples with the largest Pr(r(t) ≤ k), then τ is the ConTopk answer under metric dis∆ , i.e., the answer minimizes E[dis∆ (τ, τpw )]. Proof Given a τ , we write E[dis∆ (τ, τpw )] as follows: E [dis∆ (τ, τpw )] = E
hX
i
δ (t ∈ τ ∧ t ∈ / τpw ) + δ (t ∈ τpw ∧ t ∈ / τ)
t∈T
=
X
E[δ (t ∈ τpw )] +
X
Pr(r(t) ≤ k) +
X
X
Pr(r(t) > k)
Pr(r(t) ≤ k) − 2
X
Pr(r(t) ≤ k)
t∈τ
t∈T
The first two terms are invariant with respect to τ . Therefore, it is clear that the set of k tuples with the largest Pr(r(t) ≤ k) minimizes the expectation. � 6.2 Weighted Symmetric Difference and PRFω We present a generalization of Theorem 2 that shows the equivalence between any PRFω function and Con-Topk under weighted symmetric difference distance functions which generalize the symmetric difference. Suppose ω is a positive function defined on Z+ and ω(i) = 0∀i > k. Definition 5 The weighted symmetric difference with weight ω of two top-k answers τ1 and τ2 is defined to be disω (τ1 , τ2 ) =
k X
ω(i)δ(τ2 (i) ∈ / τ1 ).
i=1 5
Theorem 3 Suppose ω is a positive function defined on Z+ and ω(i) = 0∀i > k. If τ = {τ (1), τ (2), . . . , τ (k)} is the set of k tuples with the largest Υω (t) values, then τ is the Con-Topk answer under the weighted symmetric difference disω , i.e., the answer minimizes E[disω (τ, τpw )]. Proof The proof mimics the one for Theorem 2. Suppose τ is fixed. We can write E[disω (τ, τpw )] as follows: E [disω (τ, τpw )] = E
hX
i
ω (τpw (t))δ (t ∈ τpw ∧ t ∈ / τ)
t∈T
=
X
E[ω (τpw (t))δ (t ∈ τpw )]
t∈T \τ
=
k X X
ω (i) Pr(r(t) = i) =
t∈T \τ i=1
X
Υω (t)
t∈T \τ
Therefore, it is clear that the set of k tuples with the largest Υω (t) values minimizes the above quantity. � Although the weighted symmetric difference appears to be a very rich class of distance functions, its relationship with other well studied distance functions, such at Spearman’s rho and Kendall’s tau, is still not well understood. We leave it as an interesting open problem.
t∈τ
t∈T \τ
=k+
E[δ (t ∈ / τpw )]
t∈τ
t∈T \τ
=
X
Intuitively, if the ith item of τ2 can not be found in τ1 , we pay a penalty of ω(i) and the distance is just the total penalty. If ω is a decreasing function, the distance function captures the intuition that top ranked items should carry more weight. If ω is a constant function, it reduces to the ordinary symmetric difference distance. Note that disω is not necessarily symmetric.6 Now, we present the theorem which is a generalization of Theorem 2.
The result of this subsection has appeared in [41].
7 Bubble Sort-like Behavior of PRFe We have seen that PRFe (α) admits very efficient evaluation algorithms. We also suggest that the parameter α should be learned from samples or user feedback. In fact, we do so since we hold the promise that by changing the parameter α, PRFe can span a spectrum of rankings, and the true ranking should be part of this spectrum or close to some point in it. We provide empirical support for this claim shortly in the next section (Section 8). In this section, we make some interesting theoretical observations about PRFe , which help us further understand the behavior of PRFe itself. First, we observe that for α = 1, the PRFe ranking is equivalent to the ranking of tuples by their existence probabilities (PRFe value in that case is simply the total probability). On the other hand, when α approaches 0, PRFe tends to rank the tuples by their probabilities to be the top-1 answer, 6 Rigorously, a distance function (or metric) should satisfy positive definiteness, symmetry and triangle inequality. Here we abuse this term a bit.
16
J. Li, B. Saha, A. Deshpande
i.e., Pr(r(t) = 1). Thus, it is a natural question to ask how the ranking changes when we vary α from 0 to 1. Now, we prove the following theorem which gives an important characterization of the behavior of PRFe on tuple independent databases. Let τα denote the ranking obtained by PRFe (α). For simplicity, we ignore the possibility of ties and assume this ranking is unique. As two special cases, let τ0 and τ1 denote the rankings obtained by sorting the tuples in a decreasing Pr(r(t) = 1) and Pr(t) order, respectively. Theorem 4 1. If ti >τ0 tj (ti is ranked higher than tj in τ0 ) and ti >τ1 tj , then ti >τα tj any 0 ≤ α ≤ 1. 2. If ti >τ0 tj and ti τα tj for α < β and ti β.
a pair of adjacent tuples that are not in the right relative order initially. The number of swaps is exactly the number of reversed pairs. This is just like bubble sort! The only difference is that the order of those swaps may not be the same. In fact, if we think of h as a parameter of PT(h) and we vary h from 1 to n, the way the rank list changes is quite similar to the one for PRFe : On one extreme where h = 1, the rank list is τ0 , i.e., the tuples are sorted by Pr(r(t) = 1) and on the other extreme where h = n, the rank list is τ1 , i.e., the tuples are sorted by Pr(r(t) ≤ n) = Pr(t). However, PT(h) is only able to explore at most n different rankings (one for each h) “between” τ0 and τ1 , while PRFe may explore O(n2 ) of them.
8 Experimental Study
Proof Let Υα (ti ) be the PRFe (α) value of tuple ti . Then: � Y � � i Υα (ti ) = F (α) = 1 − Pr(t) + Pr(t)α Pr(ti )α. t∈Ti−1
Assume that i < j. Dividing Υα (tj ) by Υα (ti ), we get � Q Υα (tj ) t∈Tj−1 1 − Pr(t) + Pr(t)α �· ρj,i (α) = = Q Υα (ti ) t∈Ti−1 1 − Pr(t) + Pr(t)α =
j−1 � Pr(tj ) Y · 1 − Pr(tl ) + Pr(tl )α Pr(ti )
We conducted an extensive empirical study over several real and synthetic datasets to illustrate: (a) the diverse and conflicting behavior of different ranking functions proposed in the prior literature, (b) the effectiveness of our parameterized ranking functions, especially PRFe , at approximating other ranking functions, and (c) the scalability of our new Pr(tj ) generating functions-based algorithms for exact and approxPr(ti ) imate ranking. We discussed the results supporting (a) in Section 3.2. In this section, we focus on (b) and (c).
l=i
Notice that 1−Pr(t)+Pr(t)α is always non-negative and an increasing function of α. Therefore, ρj,i (α) is increasing in α. If i > j, the same argument show ρj,i (α) is decreasing in α. In either case, the ratio is monotone in α. If ρj,i (0) < 1 and ρj,i (1) < 1, then ρj,i (α) < 1 for all 0 < α ≤ 1. Therefore, the first half of the theorem holds. If ρj,i (0) < 1 and ρj,i (1) > 1, then there is exactly one point 0 < β < 1 such that ρj,i (β) = 1, ρj,i (α) < 1 for all 0 < α < β, and ρj,i (α) > 1 for all β < α ≤ 1. This proves the second half. � Some nontrivial questions can be immediately answered by the theorem. For example, one may ask: “Is it possible that we get some ranking τ1 , increase α a bit and get another ranking τ2 , and increase α further and get τ1 back?”, and we can quickly see that the answer is no; if two tuples change positions, they never change back. Another observation we can make is that: if t1 dominates t2 (i.e., t1 has a higher score and probability), then t1 always ranks above t2 for any α (this is because t1 ranks above t2 in both τ0 and τ1 ). Interestingly, the way the ranking changes as α is increased from 0 to 1 is reminiscent of the execution of the bubble sort algorithm. We assume the true order of the tuples is τ1 and the initial order is τ0 . We increase α from 0 to 1 gradually. Each change in the ranking is just a swap of
Datasets: We mainly use the International Ice Patrol (IIP) Iceberg Sighting Dataset7 for our experiments. This dataset was also used in prior work on ranking in probabilistic databases [27, 32]. The database contains a set of iceberg sighting records, each of which contains the location (latitude, longitude) of the iceberg, and the number of days the iceberg has drifted, among other attributes. Detecting the icebergs that have been drifting for long periods is crucial, and hence we use the number of days drifted as the ranking score. The sighting record is also associated with a confidence-level attribute according to the source of sighting: R/V (radar and visual), VIS (visual only), RAD (radar only), SAT-LOW (low earth orbit satellite), SATMED (medium earth orbit satellite), SAT-HIGH (high earth orbit satellite), and EST (estimated). We converted these seven confidence levels into probabilities 0.8, 0.7, 0.6, 0.5, 0.4, 0.3, and 0.4 respectively. We added a very small Gaussian noise to each probability so that ties could be broken. There are nearly a million records available from 1960 to 2007; we created 10 different datasets for our experimental study containing 100, 000 (IIP-100,000) to 1, 000, 000 (IIP1,000,000) records, by uniformly sampling with replacement from the original dataset. Along with the real datasets, we also use several synthetic datasets with varying degrees of correlations, where the correlations are captured using probabilistic and/xor 7
http://nsidc.org/data/g00807.html
A Unified Approach to Ranking in Probabilistic Databases
trees. The tuple scores (for ranking) were chosen uniformly at random from [0, 10000]. The corresponding and/xor trees were also generated randomly starting with the root, by controlling the height (L), the maximum degree of the non-root ∨ and ∧ nodes (X/A) in nodes (d), and the proportion of the tree. Specifically, we use five such datasets: 1. 2. 3. 4. 5.
Syn-IND (independent tuples) Syn-XOR (L=2,X/A=∞,d=5) Syn-LOW (L=3,X/A=10,d=2) Syn-MED (L=5,X/A=3,d=5) Syn-HIGH (L=5,X/A=1,d=10)
For Syn-IND, the tuple existence probabilities were chosen uniformly at random from [0, 1]. Note that the Syn∧ nodes, exhibits XOR dataset, with height set to 2 and no only mutual exclusivity correlations (mimicking the x-tuples model [47, 53]), whereas the latter three datasets exhibit increasingly more complex correlations. Setup: We use the normalized Kendall distance (Section 3.2) for comparing two top-k rankings. All the algorithms were implemented in C++, and the experiments were run on a 2.4GHz Linux PC with 2GB memory.
8.1 Approximability of Ranking Functions We begin with a set of experiments illustrating the effectiveness of our parameterized ranking functions at approximating other ranking functions. We focus on PRFe here because it is much faster to rank according to a PRFe function (or a linear combination of several PRFe functions) than it is to rank according to a PRFω function. Figures 6 (i) and (ii) show the Kendall distance between the top-100 answers computed using a specific ranking function and PRFe for varying values of α, for the IIP-100,000 and Syn-IND-1000 datasets. For better visualization, we plot i on the x-axis, where α = 1 − 0.9i . The reason behind this is that the behavior of the PRFe function changes rather drastically, and spans a spectrum of rankings, when α approaches 1. First, as we can see, the PRFe ranking is close to ranking by Score alone for small values of α, whereas it is close to the ranking by Probability when α is close to 1 (Section 7). Second, we see that, for all other functions (E-Score, PT(h), U-Rank, E-Rank), there exists a value of α for which the distance of that function to PRFe is very small, indicating that PRFe can indeed approximate those functions quite well. This “uni-valley” behavior of the curves justifies the binary search algorithm we advocate for learning the value of α in Section 5.2. Our experiments with other synthetic and real datasets indicated a very similar behavior by the ranking functions. Next we evaluate the effectiveness of our approximation technique presented in Section 5.1. In Figure 6 (iii),
17
we show the Kendall distance between the top-k answers obtained using PT(h) (for h = 1000, k = 1000) and using a linear combination of PRFe functions found by our algorithms. As expected, the approximation using the vanilla DFT technique is very bad, with the Kendall distance close to 0.8 indicating little similarity between the top-k answers. However, the approximation obtained using our proposed algorithm (indicated by DFT+DF+IS+ES curve) achieves a Kendall distance of less than 0.1 with just L = 20 exponentials. In Figure 6 (iv), we compare the approximation quality (found by our algorithm DFT+DF+IS+ES) for three ranking functions for two datasets: IIP-100,000 and IIP-1,000,000 dataset with k = 1000. The ranking functions we compared were: (1) PT(h) (h = 1000), (2) an arbitrary smooth function, sf unc, (see Figure 5(iii)), and (3) a linear function (Figure 5(ii)). We see that L = 40 suffices to bring the Kendall distance to < 0.1 in all cases. We also observe that smooth functions (for which the absolute value of the first derivative of the underlying continuous function is bounded by a small value) are usually easier to approximate. We only need L = 20 exponentials to achieve a Kendall distance less than 0.05 for sf unc. The Linear function is even easier to approximate. We also tested a few other continuous functions such as piecewise linear function and f (x) = 1/x, and found similar behavior. We omit those curves for brevity. 8.2 Learning Ranking Functions Next we consider the issue of learning ranking functions from user preferences. Lacking real user preference data, we instead assume that the user ranking function, denoted user-func, is identical to one of: E-Score, PT(h), U-Rank, E-Rank, or PRFe (α = 0.95). We generate a set of user preferences by ranking a random sample of the dataset using user-func (thus generating five sets of user preferences). These are then fed to the learning algorithm, and finally we compare the Kendall distance between the learned ranking and the true ranking for the entire dataset. In Figure 7(i), we plot the results for learning a single PRFe function (i.e., for learning the value of α) using the binary search-like algorithm presented in Section 5.2. The experiment reveals that when the underlying ranking is done by PRFe , the value of α can be learned perfectly. When one of PT(h) or U-Rank is the underlying ranking function, the correct value a can be learned with a fairly small sample size, and increasing the number of samples does not help in finding a better α. On the other hand, E-Rank cannot be learned well by PRFe unless the sample size approaches the total size of whole dataset. This phenomenon can be partly explained using Figure 6(i) in which the curves for PT(h) and U-Top have a fairly smooth valley, while the one for E-Rank is very sharp and the region of α values where the
18
J. Li, B. Saha, A. Deshpande
0.4
0.2
0.0
0.8
Score Prob Exp-score PT(100) U-rank Exp-rank UTop-k
0.6
0.4
0.2
0.0 0
50
100
150
200
Kendall Distance
0.6
DFT DFT+DF DFT+DF+IS DFT+DF+IS+ES
1.0
Kendall Distance
Score Prob Exp-score PT(100) U-rank Exp-rank UTop-k
Kendall Distance
1.0
0.8
0.5
0.0 0
50
100
150
PT(1000) (n=100000,k=1000) PT(1000) (n=1000000,k=1000) sfunc (n=100000,k=1000) sfunc (n=1000000,k=1000) Linear(n=100000,k=1000) Linear(n=1000000,k=1000)
0.2
0.1
0.0
200
50
100
150
200
50
100
150
200
#terms : L i i Approximating with PRF-e (a=1-0.9^i): (i) IIP-100000, k=100; (ii) Syn-IND-1000, k=100; (iii) Approximating PT(1000)-1000 (n=100000); (iv) No. of Terms vs Approximation Quality #terms : L
Fig. 6 (i, ii) Comparing PRFe with other ranking functions for varying values of α; (iii) Approximating PT(1000) using a linear combination of PRFe functions; (iv) Approximation quality for three ranking functions for varying number of exponentials.
0.0
0.6
Kendall Distance
0.5
1.0 PT(100) PRF-e (alpha=0.95) EXP-score U-rank EXP-rank
0.8
0.4 0.2 0.0
1000
10000
100000
1.0
x-tuples (Syn-XOR) Low Correlation (Syn-LOW) Medium Correlation (Syn-MED) High Correlation (Syn-HIGH)
0.8
Kendall Distance
1.0 PT(100) PRF-e (alpha=0.95) Exp-score U-rank Exp-rank
Kendall Distance
Kendall Distance
1.0
0.6 0.4 0.2 0.0
0
50
100
150
200
0.8
PRF-e (alpha=0.9) PT(100) U-rank
0.6 0.4 0.2 0.0
0.0
0.2
0.4
0.6
0.8
1.0
Syn-LOW
Syn-MED
Syn-HIGH
# Samples
# Samples
alpha
Dataset
(i) Learning PRF-e (n=100000,k=100)
(ii) Learning PRF-w (n=100000,k=100)
(iii) Effect of correlation
(iv) Effect of correlation
Fig. 7 (i) Learning PRFe from user preferences; (ii) Learning PRFω from user preferences; (iii) Effect of correlations on PRFe ranking as a varies; (iv) Effect of correlations on PRFe , U-Rank and PT(h).
40 30
Execution Time (sec)
PRF-e (alpha=0.95) PT(100) U-rank Exp-rank Top-10 Top-50 Top-100
20 10 0
PT(10000),k=10000 PT(1000),k=1000 w100 1000 w50 w20
Execution Time (sec)
50
Execution Time (sec)
Kendall Distance
1.0
1000
100
10
1 0
200000
400000
600000
800000 1000000
Number of tuples (i)
Syn-HIGH, PT(1000) Syn-XOR, PT(1000) Syn-HIGH, w50 Syn-XOR, w50 Syn-HIGH, w20 Syn-XOR, w20 Syn-HIGH, PRF-e Syn-XOR, PRF-e
100
10
1
0 0
200000
400000
600000
Number of tuples (ii)
800000
1000000
0
20000
40000
60000
80000
100000
Number of tuples (iii) k=1000
Fig. 8 Experiments comparing the execution times of the ranking algorithms (note that the y-axis is log-scale for (ii) and (iii))
distance is low is extremely small ([1 − 0.990 , 1 − 0.9110 ]). Hence, the minimum point for E-Rank is harder to reach. Further, E-Rank is quite sensitive to the size of the dataset, which makes it hard to learn it using a smaller-sized sample dataset. We also observe that while extremely large samples are able to learn E-Score well, the behavior of E-Score is quite unstable when the sample size is smaller. If we already know the form of the ranking function, we do not need to learn it in this fashion; we can instead directly find an approximation for it using our DFT-based algorithm. In Figure 7 (ii), we show the results of an experiment where we tried to learn a PRFω function (using the SVM-lite package [33]). We keep our sample size ≤ 200. SVM-lite runs very fast within such sample size but becomes drastically slow with larger ones. For example, with 100 samples, it terminates within one second while 300 samples may take up to several minutes. First we observe that PT(h) and PRFe can be learned very well from a small size sample (distance < 0.2 in most
cases) and increasing the sample size does not benefit significantly. U-Rank can also be learned, but the approximation isn’t nearly as good. This is because U-Rank can not be written as a single PRFω function. We observed similar behavior in our experiments with other datasets. The issues in learning such weighted functions have been investigated in prior literature, and if the true ranking function can be written as a PRFω function, then the above algorithm is expected to learn it given a reasonable number of samples.
8.3 Effect of Correlations Next we evaluate the behavior of ranking functions over probabilistic datasets modeled using probabilistic and/xor trees. We use the four synthetic correlated datasets, SynXOR, Syn-LOW, Syn-MED, and Syn-HIGH, for these experiments. For each dataset and each ranking function considered, we compute the rankings by considering the corre-
A Unified Approach to Ranking in Probabilistic Databases
lations, and by ignoring the correlations, and then compute the Kendall distance between these two (e.g., for PRFe , we compute the rankings using PROB-ANDOR-PRF-RANK and IND-PRF-RANK algorithms). Figure 7(iii) shows the results for the PRFe ranking function for varying α, whereas in Figure 7(iv), we plot the results for PRFe (α = 0.9), PT(100), and U-Rank. As we can see, on highly correlated datasets, ignoring the correlations can result in significantly inaccurate top-k answers. This is not as pronounced for the Syn-XOR dataset. This is because, in any group of tuples that are mutually exclusive, there are typically only a few tuples that may have sufficiently high probabilities to be part of the top-k answer; the rest of the tuples may be ignored for ranking purposes. Because of this, assuming tuples to be independent of each other does not result in significant errors. As α approaches 1, PRFe tends to sort the tuples by probabilities, so all four curves in Figure 7(iii) become close to 0. Ranking by E-Score is invariant to the correlations, which is a significant drawback of that function. 8.4 Execution Times Figure 8(i) shows the execution times for four ranking functions: PRFe , PT(h), U-Rank and E-Rank, for the IIPdatasets, for different dataset sizes and k. We note that the running time for PRFω is similar to that of PT(h). As expected, ranking by PRFe or E-Rank is very efficient (1000000 tuples can be ranked within 1 or 2 seconds). Indeed, after sorting the dataset in an non-decreasing score order, PRFe needs only a single scan of the dataset, and ERank needs to scan the dataset twice. Execution times for P T (h) and U-Rank-k increase linearly with h and k respectively and the algorithms become very slow for high h and k. The running times of both PRFe and E-Rank are not significantly affected by k. Figure 8(ii) compares the execution time for PT(h) and its approximation using a linear combination of PRFe functions (see Figure 6(iii)), for two different values of k. The notation w50 indicates that 50 exponentials were used in the approximation (note that the approximate ranking, based on PRFe , is insensitive to the value of k). As we can see, for large datasets and for higher values of k, exact computation takes several orders of magnitude more time to compute than the approximation. For example, the exact algorithm takes nearly 1 hour for n = 500, 000 and h = 10, 000 while the approximate answer obtained using L = 50 PRFe functions takes only 24 seconds and achieves a Kendall distance 0.09. For correlated datasets, the effect is even more pronounced. In Figure 8(iii), we plot the results of a similar experiment, but using two correlated datasets: Syn-XOR and Syn-HIGH. Note that the number of tuples in these datasets is smaller by a factor of 10. As we can see, our generating functions-based algorithms for computing PRFe are highly
19
efficient, even for datasets with high degrees of correlation. As above, approximation of the PT(h) ranking function using a linear combination of PRFe functions is significantly cheaper to compute than using the exact algorithm. Combined with the previous results illustrating that a linear combination of PRFe functions can approximate other ranking functions very well, this validates the unified ranking approach that we propose in this article.
9 PRF Computation for Arbitrary Correlations Among many models for capturing the correlations in a probabilistic database, graphical models (Markov or Bayesian networks) perhaps represent the most systematic approach [48]. The appeal of graphical models stems both from the pictorial representation of the dependencies, and a rich literature on doing inference over them. In this section, we present an algorithm for computing the PRF function values for all tuples of a correlated dataset when the correlations are represented using a graphical model. The resulting algorithm is a non-trivial dynamic program over the junction tree of the graphical model. Our main result is that we can compute the PRF function in polynomial time if the junction tree of the graphical model has bounded treewidth. Further, although this exact algorithm may not be feasible for large datasets or for high-treewidth graphical models (in which case approximations should be pursued), it is quite practical for small-treewidth graphical models (e.g., it runs in O(n3 ) time over a Markov sequence [34, 36, 46]). It is worth noting that this result can not subsume our algorithm for and/xor trees (Section 4.2) since the treewidth of the moralized graph of a probabilistic and/xor tree may not be bounded. In some sense, this is close to instance-optimal since the complexity of the underlying inference problem is itself exponential in the treewidth of the graphical model (this however does not preclude the possibility that the ranking itself could be done more efficiently without computing the PRF function explicitly – however, such an algorithm is unlikely to exist).
9.1 Definitions We start with briefly reviewing some notations and definitions related to graphical models and junction trees. Let T = {t1 , t2 , . . . , tn } be the set of tuples in DT , sorted in an non-increasing order of their score values. For each tuple t in T , we associate an indicator random variable Xt , which is 1 if t is present, and 0 otherwise. Let X = {Xt1 , . . . , Xtn } and Xi = {Xt1 , . . . , Xti }. For a set of variables S, we use Pr(S) to denote the joint probability distribution over those variables. So Pr(X ) denotes the joint probability distribution that we are trying to reason about. This joint distribution captures all the correlations in the dataset. However, directly
20
trying to represent it would take O(2n ) space, and hence is clearly infeasible. Probabilistic graphical models allow us to represent this joint distribution compactly by exploiting the conditional independences present among the variables. Given three disjoint sets of random variables A, B, C, we say that A is conditionally independent of B given C if and only if: Pr(A, B|C) = Pr(A|C) Pr(B|C)
J. Li, B. Saha, A. Deshpande X1 X5
X4
X3 X2
(i) X5
X4
Pr(X5, X4)
X4
X3
Pr(X4, X3)
X3
X1
Pr(X3, X1)
0 0 1 1
0 1 0 1
0.3 0.2 0.2 0.3
0 0 1 1
0 1 0 1
0.1 0.4 0.3 0.2
0 0 1 1
0 1 0 1
0.1 0.3 0.4 0.2
X3
X2
Pr(X3, X2)
0 0 1 1
0 1 0 1
0.1 0.3 0.5 0.1
X5X4
X4
X3X1 X3
X4X3 X3
We assume that we are provided with a junction tree over the variables X that captures the correlations among them. A junction tree can be constructed from a graphical model using standard algorithms [31]. Recently junction trees have also been used as a internal representation for probabilistic databases, and have been shown to be quite effective at handling lightly correlated probabilistic databases [35]. We describe the key properties of junction trees next. Junction tree: Let T be a tree with each node v associated with a subset Cv ⊆ X . We say T is a junction tree if any intersection Cu ∩Cv for any u, v ∈ T is contained in Cw for every node w on the unique path between u and v in T (this is called the running intersection property). The treewidth tw of a junction tree is defined to be maxv∈T |Cv | − 1. Denote Su,v = Cv ∩ Cu for each edge (u, v) ∈ T . We call Su,v a separator since removal of Su,v disconnects the graphical model. The set of conditional independences embodied by a junction tree can be found using the Markov property: (Markov Property) Given variable sets A, B, C, if C separates A and B (i.e., removal of variables in C disconnects the variables in A from variables in B in the junction tree), then A is conditionally independent of B given C. Example 8 Let T = {t1 , t2 , t3 , t4 , t5 }. Figure 9 (i) and (ii) show the (undirected) graphical model and the corresponding junction tree T . T has four nodes: C1 = {Xt4 , Xt5 }, C2 = {Xt4 , Xt3 }, C3 = {Xt3 , Xt1 } and C4 = {Xt3 , Xt2 }. The treewidth of T is 1. We have, S1,2 = {X4 }, S2,3 = {X3 } and S2,4 = {X3 }. Using the Markov property, we observe that X5 is independent of X1 , X2 , X3 given X4 . Clique and Separator Potentials: With each clique Cv in the junction tree, we associate a potential πv (Cv ), which is a function over all variables Xti ∈ Cv and captures the correlations among those variables. Similarly, with each separator Su,v , we associate a potential µu,v (Su,v ). Without loss of generality, we assume that the potentials are calibrated, i.e., the potential corresponding to a clique (or a separator) is exactly the joint probability distribution over the variables in that clique (separator). Given a junction tree with arbitrary potentials, calibrated potentials can be computed using a standard message passing algorithm [31]. The complexity
X3X2
(ii)
Fig. 9 (i) A graphical model; (ii) A junction tree for the model along with the (calibrated) potentials.
of this algorithm is O(n2tw ). Then the joint probability distribution of X , whose correlations can be captured using a calibrated junction tree T , can be written as: Q Q Pr(Cv ) v∈T πv (Cv ) Pr(X ) = Q = Q v∈T (u,v)∈T µu,v (Su,v ) (u,v)∈T Pr(Su,v )
9.2 Problem Simplification We begin with describing the first step of our algorithm, and defining a reduced and simpler to state problem. RecallP that our goal is to rank the tuples according to Υ (ti ) = j>0 ω(j) Pr(r(ti ) = j). For this purpose, we first compute the positional probabilities, Pr(r(ti ) = j) ∀j ∀ti , using the algorithms presented in the next two subsections. Given those, the values of Υ (ti ) can be computed in O(n2 ) time for all tuples, and the ranking itself can be done in O(n log n) time (by sorting). The positional probabilities (P r(r(ti ) = j)) may also be of interest by themselves. For each tuple ti , we compute Pr(r(ti ) = j) ∀j at once. Recall that Pr(r(ti ) = j) is the probability that ti exists (i.e., Xi = 1) and exactly j − 1 tuples with scores higher Pi−1 than ti are present (i.e., l=1 Xl = j − 1). In other words: Pr(r(ti ) = j) = Pr(Xi = 1 ∧
i−1 X
Xl = j − 1)
l=1 i−1 X = Pr(( Xl = j − 1)|Xi = 1) Pr(Xi = 1) l=1
Hence, we begin with first conditioning the junction tree by setting Xi = 1, and re-calibrating. This is done by identifying all cliques and separators which contain Xi , and by updating the corresponding probability distributions by removing the values corresponding to Xi = 0. More precisely, we replace a probability distribution Pr(Xi1 , . . . , Xik , Xi ),
A Unified Approach to Ranking in Probabilistic Databases
21 X3X1
by a potential π(Xi1 , . . . , Xik ) computed as: π(Xi1 = v1 , . . . , Xik = vk )
X5
= Pr(Xi1 = v1 , . . . , Xik = vk , Xi = 1)
X3
X3X2
π is not a probability distribution since the entries in it may not sum up to 1. Further, the potentials may not be consistent with each other. Hence, we need to recalibrate this junction tree using message passing [31]. As mentioned earlier, this takes O(n2tw ) time. Figure 10 shows the resulting (uncalibrated) junction tree after conditioning on X5 = 1.
Fig. 11 Conditioning on X4 = 1 results in two junction trees.
bution over Pr(P1 + · · · + Pk ). This can be done by repeatedly applying the following general formula: Pr(P1 + P2 = a) =
a X
Pr(P1 = j) Pr(P2 = a − j)
j=0 X5
X4
0 0 1 1
0 1 0 1
π(X4) 0.3 0.2 0.2 0.3
X5X4
X4
X3
0 0 1 1
0 1 0 1
X4
π(X4, X3) 0.1 0.4 0.3 0.2
X3X1 X3
X4X3 X3
X3X2
X3
X1
0 0 1 1
0 1 0 1
X3
X2
0 0 1 1
0 1 0 1
π(X3, X1) 0.1 0.3 0.4 0.2
π(X3, X2) 0.1 0.3 0.5 0.1
Fig. 10 Conditioning on X5 = 1 results in a smaller junction tree, with uncalibrated potentials, that captures the distribution over X1 , X2 , X3 , X4 given X5 = 1.
If Xi is a separator in the junction tree, then we get more than one junction tree after conditioning on Xi = 1. Figure 11 shows the two junction trees we would get after conditioning on X4 = 1. The variables in these junction trees are independent of each other (this follows from the Markov property), and the junction trees can be processed separately from each other. Since the resulting junction tree or junction trees capture the probability distribution conditioned on the event Xi = 1, our problem Pi−1now reduces to finding the probability distribution of l=1 Xl in those junction trees. For cleaner description of the algorithm, we associate an indicator variable δXl with each variable Xl in the junction tree. δXl is set to 1 if l ≤ i − 1, and is 0 otherwise. This allows us to state the key problem to be solved as follows: Redefined Problem8 : Given a junction tree over m binary variables Y1 , . . . , Ym , where each variable Yj is associated with an indicator variable δYj ∈ {0, 1}, find Pmthe probability distribution of the random variable P = l=1 Yl δl . If the result of the conditioning was a single junction tree (over m = n − 1 variables), we multiply the resulting probabilities by Pr(Xi = 1) to get the rank distribution of ti . However, if we get k > 1 junction trees, then we need one additional step. Let P1 , . . . , Pk be the random variables denoting the partial sums for each of junction trees. We need to combine the probability distributions over these partial sums, Pr(P1 ), . . . , Pr(Pk ), into a single probability distri8
We rename the variables to avoid confusion.
A naive implementation of the above takes time O(n2 ). Although this can be improved using the ideas presented in Appendix B, the complexity of computing Pr(Pi ) is much higher and dominates the overall complexity.
9.3 Algorithm for Markov Sequences We first describe an algorithm for Markov chains, a special, yet important, case of the graphical models. Markov chains appear naturally in many settings, and have been studied in probabilistic database literature as well [34, 36, 46]. Any finite-length Markov chain is a Markov network whose underlying graph is simply a path: each variable is directly dependent on only its predecessor and successor. The junction tree for a Markov chain is also a path in which each node corresponds to an edge of the Markov chain. The treewidth of such a junction tree is one. Without loss of generality, we assume that the Markov chain is Y1 , . . . , Ym (Figure 12(i)). The corresponding junction tree T is a path with cliques Cj = {Yj , Yj+1 } as shown in the figure. Pm We compute the distribution Pr( l=1 Yl δl ) recursively. Pj Let Pj = l=1 Yl δl denote the partial sum over the first j variables Y1 , . . . , Yj . At the clique {Yj−1 , Yj }, j ≥ 1, we recursively compute the joint probability distribution: Pr(Yj , Pj−1 ). The initial distribution Pr(Y2 , P1 ), P1 = δ1 Y1 , is computed directly: Pr(Y2 , P1 = 0) = Pr(Y2 , Y1 = 0) + (1 − δi ) Pr(Y2 , Y1 = 1) Pr(Y2 , P1 = 1) = δi Pr(Y2 , Y1 = 1). Given Pr(Yj , Pj−1 ), we compute Pr(Yj+1 , Pj ) as follows. Observe that Pj−1 and Yj+1 are conditionally independent given the value of Yj (by Markov property). Thus we have: Pr(Yj+1 , Yj , Pj−1 ) =
Pr(Yj+1 , Yj ) Pr(Yj , Pj−1 ) Pr(Yj )
Using Pr(Yj+1 , Yj , Pj−1 ), we can compute: Pr(Yj+1 , Pj = a) = Pr(Yj+1 , Yj = 0, Pj−1 = a) + Pr(Yj+1 , Yj = 1, Pj−1 = a − δj )
22
J. Li, B. Saha, A. Deshpande Y1
.......
Y2
Ym-1
Ym
A Markov Chain Pr(Ym-1,Pm-2)
Pr(Y2,P1)
Y1Y2
Y2Y3
Y2
.......
Pr(Ym,Pm-1)
Ym-1Ym
Ym-1
Let Z = C \ S. We observe that Z is precisely the set of variables that contribute to the partial sum PS , but do not contribute to any of the partial sums PS1 , . . . , PSk , i.e.: X PS = PS1 + · · · + PSk + δZi Zi Zi ∈Z
Corresponding Junction Tree
We begin with computing Pr(C, PS1 + · · · + PSk ). Observe that the variable set C \ S1 is independent of PS1 given the values of the variables in S1 (by Markov property). Note that it was critical that the variables in S1 not contribute to the partial sum PS1 , otherwise this independence would not hold. Given that, we have:
(i)
Pr(S,PS)
TS
S
C Pr(S1,PS1)
S1
.......
S2
Pr(Sk,PSk)
Sk
(ii) Fig. 12 (i) A Markov chain, and the corresponding junction tree; (ii) Illustrating the recursion for general junction trees.
At the end, we have the joint distribution: Pr(Ym , Pm−1 ). We can compute a distribution over Pm as: Pr(Pm = a) = Pr(Ym = 0, Pm−1 = a) + Pr(Ym = 1, Pm−1 = a − δm ) Complexity: The complexity of the above algorithm to compute Pr(Pm ) is O(m2 ) – although we only perform m steps, Pr(Yj+1 , Pj ) contains 2(j + 1) terms, each of which takes O(1) time to compute. Since we have to repeat this for every tuple, the overall complexity of ranking the dataset can be seen to be O(n3 ).
Pr(C, PS1 ) = Pr(C \ S1 , S1 , PS1 ) Pr(C \ S1 , S1 ) Pr(S1 , PS1 ) = Pr(S1 ) Using PS2 is independent of C ∪ {PS1 } given S2 , we get: Pr(C, PS1 , PS2 ) =
Pr(C, PS1 ) Pr(S2 , PS2 ) Pr(S2 )
Now we can compute the probability distribution over Pr(C, PS1 + PS2 ) as follows: Pr(C, PS1 + PS2 = a) =
a X
Pr(C, PS1 = j, PS2 = a − j )
j =0
=
a X Pr(C, PS1 = j ) Pr(S2 , PS2 = a − j ) Pr(S2 ) j =0
By repeating this process for S3 to Sk , we get the probability distribution: Pr(C, PS1 + · · · + PSk ). Next, we need to add in the contributions of the variables in Z to the partial sum PS1 + · · · + PSk . Let Z contain l variables, Z1 , . . . Zl , and let δZ1 , . . . , δZl denote the corresponding indicator variables. It is easy to see that:
9.4 General Junction Trees We follow the same general idea for general junction trees. Let T denote the junction tree over the variables Y = {Y1 , . . . , Ym }. We begin by rooting T at an arbitrary clique, and recurse down the tree. For a separator S, let TS denote the subtree rooted at S. Denote by PS the partial sum over the variables in the subtree TS that are not present in S, i.e.,: X PS = δj Xj j∈TS ,j ∈S /
Consider a clique node C, and let S denote the separator between C and its parent node (S = φ for the root clique node). We will recursively compute the joint probability distribution Pr(S, PS ) for each such separator S. Since the root clique node has no parent, at the end we are left withP precisely the probability distribution that we need, m i.e., Pr( j=1 Yi δi ). C is an interior or root node: Let the separators to the children of C be S1 , . . . , Sk (see Figure 12(ii)). We recursively compute Pr(Si , PSi ), i = 1, . . . , k.
Pr(C \ Z, Z1 = v1 , . . . , Zk = vk ,
k X
PSj +
j =1
= Pr(C \ Z, Z1 = v1 , . . . , Zk = vk ,
k X j =1
l X
δzj Zj = a)
j =1
PSj = a −
l X
δzj Zj )
l=1
where vi ∈ {0, 1}. Although it looks complex, we only need to touch every entry of the probability distribution Pr(C, P1 + · · · + Pk ) once to compute Pr(C, PS ). All that remains is marginalizing that distribution to sum out the variables in C \ S, giving us Pr(S, PS ). C is a leaf node (i.e., k = 0): This is similar to the final step above. Let Z = C \ S denote the variables that contribute to the partial sum PS . We can apply the same procedure as P above to compute Pr(C, PS = Zi ∈Z δZi Zi ), which we marginalize to obtain Pr(S, PS ). Overall Complexity: The complexity of the above algorithm for a specific clique C is dominated by the cost of computing the different probability distributions of the form Pr(C, P ), where P is a partial sum. We have to compute
A Unified Approach to Ranking in Probabilistic Databases
O(n) such probability distributions, and each of those computations takes O(n2 2|C| ) time. Since there are at most n cliques, and since we have to repeat this process for every tuple, the overall complexity of ranking the dataset can be seen to be: O(n4 2tw ), where tw denotes the treewidth of the junction tree, i.e., the size of the maximum clique - 1.
10 Conclusions In this article we presented a unified framework for ranking over probabilistic databases, and presented several novel and highly efficient algorithms for answering top-k queries. Considering the complex interplay between probabilities and scores, instead of proposing a specific ranking function, we propose using two parameterized ranking functions, called PRFω and PRFe , which allow the user to control the tuples that appear in the top-k answers. We developed novel algorithms for evaluating these ranking functions over large, possibly correlated, probabilistic datasets. We also developed an approach for approximating a ranking function using a linear combination of PRFe functions thus enabling highly efficient, albeit approximate computation, and also for learning a ranking function from user preferences. Our work opens up many avenues for further research. There may be other non-trivial subclasses of PRF functions, aside from PRFe , that can be computed efficiently. Understanding the behavior of various ranking functions and their relationships across probabilistic databases with diverse uncertainties and correlation structures also remains an important open problem in this area. Finally, the issues of ranking have been studied for many years in disciplines ranging from economics to information retrieval; better understanding the connections between that work and ranking in probabilistic databases remains a fruitful direction for further research.
References 1. E. Adar and C. Re. Managing uncertainty in social networks. IEEE Data Eng. Bull., 2007. 2. P. Andritsos, A. Fuxman, and R. J. Miller. Clean answers over dirty databases. In ICDE, 2006. 3. Y. Azar, I. Gamzu, and X. Yin. Multiple intents reranking. In STOC, pages 669–678, 2009. 4. N. Bansal, K. Jain, A. Kazeykina, and J. Naor. Approximation Algorithms for Diversified Search Ranking. ICALP, pages 273–284, 2010. 5. G. Beskales, M. Soliman, and I. IIyas. Efficient search for the top-k probable nearest neighbors in uncertain databases. VLDB, 2008. 6. G. Beylkin and L. Monzon. On approximation of functions by exponential sums. Applied and Computational Harmonic Analysis, 19:17–48, 2005.
23
7. A. Bjorck and V. Pereyra. Solution of vandermonde systems of equations. Mathematics of Computation, 24(112):893–903, 1970. 8. C. Burges, T. Shaked, E. Renshaw, A. Lazier, M. Deeds, N. Hamilton, and G. Hullender. Learning to rank using gradient descent. In ICML, pages 89–96, 2005. 9. R. Cheng, J. Chen, M. Mokbel, and C. Chow. Probabilistic verifiers: Evaluating constrained nearestneighbor queries over uncertain data. In ICDE, 2008. 10. R. Cheng, L. Chen, J. Chen, and X. Xie. Evaluating probability threshold k-nearest-neighbor queries over uncertain data. In EDBT, 2009. 11. R. Cheng, D. Kalashnikov, and S. Prabhakar. Evaluating probabilistic queries over imprecise data. In SIGMOD, 2003. 12. G. Cormode, F. Li, and K. Yi. Semantics of ranking queries for probabilistic data and expected ranks. In ICDE, 2009. 13. N. Dalvi and D. Suciu. Efficient query evaluation on probabilistic databases. In VLDB, 2004. 14. N. Dalvi and D. Suciu. Management of probabilistic data: Foundations and challenges. In PODS, 2007. 15. O. Dekel, C. Manning, and Y. Singer. Log-linear models for label-ranking. In NIPS 16, 2004. 16. A. Deshpande, C. Guestrin, and S. Madden. Using probabilistic models for data management in acquisitional environments. In CIDR, 2005. 17. X. L. Dong, A. Halevy, and C. Yu. Data integration with uncertainty. In VLDB, 2007. 18. C. Dwork, R. Kumar, M. Naor, and D. Sivakumar. Rank aggregation methods for the web. In WWW, 2001. 19. R. Fagin, R. Kumar, and D. Sivakumar. Comparing topk lists. In SODA, 2003. 20. N. Fuhr and T. Rolleke. A probabilistic relational algebra for the integration of information retrieval and database systems. ACM Trans. on Info. Syst., 1997. 21. T. Ge, S. Zdonik, and S. Madden. Top-k queries on uncertain data: On score distribution and typical answers. In SIGMOD, pages 375–388, 2009. 22. T. Green, G. Karvounarakis, and V. Tannen. Provenance semirings. In PODS, pages 31–40, 2007. 23. T. Green and V. Tannen. Models for incomplete and probabilistic information. In EDBT, 2006. 24. R. Gupta, S. Sarawagi. Creating probabilistic databases from information extraction models. In VLDB, 2006. 25. J. F. Hauer, C. J. Demeure, and L. L. Scharf. Initial results in prony analysis of power system response signals. IEEE Trans. on Power Systems, 5(1):80–89, 1990. 26. R. Herbrich, T. Graepel, P. Bollmann-Sdorra, and K. Obermayer. Learning preference relations for information retrieval. In ICML-98 Workshop: Text Categorization and Machine Learning, page 8084, 1998.
24
27. M. Hua, J. Pei, W. Zhang, and X. Lin. Ranking queries on uncertain data: A probabilistic threshold approach. In SIGMOD, 2008. 28. I. Ilyas, G. Beskales, and M. Soliman. A survey of top-k query processing techniques in relational database systems. ACM Computing Surveys, 2008. 29. K. J¨arvelin, J. Kek¨al¨ainen. Cumulated gain-based evaluation of ir techniques. ACM Trans. Inf. Syst., 2002. 30. T. S. Jayram, R. Krishnamurthy, S. Raghavan, S. Vaithyanathan, and H. Zhu. Avatar information extraction system. IEEE Data Eng. Bull., 29(1), 2006. 31. F. Jensen and F. Jensen. Optimal junction trees. In UAI, pages 360–366, 1994. 32. C. Jin, K. Yi, L. Chen, J. Xu Yu, X. Lin. Sliding-window top-k queries on uncertain streams. In VLDB, 2008. 33. T. Joachims. Optimizing search engines using clickthrough data. In Proc. SIGKDD, pages 133–142, 2002. 34. B. Kanagal and A. Deshpande. Efficient query evaluation over temporally correlated probabilistic streams. In ICDE, 2009. 35. B. Kanagal and A. Deshpande. Indexing correlated probabilistic databases. In SIGMOD, 2009. 36. B. Kimelfeld and C. R´e. Transducing markov sequences. In PODS, pages 15–26, 2010. 37. C. Koch. MayBMS: A System for Managing Large Uncertain and Probabilistic Databases. Managing and Mining Uncertain Data. Charu Aggarwal ed., 2009. 38. C. Koch and D. Olteanu. Conditioning probabilistic databases. PVLDB, 1(1):313–325, 2008. 39. H.P. Kriegel, P. Kunath, M. Renz. Probabilistic nearestneighbor query on uncertain objects. In DASFAA, 2007. 40. L. Lakshmanan, N. Leone, R. Ross, and V. S. Subrahmanian. Probview: a flexible probabilistic database system. TODS, 1997. 41. J. Li and A. Deshpande. Consensus answers for queries over probabilistic databases. PODS, 2009. 42. J. Li and A. Deshpande. Ranking continuous probabilistic datasets. In VLDB, 2010. 43. T. Y. Liu. Learning to Rank for Information Retrieval. Foundations and Trends in Information Retrieval, 3(3):225–331, 2009. 44. X. Liu, M. Ye, J. Xu, Y. Tian, and W. Lee. k-selection query over uncertain data. In DASFAA (1), pages 444– 459, 2010. 45. C. R´e, N. Dalvi, and D. Suciu. Efficient top-k query evaluation on probabilistic data. In ICDE, 2007. 46. C. R´e, J. Letchner, M. Balazinska, and D. Suciu. Event queries on correlated probabilistic streams. In SIGMOD Conference, 2008. 47. A. Sarma, O. Benjelloun, A. Halevy, and J. Widom. Working models for uncertain data. In ICDE, 2006. 48. P. Sen, A. Deshpande, and L. Getoor. PrDB: managing and exploiting rich correlations in probabilistic
J. Li, B. Saha, A. Deshpande
databases. VLDB J., 18(5):1065–1090, 2009. 49. M. Soliman, I. Ilyas, and K. C. Chang. Top-k query processing in uncertain databases. In ICDE, 2007. 50. M. Soliman and I. Ilyas. Ranking with uncertain scores. In ICDE, pages 317–328, 2009. 51. P. Talukdar, M. Jacob, M. Mehmood, K. Crammer, Z. Ives, F. Pereira, and S. Guha. Learning to create dataintegrating queries. PVLDB, 1(1):785–796, 2008. 52. J. Widom. Trio: A system for integrated management of data, accuracy, and lineage. In CIDR, 2005. 53. K. Yi, F. Li, D. Srivastava, G. Kollios. Efficient processing of top-k queries in uncertain databases. ICDE, 2008. 54. X. Zhang and J. Chomicki. On the semantics and evaluation of top-k queries in probabilistic databases. In DBRank, 2008. 55. O. Zuk, L. Ein-Dor, and E. Domany. Ranking under uncertainty. In UAI, pages 466–473, 2007.
A Proofs Proof (Theorem 1) Suppose T is rooted at r, r1 , . . . , rh are r’s children, and Tl is the subtree rooted at rl . We denote by S (or Sl ) the random set of leaves generated according to model T (or Tl ). We let F (or Fl ) be the generating function corresponding to T (or Tl ). For ease of notation, we use i to denote index vector hi1 , i2 , . . .i, I to deQ i note the set of all such is and X i to denote j xjj . Therefore, we can P P write F (X ) = i1 ,i2 ,... ci1 ,i2 ... xi11 xi22 . . . = i∈I ci X i . We use the ∼ i for some i = hi1 , i2 , . . .i ∈ I to denote the event that notation S = S contains ij leaves associated with variable xj for all j . Given the ∼ i). notations, we need to show ci = Pr(S = We shall prove by induction on the height of the and/xor tree. We ∧ node, we know from Definition 2 that consider two cases. If r is a ∼ S = ∪h l=1 Sl . First, it is not hard to see that P given Sl = il for 1 ≤ l ≤ ∼ i happens if and only if h, the event S = i = i . Therefore, l l ∼ i) = Pr(S =
h X Y P
∼ il ). Pr(Sl =
(7)
l il =i l=1
P Assume Fl can be written as il cl,il X il . From the construction of the generating function, we know that
F (X ) =
h Y
Fl =
h X� X Y i∈I
cl,il X il =
l=1 il ∈I
l=1
=
h X Y
P
h X� X Y i∈I
�
cl,il X i
cl,il X il
�
l il =i l=1
P
(8)
l il =i l=1
∼ il ) = cl,i for any l and il . By induction hypothesis, we have Pr(Sl = l P ∼ Therefore, we can conclude from (7) and (8) that F (X ) = i Pr(S = i)X i . ∨ node. From Now let us consider the other case where r is a Definition 2, it is not hard to see that ∼ i) = Pr(S =
h X l=1
Pr(Sl = i)p(r,rl )
(9)
A Unified Approach to Ranking in Probabilistic Databases Moreover, we have F (X ) =
h X
p(r,rl ) Fl (X ) =
l=1
=
p(r,rl )
l=1
h X�X i
h X
�
cl,il X il
il
p(r,rl ) cl,i X i =
l=1
X
X
∼ i)X i Pr(S =
25 1. Choose n + 1 different numbers x0 , ...., xn . 2. Evaluate the polynomial at these points, i.e., compute f (xi ). It is easy to see that each evaluation takes linear time (bottom-up over the tree). So this step takes O(n2 ) time in total. 3. Use any O(n2 ) polynomial interpolation algorithm to find the coefficient. In fact, the interpolation reduces to finding a solution for the following linear system:
i
where the last equality follows from (9) and induction hypothesis. This completes the proof. �
n−1 n−2 xn x0 . . . x0 1 cn 0 x0 x1 1 cn−1
n−1 n−2 xn x1 ... 1 x1 . . . .. .. ..
.. .
n−1 n−2 . . . xn xn xn n xn
B Expanding Polynomials This section is devoted to several algorithms for expanding polynomials into standard forms. Multiplication of a Set of Polynomials: Given a set of polynomials P in the form of Pi = j≥0 cij xj for 1 ≤ i ≤ k, we want to compute Qk the P = i=1 Pi written in the standard form P = P multiplication j j≥0 cj x , i.e., we need to compute the coefficients cj . Let d(Pi ) be P the degree of the polynomial Pi . Let n = ki d(Pi ) be the degree of P. Naive Method: First we note that the naive method (multiply Pi s one by one) gives usQan O(n2 ) time algorithm by simple Pcounting argument. Let P¯i = ij =1 Pj . It is easy to see d(P¯i ) = ij =1 d(Pi ). So the time to multiply P¯i and Pi+1 is O(d(P¯i ) · d(Pi+1 )). Then, we can see the total time complexity is: k− X1
O(d(P¯i ) · d(Pi+1 )) = O(n) ·
i=1
k− X1
d(Pi+1 ) = O(n2 ).
i=1
Divide-and-Conquer: Now, we show how to use divide-and-conquer and FFT (Fast Fourier Transformation) to achieve an O(n log2 n) time algorithm. It is well known that the multiplication of two polynomials of degree O(n) can be done in O(n log n) time using FFT. The divideand-conquer algorithm is as follows: If there exists any Pi such that Q d ( P ), we evaluate P d(Pi ) ≥ 1 j :j6=i i recursively and then multiply 3 it with Pi using FFT. IfQ not, we partition all Pi s into two sets S1 and S2 such that 31 d(P ) ≤ d( i∈Si Pi ) ≤ 23 d(P ). Then we evaluate S1 and S2 separately and multiply them together using FFT. It is easy to see the time complexity of the algorithm running on input size n satisfies 2 3
T (n) ≤ max{T ( n) + O(n log n), T (n1 ) + T (n2 ) + O(n log n)}
where n1 + n2 = n and 13 n ≤ n1 ≤ n2 ≤ 23 n. By solving the above recursive formula, we know T (n) = O(n log2 n). Expanding a Nested Formula: We consider a more general problem of expanding a nested expression P of uni-variable polynomial (with variable x) into its standard form ci xi . Here a nested expression refers to a formula that only involves constants, the variable x, addition +, multiplication ×, and parenthesis ( and ), for example, f (x) = ((1 + x + x2 )(x2 + 2x3 ) + x3 (2 + 3x4 ))(1 + 2x). Formally, we define recursively an expression to be either 1. A constant or the variable x, or 2. The sum of two expressions, or 3. The product of two expressions. We assume the degree of the polynomial and the length of the expression are of sizes O(n). The naive method runs in time O(n3 ) (each inner node needs O(n2 ) time as shown in the last subsection). If we use the previous divide-and-conquer method for expanding each inner node, you can easily get O(n2 log2 n). Now we sketch two improved algorithms with running time O(n2 ). The first is conceptual simpler while the second is much easier to implement. Algorithm 1:
f (x0 ) f (x1 ) .. .. = .. . . . . c f ( x 1 n) 0
The commonly used Gaussian elimination for inverting a matrix requires O(n3 ) operations. The matrix we used is a special type of matrix and is commonly referred to as a Vandermonde matrix. There exists numerical algorithms that can invert a Vandermonde matrix in O(n2 ) time, for example [7]. A small drawback of the above algorithm is that the algorithms used to invert a Vandermonde matrix is nontrivial to implement. The next algorithm does not need to invert a matrix, is much simpler to implement and has the same running time of O(n2 ). Algorithm 2: WePneed some notation first. Suppose the polynon j mial is f (x) = j =0 cj x (cj s are unknown yet). Let ei be the (n + 1)-dimensional zero vector except that the ith entry is 1, i.e., 2π
2π
i
2i
ei = h0, 0, .., 1, ..., 0, 0i. Let di = h1, e n+1 , e n+1 , . . .i be the n + 1-dimensional vector which is the DFT (Discrete Fourier Trans2π
formation) of ei . Let u = e− n+1 be the n + 1th root of unit. Let u = h1, u, u2 , ...., un i and ukP = h1, uk , u2k , u3k , .....i. 1 k th By definition, ei = n+1 k dik u where dik is the k entry of di . Let c = hc0 , . . . , cn i be the coefficient vector of f . It is trivial to see ci = c · ei (the inner product). Therefore, we have that: ci = c · ei =
1 X 1 X dik (c · uk ) = dik f (uk ) n+1 n+1 k
(10)
k
The last equality holds by the definition of f (x). If we use f to denote the vector hf (u0 ), . . . , f (un )i and D to denote the matrix {dij }0≤,i,j≤n , the above equation can be simply written as c=
1 n+1
Df .
Now, we are ready describe our algorithm: 1. Compute f (uk ) for all k. This consists of evaluating f (x) over complex x n times, which takes O(n2 ) time. 2. Use (10) to compute the coefficients. This again takes O(n2 ) time. In fact, the above algorithm can be seen as a specialization of the first algorithm. Instead of picking arbitrary n + 1 real points x0 , . . . xn to evaluate the polynomial, we pick n + 1 complex points 1, u, u2 , . . . , un . The Vandermonde matrix formed by these points, i.e., u0·0 u0·1 . . . u0·n
u1·0 u1·1 . . . u1·n F= . .. . . .. .. . . . un·0 un·1 . . . un·n
has a very nice property that F−1 =
1 n+1
F∗
where F∗ is the conjugate of F (This can be verified easily). Therefore, we can obtain F−1 for free. Actually, it is easy to see that F∗ is exactly D.