Ph.D. THESIS . NOVEMBER 2012
The proposed usability inspection method has been instantiated in two industrial model-driven Web development methods: Object-Oriented Hypermedia (OO-H) and Web Modeling Language (WebML) in order to show the feasibility of the approach. In addition, the usability inspection method has been empirically validated by means of a family of experiments in OO-H and a controlled experiment in WebML.
A Usability Inspection Method for Model-driven Web Development Processes Adrián Fernández Martínez
Adrián Fernández Martínez
This PhD thesis aims to contribute towards addressing the aforementioned limitations by proposing a usability inspection method that can be integrated into different Model-Driven Web development processes. The method is composed of a Web Usability Model that breaks down the concept of usability into sub-characteristics, attributes and generic measures, and a Web Usability Evaluation Process (WUEP) that provides guidelines on how the usability model can be used to perform specific evaluations. The generic measures from the usability model must be operationalized in order for them to be applied to the software artifacts of different Web development methods and at different abstraction levels, thus allowing usability to be evaluated at several stages of the Web development process, especially during the early stages of development.
A Usability Inspection Method for Model-driven Web Development Processes
Web applications have become the backbone of business, information exchange, and social networks. In this kind of applications, usability is considered as one of the most important quality factors, since the ease or difficulty that users experience with this kind of systems will determine their success or failure. However, there are several shortcomings with the existing Web usability evaluation approaches such as: the concept of usability is only partially supported; usability evaluations are mainly performed when the Web application has been developed; the lack of guidelines on how to properly integrate usability into Web development, and the shortage of Web usability evaluation methods that have been empirically validated.
SUPERVISED BY DRA. SILVIA ABRAHÃO DR. EMILIO INSFRÁN tesis_adrian2.indd 1
25/10/12 00:25
A Usability Inspection Method for Model-driven Web Development Processes Adrián Fernández Martínez
Departamento de Sistemas Informáticos y Computación
PhD Thesis submitted in partial fulfillment of the requirements for the degree of Doctor of Philosophy in Computer Science
Supervisors: Dra. Silvia Abrahão Dr. Emilio Insfrán Valencia, November 16, 2012
Ph.D. Thesis. © Adrián Fernández Martínez, Valencia, España MMVIII-MMXII. All rights are reserved in favour of their respective owners. Cover Design: Héctor Barea Torregrosa
Thesis data Thesis title:
A Usability Inspection Method for Model-driven Web Development Processes
Presented by:
Adrián Fernández Martínez (
[email protected])
Supervised by:
Dra. Silvia Abrahão (
[email protected]) Dr. Emilio Insfran (
[email protected])
Institution:
Universitat Politècnica de València (UPV)
Department:
Sistemas Informáticos y Computación (DSIC)
Ph.D. Program:
Doctor en Informática
Funded by:
Ministerio Educación y Ciencia (Programa FPU)
Submission:
Valencia, July 27, 2012
Defense:
Valencia, November 16, 2012
External reviewers: Dr. Jaime Gómez, Universitat D’Alacant, Spain. Dra. Maristella Matera, Politecnico di Milano, Italy. Dr. Martin Gaedke, Chemnitz University of Technology, Germany. Thesis Committee: President
Dr. Isidro Ramos, Universitat Politécnica Valencia, Spain
Secretary
Dr. Jaime Gómez, Universitat D’Alacant, Spain.
Vowels
Dra. Maristella Matera, Politecnico di Milano, Italy. Dr. João Araújo, Universidade Nova de Lisboa, Portugal. Dra. Marcela Genero, Universidad de Castilla-La-Mancha, Spain.
Acknowledgments/Agradecimientos
A Rita Hurtado por su plena confianza en mí, por estar siempre a mi lado en los buenos y malos momentos, y por sus interminables ánimos. A mis directores de tesis Silvia Abrahão y Emilio Insfran por su esfuerzo, dedicación, motivación, apoyo y confianza que me han brindado. A mis padres, por el apoyo que me ofrecieron, por la formación y por fomentar en mí el espíritu de querer estar aprendiendo siempre. A todo el grupo ISSI (Abel, Alex, David, Ema, Javier, José Antonio, Kamil, Lorena, Priscila y Sonia), incluyendo a los compañeros italianos de mi estancia en Milán (Alessandro, Arif, Cinzia, Davide, Maristella y Matteo), puesto que ir cada día a trabajar sin su compañía no sería lo mismo. A mis compañeros de promoción (David, Eloy, Jesús, Nico), que nos hemos apoyado mutuamente en los tiempos difíciles de esta profesión. A todos aquellos alumnos que participaron en los agotadores experimentos que preparé a lo largo de esta tesis. A Héctor Barea por prestar sus conocimientos gráficoartísticos en la portada de esta tesis. Por último a todas aquellas amistades que vieron en mi alguien que merecía formar parte de sus vidas.
Abstract Web applications have become the backbone of business, information exchange, and social networks. In this kind of applications, usability is considered to be one of the most important quality factors, since the ease or difficulty that users experience with this kind of systems will determine their success or failure. However, there are several shortcomings with the existing Web usability evaluation approaches such as: the concept of usability is only partially supported; usability evaluations are mainly performed when the Web application has been developed; the lack of guidelines on how to properly integrate usability into Web development, and the shortage of Web usability evaluation methods that have been empirically validated. In addition, the majority of Web development processes do not take advantage of the software artifacts produced at the design stages. These intermediate artifacts are principally used to guide developers and to document the Web application but not to perform usability evaluations. Since the traceability between these artifacts and the final Web application is not well-understood, performing usability evaluations on these artifacts can be difficult. This problem is alleviated in Model-Driven Web Development (MDWD) processes in which intermediate artifacts (models), which represent different views of a Web application, are used in all the steps of the development process, and the final source code is automatically generated from these models. By considering the traceability among these models, their evaluation allows usability problems which would be experienced by end-users of the final Web application to be detected, and provides recommendations to correct these usability problems during the earlier stages of the Web development process. This PhD thesis aims to contribute towards addressing the aforementioned limitations by proposing a usability inspection method that can be integrated into different Model-Driven Web development processes. The method is composed of a Web Usability Model that breaks down the concept of usability into sub-characteristics, attributes and generic measures, and a Web Usability Evaluation Process (WUEP) that provides guidelines on how the usability model can be used to perform specific evaluations. The generic measures from the usability model must be operationalized in order for them to be applied to the software artifacts of different Web development methods and at different abstraction levels, thus allowing usability to be evaluated at several stages of the Web development process, especially during the early stages of development. Both the usability model and the evaluation process are aligned with the latest ISO/IEC 25000 standard for software product quality evaluation (SQuaRE).
The proposed usability inspection method (WUEP) has been instantiated in two industrial model-driven Web development methods (i.e., OO-H and WebML) in order to show the feasibility of the approach, and WUEP has also been empirically validated by means of a family of experiments in OO-H and a controlled experiment in WebML. The objective of our empirical studies was to evaluate the participants’ effectiveness, efficiency, perceived ease of use and perceived satisfaction when using WUEP in comparison to a widely-used industrial inspection method: Heuristic Evaluation (HE). The statistical analysis and meta-analysis of the data obtained separately from each experiment indicated that WUEP is more effective and efficient than HE in the detection of usability problems. The evaluators were also more satisfied when applying WUEP, and found it easier to use than HE. Although further experiments must be carried out to strengthen these results, WUEP has proved to be a promising usability inspection method for Web applications which have been developed using model-driven Web development processes.
Resumen Las aplicaciones Web son consideradas actualmente un elemento esencial e indispensable en toda actividad empresarial, intercambio de información y motor de redes sociales. La usabilidad, en este tipo de aplicaciones, es reconocida como uno de los factores clave más importantes, puesto que la facilidad o dificultad que los usuarios experimentan con estas aplicaciones determinan en gran medida su éxito o fracaso. Sin embargo, existen varias limitaciones en las propuestas actuales de evaluación de usabilidad Web, tales como: el concepto de usabilidad sólo se soporta parcialmente, las evaluaciones de usabilidad se realizan principalmente cuando la aplicación Web se ha desarrollado, hay una carencia de guías sobre cómo integrar adecuadamente la usabilidad en el desarrollo Web, y también existe una carencia de métodos de evaluación de la usabilidad Web que hayan sido validados empíricamente. Además, la mayoría de los procesos de desarrollo Web no aprovechan los artefactos producidos en las fases de diseño. Estos artefactos software intermedios se utilizan principalmente para guiar a los desarrolladores y para documentar la aplicación Web, pero no para realizar evaluaciones de usabilidad. Dado que la trazabilidad entre estos artefactos y la aplicación Web final no está bien definida, la realización de evaluaciones de usabilidad de estos artefactos resulta difícil. Este problema se mitiga en el desarrollo Web dirigido por modelos (DWDM), donde los artefactos intermedios (modelos) que representan diferentes perspectivas de una aplicación Web, se utilizan en todas las etapas del proceso de desarrollo, y el código fuente final se genera automáticamente a partir estos modelos. Al tener en cuenta la trazabilidad entre estos modelos, la evaluación de estos modelos permite detectar problemas de usabilidad que experimentaran los usuarios finales de la aplicación Web final, y proveer recomendaciones para corregir estos problemas de usabilidad durante fases tempranas del proceso de desarrollo Web. Esta tesis tiene como objetivo, tratando las anteriores limitaciones detectadas, el proponer un método de inspección de usabilidad que se puede integrar en diferentes procesos de desarrollo Web dirigido por modelos. El método se compone de un modelo de usabilidad Web que descompone el concepto de usabilidad en sub-características, atributos y métricas genéricas, y un proceso de evaluación de usabilidad Web (WUEP), que proporciona directrices sobre cómo el modelo de usabilidad se puede utilizar para llevar a cabo evaluaciones específicas. Las métricas genéricas del modelo de usabilidad deben operacionalizarse con el fin de ser aplicables a los artefactos software de diferentes métodos de desarrollo Web y en diferentes niveles de abstracción, lo
que permite evaluar la usabilidad en varias etapas del proceso de desarrollo Web, especialmente en las etapas tempranas. Tanto el modelo de usabilidad como el proceso de evaluación están alineados con la última norma ISO/IEC 25000 estándar para la evaluación de la calidad de productos de software (SQuaRE). El método de inspección de usabilidad propuesto (WUEP) se ha instanciado en dos procesos de desarrollo Web dirigido por modelos diferentes (OO-H y WebML) a fin de demostrar la factibilidad de nuestra propuesta. Además, WUEP fue validado empíricamente mediante la realización de una familia de experimentos en OO-H y un experimento controlado en WebML. El objetivo de nuestros estudios empíricos fue evaluar la efectividad, la eficiencia, facilidad de uso percibida y la satisfacción percibida de los participantes; cuando utilizaron WUEP en comparación con un método de inspección industrial ampliamente utilizado: La Evaluación Heurística (HE). El análisis estadístico y meta-análisis de los datos obtenidos por separado de cada experimento indicaron que WUEP es más eficaz y eficiente que HE en la detección de problemas de usabilidad. Los evaluadores también percibieron más satisfacción cuando se aplicaron WUEP, y les pareció más fácil de usar que HE. Aunque es necesario llevar a cabo más experimentos para afianzar estos resultados, WUEP ha demostrado ser un método prometedor para la inspección de la usabilidad de aplicaciones Web que han sido desarrollados mediante procesos de desarrollo Web dirigido por modelos.
Resum Les aplicacions Web són considerades actualment un element essencial i indispensable en tota activitat empresarial, intercanvi d'informació i motor de xarxes socials. La usabilitat, en aquest tipus d'aplicacions, és reconeguda com un dels factors clau més importants, ja que la facilitat o dificultat que els usuaris experimenten amb aquestes aplicacions determinen en gran mesura el seu èxit o fracàs. No obstant això, existeixen diverses limitacions en les propostes actuals d'avaluació d'usabilitat Web, com ara: el concepte d'usabilitat només es suporta parcialment, les avaluacions d'usabilitat es realitzen principalment quan l'aplicació Web s'ha desenvolupat, hi ha una manca de guies sobre com integrar adequadament la usabilitat en el desenvolupament Web, i també hi ha una manca de mètodes d'avaluació de la usabilitat web que foren validats empíricament. A més, la majoria dels processos de desenvolupament Web no aprofiten els artefactes produïts en les fases de disseny. Aquests artefactes intermedis s'utilitzen principalment per guiar els desenvolupadors i per documentar l'aplicació Web, però no per a realitzar avaluacions d'usabilitat. Atès que la traçabilitat entre aquests artefactes i l'aplicació Web final no està ben definida, la realització d'avaluacions d'usabilitat d'aquests artefactes és difícil. Aquest problema es mitiga en el desenvolupament Web dirigit per models (DWDM), on els artefactes intermedis (models) que representen diferents perspectives d'una aplicació Web, s'utilitzen en totes les etapes del procés de desenvolupament, i el codi font final es genera automàticament a partir aquests models. Gràcies a la traçabilitat entre aquests models, l'avaluació d'aquests models permet detectar problemes d'usabilitat que experimentessin els usuaris finals de l'aplicació Web final, i proveir recomanacions per corregir aquests problemes d'usabilitat durant les primeres fases del procés de desenvolupament web. Aquesta tesi doctoral té com a objectiu, tractant les anteriors limitacions detectades, el proposar un mètode d'inspecció d'usabilitat que es pot integrar en diferents processos de desenvolupament Web dirigit per models. El mètode es compon d'un model d'usabilitat web que descompon el concepte d'usabilitat en sub-característiques, atributs i mètriques genèriques, i un procés d'avaluació d'usabilitat Web (WUEP), que proporciona directrius sobre com el model d'usabilitat es pot utilitzar per dur a terme avaluacions específiques. Les mètriques genèriques del model d'usabilitat han operacionalitzar-se amb la
finalitat de ser aplicables als artefactes de diferents mètodes de desenvolupament Web i en diferents nivells d'abstracció, el que permet avaluar la usabilitat en diverses etapes del procés de desenvolupament Web, especialment en les etapes primerenques. Tant el model d'usabilitat com el procés d'avaluació estan alineats amb l'última norma ISO/IEC 25000 estàndard per a l'avaluació de la qualitat de productes de programari (SQuaRE). El mètode d'inspecció d'usabilitat proposat (WUEP) s'ha instanciat en dos processos de desenvolupament Web dirigit per models diferents (OO-H i WebML) a fi de demostrar la factibilitat de la nostra proposta. A més, WUEP va ser validat empíricament mitjançant la realització d'una família d'experiments en OO-H i un experiment controlat en WebML. L'objectiu dels nostres estudis empírics va ser avaluar l'efectivitat, l'eficiència, facilitat d'ús percebuda i la satisfacció percebuda dels participants, quan van utilitzar WUEP en comparació amb un mètode d'inspecció industrial àmpliament utilitzat:: l'Avaluació Heurística (HE). L'anàlisi estadística i meta-anàlisi de les dades obtingudes per separat de cada experiment van indicar que WUEP és més eficaç i eficient que HE en la detecció de problemes d'usabilitat. Els avaluadors també van percebre més satisfacció quan es van aplicar WUEP, i els va semblar més fàcil d'utilitzar que HE. Encara que és necessari dur a terme més experiments per consolidar aquests resultats, WUEP ha demostrat ser un mètode prometedor per a la inspecció de la usabilitat d'aplicacions Web que han estat desenvolupats mitjançant processos de desenvolupament Web dirigit per models.
Key Words Keywords: Usability evaluation, Inspection methods, Model-driven Web development, OO-H, WebML, ISO/IEC 25010, Empirical validation. Palabras clave: Evaluación usabilidad, Métodos de Inspección, Desarrollo Web dirigido por modelos, OO-H, WebML, ISO/IEC 25010, Validación empírica. Paraules clau: Avaluació d’usabilitat, Mètodes d’inspecció, Desenvolupament Web dirigit per models, OO-H, WebML, ISO/IEC 25010, Validació empírica.
Tag Cloud
Content 1
Introduction .......................................................................................... 3 1.1 Usability evaluation in Web development ................................................ 3 1.2
Usability evaluation methods ...................................................................... 4
1.3
Problem statement........................................................................................ 6
1.4
Research goals ............................................................................................... 8
1.5
Research environment ................................................................................. 9
1.6
Research design...........................................................................................10
1.6.1
Systematic research methods ...........................................................10
1.6.2
Laboratory experiments....................................................................14
1.7 2
Thesis outline ..............................................................................................17
Literature review on Usability Evaluation Methods for the Web . 23 2.1 Need for a systematic mapping study ......................................................23 2.2
Research method ........................................................................................26
2.2.1
Planning stage ....................................................................................27
2.2.2
Conducting stage ...............................................................................35
2.3
Results ..........................................................................................................35
2.3.1
Origin of the UEMs employed........................................................36
2.3.2
Underlying usability definition of the UEMs ................................37
2.3.3
Types of UEMs employed ...............................................................39
2.3.4
Type of evaluation performed by the UEMs ................................41
2.3.5
Phase(s) and Web artifacts in which the UEMs are applied .......42
2.3.6
Feedback provided by the UEMs ...................................................44
2.3.7
Empirical validation of the UEMs ..................................................45 i
2.3.8
Mapping results ................................................................................. 46
2.3.9
Interest of the topic .......................................................................... 48
2.4
3
4
ii
Discussion ................................................................................................... 50
2.4.1
Principal findings............................................................................... 50
2.4.2
Limitations of the systematic mapping study................................ 51
2.4.3
Implications for research and practice ........................................... 52
2.5
Conclusions ................................................................................................. 56
2.6
Extension: a systematic review on the effectiveness of Web usability evaluation methods .................................................................................... 56
2.6.1
Research method ............................................................................... 57
2.6.2
Results ................................................................................................. 60
2.6.3
Limitations of the systematic review .............................................. 64
2.6.4
Conclusions ........................................................................................ 64
Standards for Usability Evaluation .................................................. 67 3.1 Existing standards for usability evaluation ............................................. 67 3.1.1
Process-oriented standards: ISO/IEC 9241 and 13407 .............. 68
3.1.2
Product-oriented standards: ISO/IEC 9126 and 14598 ............. 70
3.1.3
ISO/IEC 25000 SQuaRE standard series ..................................... 73
3.2
Web usability evaluation approaches based on standards .................... 78
3.3
Conclusions ................................................................................................. 82
Usability Evaluation in Model-Driven Web Development............. 85 4.1 Model-driven Web development methods ............................................. 85 4.1.1
Object-Oriented Hypermedia Design Method (OOHDM) ....... 88
4.1.2
Web Site Design Method (WSDM) ................................................ 89
4.1.3
Scenario-Based Object-Oriented Hypermedia Design Methodology (SOHDM).................................................................. 89
4.1.4
Web Modeling Language (WebML) ............................................... 90
4.1.5
UML based Web Engineering (UWE) ........................................... 91
5
4.1.6
W2000 .................................................................................................91
4.1.7
Object-Oriented Hypermedia Method (OO-H) ...........................92
4.1.8
Object-Oriented Web Solutions (OOWS) ....................................93
4.1.9
Navigational Development Techniques (NDT) ...........................93
4.2
Usability evaluation approaches for Model-driven Web development processes ......................................................................................................94
4.3
Conclusions .................................................................................................96
WUEP: A Web Usability Evaluation Process for Model-Driven Web Development ........................................................................ 101 5.1 Integrating usability evaluations into Model-driven Web development processes ................................................................................................... 102 5.2
5.2.1
Web Usability Model from the Quality Product perspective... 105
5.2.2
Web Usability Model from the Quality in Use perspective ..... 113
5.2.3
Generic Web measures .................................................................. 116
5.3
Definition of the Web Usability Evaluation Process ......................... 119
5.3.1
Introduction to SPEM2 for defining software processes......... 119
5.3.2
Web Usability Evaluation Process defined using SPEM 2.0 ... 122
5.4 6
Web Usability Model............................................................................... 104
Conclusions .............................................................................................. 131
Instantiation of the Web Usability Evaluation Process ................ 135 6.1 Instantiation of WUEP in the OO-H method .................................... 135 6.1.1
Introduction to OO-H and its modeling primitives ................. 136
6.1.2
Operationalization of measures for OO-H ................................ 140
6.1.3
Case study: Task Manager ............................................................. 150
6.1.4
Evaluating the usability of Web applications developed with OO-H ............................................................................................... 166
6.2
Instantiation of WUEP in the WebML method ................................. 188
6.2.1
Introduction to WebML and its modeling primitives ............... 188 iii
7
6.2.2
Operationalization of measures for WebML .............................. 191
6.2.3
Case study: ACME store ................................................................ 194
6.2.4
Evaluating the usability of Web applications developed with WebML ............................................................................................. 196
6.3
Lessons learned from cases studies ....................................................... 203
6.4
Conclusions ............................................................................................... 204
Empirical validation of the Web Usability Evaluation Process ... 209 7.1 Empirical validations of usability inspection methods ....................... 210 7.1.1
Empirical Studies for Traditional Web Development ............... 210
7.1.2
Empirical Studies for Model-driven Web Development .......... 213
7.1.3
Discussion ........................................................................................ 214
7.2
Methods involved in our empirical validation...................................... 215
7.3
Assessing the actual and perceived performance of WUEP in practice: a family of experiments with OO-H ..................................................... 218
7.3.1
The family of experiments ............................................................. 218
7.3.2
Design of individual experiments ................................................. 229
7.3.3
Results ............................................................................................... 233
7.3.4
Family data analysis......................................................................... 239
7.4
7.4.1
Experiment Planning ...................................................................... 244
7.4.2
Experiment Operation ................................................................... 249
7.4.3
Result Analysis ................................................................................. 251
7.5
Threats to validity ..................................................................................... 256
7.5.1
Internal Validity ............................................................................... 256
7.5.2
External validity............................................................................... 257
7.5.3
Construct validity ............................................................................ 259
7.5.4
Conclusion validity.......................................................................... 260
7.6 iv
Assessing the usefulness of WUEP: a controlled experiment with WebML ...................................................................................................... 244
Conclusions ............................................................................................... 260
8
Conclusions ....................................................................................... 265 8.1 Conclusions .............................................................................................. 265 8.1.1
Goal 1: Analysis of Web usability evaluation methods ............. 266
8.1.2
Goal 2: Study of standards for software product quality evaluation......................................................................................... 268
8.1.3
Goal 3: Analysis of usability evaluation approaches based on model-driven Web development.................................................. 269
8.1.4
Goal 4: Definition of a Web Usability Model ............................ 270
8.1.5
Goal 5: Definition of a generic Web Usability Evaluation Process ............................................................................................. 271
8.1.6
Goal 6: Instantiation of the Web Usability Evaluation Process ........................................................................................................... 272
8.1.7
Goal 7: Empirical validation of the Web Usability Evaluation Process ............................................................................................. 273
8.2
Related publications ................................................................................ 274
8.2.1
Refereed International Indexed Journals (JCR): ........................ 274
8.2.2
Book Chapters ................................................................................ 274
8.2.3
Refereed International Conferences ............................................ 275
8.2.4
Refereed International Workshops .............................................. 276
8.2.5
Refereed National Conferences ................................................... 276
8.2.6
Refereed Ibero-american Conferences ........................................ 276
8.2.7
Ongoing papers .............................................................................. 276
8.2.8
Summary and quality of the publications:................................... 277
8.3
Research stays........................................................................................... 277
8.4
Grants awarded ........................................................................................ 277
8.5
Future research directions ...................................................................... 278
Figure Index .............................................................................................. 279 Table Index ............................................................................................... 281 Acronym List ............................................................................................ 283 v
Appendix A. Appendix B. Appendix C.
Systematic research methods sources .......................... 287 Web Usability Model ..................................................... 311 Experiment Material...................................................... 324
Bibliography ............................................................................................. 335
vi
PART I Introduction
Chapter 1 1 Introduction 1.1
Usability evaluation in Web development
A Web application is a software product that is accessed over a network such as the Internet or an Intranet. The term may also signify a computer software application that is coded in a browser-supported language and is reliant on a common Web browser to render the application executable. Initially, the concept of the Web was basically a set of static documents which were accessible from anywhere in the world. This ubiquity, in combination with the development of new technologies, has been an essential aspect in the evolution towards the current concept of Web applications, whose aim is to provide a large variety of features and services, beyond the mere fact of checking concrete information. This aim has stated how the interaction between Web applications and their end-users has become crucial in the achievement of their objectives. Web applications have several advantages that make them valuable software products, such as the ubiquity of Web browsers, and the convenience of using a Web browser as a client, sometimes termed as a thin client. The ability to update and maintain Web applications without distributing and installing software in potentially thousands of client computers is a key reason for their popularity, as is the inherent support for cross-platform compatibility. Common Web applications include webmail, online retail sales, online auctions 3
Introduction and wikis, among many others. All these advantages have led to Web applications becoming the backbone of business and information exchange. They are currently the initial means to present products and services to potential customers, and are also employed by governments to disseminate relevant information to citizens. However, it is not sufficient to satisfy the functional requirements of a Web application in order to ensure its success. The ease or difficulty experienced by users is largely responsible for determining their success or failure. Jakob Nielsen, one of the most influential authors and practitioners in this area, claimed that “on the Internet, your competition is only one click away”. This means that when users get frustrated owing to not achieving their objectives while using a particular Web application, they will directly prefer to adopt another Web application. It is therefore widely accepted that usability is considered to be one of the most important quality factors for Web applications, along with others such as reliability and security (Offutt 2002). In fact, many companies have folded as a result of not considering Web usability issues (Becker and Mottay 2001). Usability evaluation methods which are specifically crafted for the Web, and technologies that support the usability design process, have thus become critical (Neuwirth and Regli 2002). Usability issues therefore not only benefit user experience, but are capable of saving resources related to the Web development process, thus benefiting both Web developers and end-users. Some of these benefits are: the reduction in costs during certain stages of the Web application lifecycle (i.e., development, maintenance, and support); the increase in user productivity when carrying out their objectives with the application; and a direct impact on sales and scope, since a more usable product allows better marketing and a more competitive product in comparison to others. The challenge of developing more usable Web applications has therefore led to the emergence of a variety of methods, techniques, and tools with which to address Web usability issues. Although much wisdom exists on how to develop usable Web applications, many of these applications still do not meet most customers’ usability expectations (Offutt 2002).
1.2 Usability evaluation methods The term usability has several definitions in each research field. In the field of Human-Computer Interaction (HCI), the most widely accepted definition of usability is that proposed in the ISO/IEC 9241-11 (1998): ‘‘the extent to which a product can be used by specified users to achieve specific goals with effectiveness, efficiency and 4
1.2 Usability evaluation methods satisfaction in a specified context of use’’. This definition is that which is closest to the human interaction perspective. This view of usability implies the users’ interaction with the software product, and can be seen as the product’s capability of meeting customer expectations. It is worth mentioning that this standard has recently been replaced with the ISO/IEC 9241-210 (2010) standard. The difference between the definitions of usability in these two standards is that in the 9241-11 standard a product can be used by the specified users, whereas in the 9241-210 standard, it is stated that a system, product or a service can be used. However, in the field of Software Engineering (SE),the most widely accepted definition of usability is that proposed in the ISO/IEC 9126-1 (2001): ‘‘the capability of the software product to be understood, learned, operated, attractive to the user, and compliant to standards/guidelines, when used under specific conditions’’. This view of usability shows it to be one specific characteristic that affects the quality of a software product. It can be evaluated during the early stages of Web development and does not necessarily imply the user’s interaction with the system since it can be measured as ‘‘conformance to specification’’, where usability is defined as a matter of products whose measurable characteristics satisfy a fixed specification which has been defined beforehand. However, the evaluations are performed from the end-users’ point-of-view. The objective is to detect (predict) usability problems that the users would have if they were interacting with the software product. These different definitions of usability directly affect how it is evaluated, since each method or technique employed in these evaluations may focus on different aspects of the term usability (e.g., effectiveness of user task, learnability of user interfaces). A usability evaluation method (UEM) is a process that is used to produce a measurement of usability (Karat1997)or is a systematic procedure for recording data relating to end-user interaction with a software product or system (Fitzpatrick1999).UEMs were formerly developed to specifically evaluate WIMP (Window, Icon, Menu, Pointing device) interfaces, which are the most representative of desktop applications. One of the most representative examples is the heuristic evaluation method proposed by Nielsen (1994). The growth in importance of Web-based interfaces has led to the emergence of new and adapted UEMs to address this type of user interfaces. Although several taxonomies with which to classify UEMs have been proposed (Ivory and Hearst 2001; Ferre et al. 2005), UEMs can, in general terms, be principally classified into two different types (Nielsen 1993; Virzi, 1997; Dix et al. 1998; Karat 1997): empirical methods and inspection methods. 5
Introduction Empirical methods are based on capturing and analyzing usage data from real end-users. Real end-users employ the software product (or a prototype) to complete a predefined set of tasks while the tester (human or specific software) records the outcomes of their work. Analysis of these outcomes can provide useful information with which to detect usability problems during the completion of the user’s task. Inspection methods are performed by expert evaluators or designers (i.e., they do not require the participation of real endusers) and are based on reviewing the usability aspects of Web artifacts, which are commonly user interfaces, as regards their conformance with a set of guidelines. These guidelines can range from checking the level of achievement of specific usability attributes to heuristic evaluations concerning the predictions of problems related to user interfaces. In the Web domain, both empirical and inspection methods have several advantages and disadvantages. Since the majority of Web applications are developed for many different end-user profiles, empirical methods can take into account a wide range of end-users. However, the use of empirical methods may not be cost-effective since they require a large amount of resources. Empirical methods also need a full or partial implementation of the Web application, signifying that usability evaluations are mainly moved to the last stages of the Web development process. Inspection methods, on the other hand, allow usability evaluations to be performed on Web artifacts such as mock-ups, paper prototypes, or user interface models. This is relevant because these Web artifacts can be created during the early stages of the Web development process. Another benefit of the inspection methods is that they often require fewer resources than empirical methods. However, the usability evaluation performed may be limited by the quality of the guidelines or the evaluator’s experience. Moreover, the interaction of real end-users is not taken into account in inspection methods.
1.3 Problem statement Usability evaluation methods should be integrated at different stages of Web application development in order to assist designers/evaluators in the detection of usability problems throughout the entire Web application lifecycle. The complexity of integrating usability evaluations at different stages of Web application development is largely determined by the Web development method selected. The majority of Web development processes do not take advantage of the artifacts produced at the requirements and design stages. These intermediate artifacts are principally used to guide developers and to document the Web application, but not to perform usability evaluations. Since 6
1.3 Problem statement the traceability between software artifacts and the final Web application is not well-understood, performing usability evaluations on these artifacts can be difficult. This problem is alleviated in Model-Driven Web Development (MDWD) processes in which intermediate artifacts (models), which represent different views of a Web application, are used in all the steps of the development process, and the final source code is automatically generated from these models. Most MDWD processes break up the Web application design into three models: content, navigation and presentation. These dimensions allow proper levels of abstraction to be established (Casteleyn et al. 2009). An MDWD process basically transforms models that are independent of technological implementation details (i.e., Platform-Independent Models - PIMs) such as structural models, navigational models or abstract user interface (UI) models into other models that contain specific aspects from a specific technological platform (i.e., Platform-Specific Models - PSMs) such as concrete user interface models or database schemas. This is done by automatically applying transformation rules. PSMs can be automatically compiled to generate the source code of the final Web application (Code Model - CM). This approach is followed by several methods such as: OO-H (Gómez et al. 2001) or WebML (Ceri et al. 2000). By considering the traceability among these models (PIMs, PSMs, and CMs), their evaluation permits the detection of usability problems which would appear in the final Web application, along with the provision of recommendations to correct these problems during the earlier stages of the Web development process. Our intention therefore, is to support the intrinsic usability of the Web application generated by following a model-driven development process, and to support the notion of usability proven by construction (Abrahão et al. 2007). Usability by construction is analogous to the concept of correctness by construction (Hall and Chapman 2002) which is introduced to guarantee the quality of a safety-critical system. In this development method, the authors argue that in order to obtain software with almost no defects (0.04% per KLOC), each step in the development method should be assessed as regards correctness. If it were possible to maintain proof of the correctness of a software application from its inception until its delivery, it would then be possible to prove that it is correct by construction. Similarly, if it were possible to maintain proof of the usability of a Web application from its model specification until the source code, it would then be possible to prove it is usable by construction. Of course, we can only hypothesize that each model may allow a certain level of usability to be attained in the application generated. We could therefore predict the global usability of an entire Web application by 7
Introduction estimating the relative usability levels that the models and transformations involved in a specific model-driven development method can accomplish. We cannot prove that a Web application is entirely usable, but we can prove that it is usable at a certain level. It is worth mentioning that the evaluation of these Web artifacts is intended to detect (predict) usability problems from the enduser point-of-view. We are not concerned with the evaluation of the usability of the software artifacts themselves.
1.4 Research goals The aim of this PhD thesis is to propose a usability inspection method that can be integrated into different model-driven Web development processes, thus enabling usability evaluations to be made by employing the Web artifacts (i.e., models) created during the different stages of a model-driven Web development process. The aforementioned aim will be satisfied by dealing with the following subgoals, which are: 1. To carry out an in–depth analysis of the existing usability evaluation methods for Web applications: the kinds of methods that are most frequently used, the artifacts and phases of the Web development in which they are applied, which of them have been empirically validated, which have proved to be most effective, etc. 2. To study the existing standards for software product quality evaluation with specific emphasis on usability, and analyze existing proposals for usability evaluation which are based on these standards. 3. To study the existing model-driven Web development methods, and analyze the usability evaluation approaches based on this paradigm. 4. To define a usability model that breaks down the concept of Web usability into sub-characteristics, attributes and measures according to quality evaluation standards, usability guidelines, ergonomic criteria, different definitions of usability, etc. 5. To define a generic process for Web usability evaluation that can be integrated into different model-driven Web development methods by employing the usability model as the main input artifact. 6. To instantiate the Web usability evaluation process in specific modeldriven Web development methods in order to show its feasibility. 7. To empirically validate the Web usability evaluation process by assessing its actual and perceived performance in practice through controlled experiments. 8
1.5 Research environment
1.5 Research environment This PhD thesis was developed in the context of the Software Engineering and Information Systems Research Group (ISSI Research Group – Ingenieria Software y Sistemas de información) of the Universitat Politècnica de València (UPV). The works that have made the development of this thesis possible are in the context of R&D government projects. These projects are the following:
META project (Models, Environments, Transformations and Applications), Sub-project appertaining to the MOMENT project: A technological framework for model management in model engineering (Un marco tecnológico y formal para la gestión de modelos en la ingeniería de modelos). Funded by the Spanish Ministry of Education and Science TIN2006-15175-C05-01. From October 2006 to September 2009. MAUSE project: Towards the Maturation of Information Technology Usability Evaluation. Funded by the European Union COST action No. 294. From 2005 to 2009. CALIPSO network: Product Quality and Software Process (Calidad del producto y Proceso Software). Research network funded by the Ministry of Science and Technology - TIN2005-24055-E. From 2005 to 2007. CALIMO project: Integrating Quality in the Model-driven development (Integración de Calidad en el Desarrollo de Software Dirigido por Modelos). Funded by the Generalitat Valenciana, Conselleria d’ Educació - GV/2009/103. From January 2009 to January 2010) Quality-Driven Model Transformations Project (Transformación de Modelos Dirigida por Atributos de Calidad). Funded by the Universitat Politècnica de València - PAID-06-07-3286. From December 2007 to December 2009. MULTIPLE project: Multimodeling Approach for Quality-Aware Software Product Lines. Funded by the Ministry of Science and Innovation - TIN2009-13838. From October 2009 to September 2013. TwinTIDE project: Towards the Integration of Transectorial IT Design and Evaluation. Funded by the European Union COST action IC0904. From November 2009 to November 2013.
9
Introduction
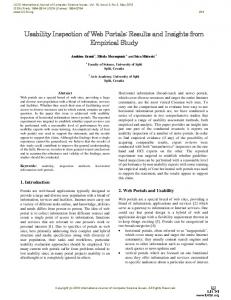
1.6 Research design The research work presented in this PhD thesis took place in three stages, which are summarized in Figure 1.1. The first stage is related to the analysis of the state-of-the-art as regards usability evaluation for Web applications. The second stage is related to the methodological definition of a usability inspection method, namely the Web Usability Evaluation Process (WUEP) and its practical application in order to refine and improve it. Finally, the third stage is related to the empirical validation of the Web usability evaluation process.
Figure 1.1. Summary of research design
The selection and the justification of the research methods used to perform each stage of this research work are described as follows. 1.6.1 Systematic research methods As a research area matures there is often a sharp increase in the number of reports and results made available, and it becomes important to summarize and provide an overview of the state-of-the-art. Several research fields have specific methodologies for such secondary studies, and they have been extensively used in, for example, evidence-based medicine. Until recently this has not been the case in Software Engineering (SE). However, a general trend toward more evidence-based software engineering (Kitchenham et al. 2006) has led to an increased focus on new, empirical and systematic research methods. In our research, we applied the two most common systematic research methods: 10
1.6 Research design Systematic Mapping Study and Systematic Literature Review. A brief description of each one is provided in the following subsections. 1.6.1.1 Systematic Mapping Study Systematic Mapping Studies (also known as Scoping Studies) are designed to provide a wide overview of a research area, to establish whether research evidence exists on a topic and to provide an indication of the quantity of the evidence (Budgen et al. 2008). The results of a mapping study can identify areas in which it is suitable to conduct Systematic Literature Reviews in addition to areas in which a primary study is more appropriate. Mapping Studies may be requested by an external body before they commission a systematic review in order to allow more cost effective targeting of their resources. They are also useful for PhD students who are required to prepare an overview of the topic area in which they will be working. The main differences between a mapping study and systematic review are (Kitchenham 2007):
Mapping studies are generally driven by broader research questions and often ask multiple research questions. The search terms for mapping studies will be less highly focused than those for systematic reviews and are likely to return a very large number of studies. For a mapping study, however, this is less of a problem than with large numbers of results during the search phase of the systematic review as the aim here is for broad coverage rather than narrow focus. The data extraction process for mapping studies is also much broader than the data extraction process for systematic reviews and can more accurately be termed as a classification or categorization stage. The purpose of this stage is to classify papers with sufficient detail to answer the broad research questions and to identify papers for later reviews without it being a time consuming task. The analysis stage of a mapping study concerns summarizing the data in order to answer the research questions posed. It is unlikely to include in-depth analysis techniques such as meta-analysis and narrative synthesis, but rather totals and summaries. Graphical representations of study distributions by classification type may be an effective reporting mechanism. Dissemination of the results of a mapping study may be more limited than for a systematic review, its being limited to commissioning bodies 11
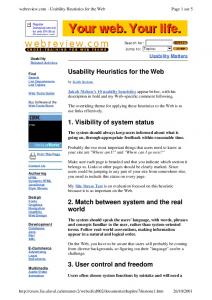
Introduction and academic publications, with the aim of influencing the future direction of primary research. The essential process steps of a systematic mapping study are the definition of research questions, conducting the search for relevant papers, the screening of papers, the keywording of abstracts, and data extraction and mapping (see Figure 1.2). Each process step has an outcome, the final outcome of the process being the systematic map. For more information on systematic mapping studies the reader is referred to Budgen et al. (2008) and Petersen et al. (2008).
Figure 1.2. The Systematic Mapping process [source: (Budgen et al. 2008)]
1.6.1.2 Systematic Literature Review (SLR) A systematic literature review (often referred to as a systematic review) is a means of identifying, evaluating and interpreting all available research relevant to a particular research question, topic area, or phenomenon of interest (Kitchenham 2007). The individual studies that contribute to a systematic review are called primary studies; a systematic review is a form of secondary study. There are many reasons for undertaking a systematic literature review. The most common reasons are:
To summarize the existing evidence concerning a treatment or technology e.g. to summarize the empirical evidence of the benefits and limitations of a specific agile method. To identify any gaps in current research in order to suggest areas for further investigation. To provide a framework/background in order to appropriately position new research activities.
However, systematic literature reviews can also be undertaken to examine the extent to which empirical evidence supports/contradicts theoretical hypotheses, or even to assist the generation of new hypotheses. 12
1.6 Research design Most research starts with a literature review of some sort. However, unless a literature review is thorough and fair, it is of little scientific value. This is the main rationale for undertaking systematic reviews. A systematic review synthesizes existing work in a manner that is fair and seen to be fair. For example, systematic reviews must be undertaken in accordance with a predefined search strategy. The search strategy must allow the completeness of the search to be assessed. In particular, researchers performing a systematic review must make every effort to identify and report research that does not support their preferred research hypothesis in addition to identifying and reporting research that does support it. Systematic literature reviews in all disciplines allow us to stand on the shoulders of giants and in computing, allow us to get off each other’s feet (Kitchenham 2007). The advantages of systematic literature reviews are the following (Kitchenham 2007):
The well-defined methodology makes it less likely that the results of the literature are biased, although it does not protect against publication bias in the primary studies. They can provide information about the effects of some phenomenon across a wide range of settings and empirical methods. If studies give consistent results, systematic reviews provide evidence that the phenomenon is robust and transferable. If the studies give inconsistent results, sources of variation can be studied. In the case of quantitative studies, it is possible to combine data using meta-analytic techniques. This increases the likelihood of detecting real effects that individual smaller studies are unable to detect.
The major disadvantage of systematic literature reviews is that they require considerably more effort than traditional literature reviews. In addition, increased power for meta-analysis can also be a disadvantage, since it is possible to detect small biases as well as true effects. Some of the features that differentiate a systematic review from a conventional expert literature review are:
Systematic reviews start by defining a review protocol that specifies the research question being addressed and the methods that will be used to perform the review. Systematic reviews are based on a defined search strategy that aims to detect as much of the relevant literature as possible. 13
Introduction
Systematic reviews document their search strategy so that readers can assess their rigor and the completeness and repeatability of the process (bearing in mind that searches of digital libraries are almost impossible to replicate). Systematic reviews require explicit inclusion and exclusion criteria to assess each potential primary study. Systematic reviews specify the information to be obtained from each primary study, including quality criteria by which to evaluate each primary study. A systematic review is a prerequisite for quantitative meta-analysis.
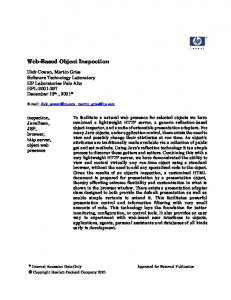
The essential process steps of an SLR are the establishment of research questions, the definition of the review protocol, conducting the review, and the analysis and reporting of the results (see Figure 1.3). Complete guidelines on how to perform SRLs can be found in Kitchenham (2007).
Figure 1.3. The Systematic Literature Review Process
1.6.2 Laboratory experiments There is an increasing understanding in the Software Engineering (SE) community that empirical studies are needed to develop or improve processes, 14
1.6 Research design methods and tools (Basili et al. 1986; Zelkowitz and Wallace 1998; Tichy 1998; Kitchenham et al. 2002). Depending on the purpose of the evaluation, three different kind of empirical studies can be carried out: surveys, case studies and laboratory experiments (Fenton and Pfleeger 1996). In Stage III, we use laboratory experiments as a research method to validate the effectiveness, efficiency and perceived satisfaction of participants using the proposed usability inspection method (Web Usability Evaluation Process). Experimentation is a crucial part of the evaluation and can help determine whether the methods used are in accordance with a particular theory (Zelkowitz and Wallace 1998). An experiment is more formal and rigorous when compared to the other strategies. We agree with Moody (2001) that action research is a useful approach for testing and improving an approach in the first stages of its definition, but not to evaluate it or compare it with similar approaches. Experiments are appropriate for investigating different aspects such as confirming or testing existing theories, evaluating the accuracy of models, or validating measures, etc. Engineering disciplines are founded on a scientific body of knowledge. For this body of knowledge to be considered scientific, its truth and validity must be proven. Empirical studies have traditionally been used in the social sciences and psychology. However, the need for more empirical studies in the field of SE has been shown. According to Basili (1996) SE can be a science laboratory in which the researcher’s role is to understand the nature of the processes and products in the context of the system, and the practitioner’s role is to build systems using knowledge. In their study of 600 papers in which new methods and technologies were proposed, Zelkowitz and Wallace (1998) observed that: (a) too many papers have no experimental validation at all, (b) too many papers use an informal form of validation (lessons learned or case studies are used about 10% of the time), and finally, (c) experimentation terminology is sloppy. Tichy (1998) discussed some arguments used to explain the lack of experimentation in the field of computer science. He concluded that only experiments test theories, and without them, computer science is in danger of drying up and becoming an auxiliary discipline. Kitchenham et al. (2002) presented a set of preliminary guidelines for Empirical research in Software Engineering. These guidelines are based on medical guidelines. Their aim is to assist researchers to design, conduct and evaluate empirical studies. Finally, several frameworks for performing empirical studies in the Software Engineering field have been proposed (Wohlin et al. 2000; Juristo and Moreno 2001). These frameworks are useful in evaluating 15
Introduction new software engineering techniques. The laboratory experiments that appear in this thesis were designed by using the framework for experimental software engineering of Wohlin et al. (2000). The experimental process underlying this framework is introduced below. 1.6.2.1 Experimental Process Figure 1.4 illustrates the main activities contained in the experimental process suggested by Wohlin et al. (2000). The first activity is the definition of the experiment, in which the experiment is defined in terms of problem, objectives and goals. The intention is to explain why the experiment is being conducted. The Goal/Question/Metric (GQM) template (Basili and Rombach 1988) for goal-oriented software measurement is commonly used as follows: Analyze For the purpose of With respect to their From the point of view of the In the context of
Figure 1.4. Overview of the experiment process
The object of study is the entity that is being studied. This may be products, processes, models, resources, etc. The purpose describes what the intention of 16
1.7 Thesis outline the experiment is. For instance, the purpose of an experiment might be to evaluate the use of different methods. The quality focus describes which effect is being studied. Examples of quality focus are: usability, effectiveness, reliability, maintenance, etc. The perspective describes what the view of the experiment is. An experiment can take the perspective of the analyst, developer, tester, researcher, manager, amongst others. Finally, the context describes where the study is conducted (the environment). It includes the description of the people (i.e., students, practitioners) and the software artifacts involved in the experiment. The next activity is to plan the experiment, and it is at this stage that the design of the experiment is determined. Here, the subjects of the study are identified, the hypothesis of the experiment is formally stated, and the independent and dependent variables are determined. The intention here is to explain how the experiment will be conducted. Furthermore, the choice of the experimental design and the instrumentation used need to be justified. The design describes how the tests are organized and run (i.e., on-line/off-line, randomization procedure, etc.). Measures are collected during the operation of the experiment. This activity has three steps: preparation, execution and data validation. The first step consists of preparing the subjects and the material needed, while the second step consists of ensuring that the experiment is conducted according to plan. In the third step, the data collected is reviewed to ensure that it is complete and valid. In the analysis and interpretation, the data collected is analyzed and interpreted. As an informal analysis, the data is first analyzed using descriptive statistics. If necessary, the data is then reduced by either removing data points or reducing the number of variables (if more than one variable provides the same data). After some data has been removed, the hypotheses are tested using the appropriate parametric or non-parametric tests. It is only possible to draw conclusions as regards the influence of the independent variables on the dependent variables if the null hypothesis is rejected. Finally, the presentation and package activity is related to preparing documentation (i.e., research paper, lab package) with the experiments’ findings. This is very useful for replication purposes or as part of an experimental database.
1.7 Thesis outline In this chapter we have presented the research motivation, problem statement, research goals, research environment and the research design followed. The remainder of this thesis is organized in the following chapters: 17
Introduction
Chapter 2: Literature review of Usability Evaluation Methods for the Web. This chapter contains the literature review of Web usability evaluation methods performed by conducting (1) a Systematic Mapping Study aimed at addressing the following research question: “What usability evaluation methods have been employed by researchers to evaluate Web artifacts, and how have these methods been used?”, and (2) a Systematic Literature Review aimed at addressing a more concrete research question:“Which usability evaluation methods have proven to be the most effective in the Web domain?”.
Chapter 3: Standards for Usability Evaluation. This chapter analyzes the existing standards for usability evaluation and the Web usability evaluation approaches based on these standards.
Chapter 4: Usability in Model-driven Web Development. This chapter presents a brief overview of the best-known Model-driven Web development processes and the usability evaluation approaches which are based on this paradigm.
Chapter 5: WUEP: A Web Usability Evaluation Process for ModelDriven Web Development. This chapter provides the methodological contribution of this thesis. It explains how usability evaluations can be integrated into Model-Driven Web development processes, describes the proposed Web Usability Model which break downs the usability concept into sub-characteristics, attributes and measures, and finally, defines the Web Usability Evaluation Process proposed (called WUEP) by providing a detailed description of its stages.
Chapter 6: Instantiation of the Web Usability Evaluation Process. This chapter provides the practical contribution of this thesis. It shows how the Web Usability Evaluation Process was instantiated in order for it to be applied to two different model-driven Web development methods: Object-Oriented Hypermedia (OO-H) and the Web Modeling Language (WebML).
18
1.7 Thesis outline
Chapter 7: Empirical validation of the Web Usability Evaluation Process. This chapter provides the empirical validation of the Web Usability Evaluation Process. A family of experiments (conducted with the instantiation of WUEP in OO-H) and a controlled experiment (conducted with the instantiation of WUEP in WebML) were carried out in order to compare the actual and perceived performance of WUEP in practice with the Heuristic Evaluation method.
Chapter 8: Conclusions and future research This chapter presents the main contributions of this thesis. Current and future research works, along with the publications that originated from this research work, are also presented.
Appendix A: Systematic research methods sources This appendix contains further information related to the literature review performed (i.e., systematic mapping study and systematic review). In particular, it includes the full list of primary studies included in the Systematic Mapping Study and in the Systematic Review; the quality assessment and data extraction forms used in the Systematic Mapping Study, and the full classification of the papers from the Systematic Mapping Study.
Appendix B: Web Usability Model This appendix contains the entire Web Usability Model with all the sub-characteristics, attributes and measures.
Appendix C: Experimental material This appendix summarizes the materials used to carry out all the experiments described in Chapter 7: data gathering documents, questionnaires, explanations of each evaluation method evaluated, and training slides.
19
PART II State of the art on Usability for Web applications
Chapter 2 2 Literature review on Usability Evaluation Methods for the Web This chapter presents a systematic mapping study on Web usability evaluation methods by addressing the following research question: “What usability evaluation methods have been employed by researchers to evaluate Web artifacts, and how have these methods been used?”. The objective of the study was to summarize the existing information about the existing usability evaluation methods for Web applications. We explained how the systematic mapping study was conducted and its obtained results. In the following, we discuss the principal findings, the implications for researchers and practitioners, and the limitations of the study. Finally, we extended this study by performing a systematic review in order to address a more concrete research question: “Which usability evaluation methods have proven to be the most effective in the Web domain?”. The objective of the study was to analyse more in-deep a subset of primary studies selected by the systematic mapping study in order to extract empirical evidences regarding the effectiveness of usability evaluation methods in practice.
2.1 Need for a systematic mapping study In recent years, several studies have reported evaluations and comparisons with regard to UEMs (e.g., Gray and Salzman 1998, Hartson et al. 2003, Somervell and McCrickard 2004). Gray and Salzman (1998) made an in-depth analysis of 23
Literature review on Usability Evaluation Methods for the Web five experiments that compare usability evaluation methods. The aim of their study was to demonstrate that there is a definite need for scientific rigor in experiments of this type. The authors claim that most experiments on comparisons of UEMs do not clearly identify which aspects of UEMs are being compared. We agree with Gray and Salzman’s criticisms, and have concluded that the results may be misleading when attempting to determine whether one UEM is more effective than another under certain conditions. However, although the studies analyzed by Gray and Salzman may be relevant in the HCI field, we consider that there is still no well-defined research method that justifies their selection of studies. Hartson et al. (2003) argue that UEMs cannot be evaluated or reliably compared since there is an important shortage of standard criteria for comparison. Several studies were analyzed in order to determine which measures had been used in the evaluation of UEMs. The majority of these studies used the thoroughness measure (the ratio between the number of real usability problems found and the number of total real usability problems). This paper showed that the majority of the comparison studies in the HCI literature on UEM effectiveness did not provide the descriptive statistics needed to perform a meta-analysis. Somervell and McCrickard (2004) presented a technique with which to evaluate heuristic evaluation methods. This study argues that the applicability of a set of heuristics to that problem set can be determined more accurately by providing the evaluators with a set of real problems. New procedures were developed in order to properly select this set of problems. Although these procedures can be applied to improve the basis of comparison for UEMs, this approach only covers a small subset of inspection methods and their applicability to specific user interfaces is ad-hoc. The criticism identified in the aforementioned studies may also be applicable to the specific domain of Web interfaces. The studies that we present below are specific to the Web domain (Cunliffe 2000, Ivory and Hearst 2001, Alva et al. 2003, Batra and Bishu 2007). Cunliffe (2000) presented an informal Web development model for mapping several UEMs proposed in literature with the stages of the Web development process. The author recognizes that the survey was not exhaustive but suggests that it could be considered as a guideline for Web designers and developers. The survey distinguishes five types of evaluation methods: competitive analysis, scenarios, inspection methods, log analysis, and questionnaires. However, several of the proposed methods are informal guidelines or means to gather information about user interaction. 24
2.1 Need for a systematic mapping study Ivory and Hearst (2001) published one of the most extensive studies in the field of usability evaluation. The study analyzed a large number of UEMs, taking into account their automation capability; it also proposed a taxonomy with which to classify them. UEMs are classified according to five dimensions: testing, inspection, inquiry, analytical modeling, and simulation. The taxonomy was applied to 128 UEMs, 58 of which were found to be suitable for Web user interfaces. The results of this survey indicate that it is important to bear in mind that the automation of usability evaluation does not capture subjective information (such as user preferences and misconceptions) since this information can only be discovered by usability testing or inquiry methods. Nevertheless, the other types of methods (analytical modeling and simulation) might be useful in helping designers to choose among design alternatives before committing themselves to expensive development costs. Finally, the study suggests promising ways in which to expand existing methods in order to better support automated usability evaluation. Alva et al. (2003) presented an evaluation of seven methods and tools for usability evaluation in software products and artifacts for the Web. The purpose of this study was to determine the degree of similarity among the methods using the principles defined in the ISO/IEC 9241-11 standard (1998). However, this is an informal survey with no defined research questions and no search process to identify the methods that were considered. Batra and Bishu (2007) reported the results obtained with two usability evaluation studies for Web applications. The objective of the first study was to compare the efficiency and effectiveness between user testing and heuristic evaluation. The results showed that both methods address very different usability problems and are equally efficient and effective for Web usability evaluation. The objective of the second study was to compare the performance between remote and traditional usability testing. The results indicate that there is no significant difference between the two methods. The analysis of the above-mentioned research works show that the majority of the published studies are informal literature surveys or comparisons with no defined research questions, no search process, no defined data extraction or data analysis process, and the reviewed UEMs are selected by author criteria. In addition, the majority of these kinds of studies deal with usability evaluations in generic interfaces from any kind of system, but few studies are specifically focused on evaluation methods that have been applied to the Web domain. Although several studies concerning UEMs have been reported, we are not aware of any systematic mapping study that has been published in the field of 25
Literature review on Usability Evaluation Methods for the Web Web usability. We are aware of three studies that have been conducted in related fields (Mendes 2005, Hornbæk 2006, and Freire et al. 2007) whose research methods belong to the evidence-based paradigm (i.e., systematic mapping studies and systematic reviews). Mendes (2005) presented a systematic review to determine the rigor of claims of Web engineering research, demonstrating that only 5% of the selected studies should be considered as rigorous. The review also found that numerous papers used incorrect terminology. For instance, they used the term experiment rather than experience report or the term case study rather than proof of concept. Suggestions were proposed to improve practices in the Web Engineering field. Hornbæk (2006) applied a research method that is close to a systematic review whose aim was to review the state-of-the-practice in usability measures. The quality of the measures selected to perform usability studies was analyzed in order to investigate whether they actually measure and cover usability issues in a broad manner. This review identified several challenges in usability research such as distinguishing and empirically comparing subjective and objective usability measures, the need for developing and employing learning and retention measures, and studying correlations between usability measures as a means for validation. Freire et al. (2007) presented a systematic review on Web accessibility to identify existing techniques for developing accessible content in Web applications. This review includes 53 studies, and it also proposes a classification of these techniques according to the processes described in the ISO/IEC 12207 standard (1998). This study also identified several research gaps such as considering accessibility in the use of techniques to generate Web applications based on models. The analysis of the previous work demonstrates that there is a need for a more systematic identification of which methods have been applied to evaluate the usability of Web applications and what their strengths and weaknesses are.
2.2 Research method We have performed a systematic mapping study by considering the guidelines that are provided in works as those of Kitchenham (2007), Budgen et al. (2008), and Petersen et al. (2008). A systematic mapping study is a means of categorizing and summarizing the existing information about a research question in an unbiased manner. 26
2.2 Research method Our systematic mapping study was performed in three stages: Planning, Conducting, and Reporting. The activities concerning the planning and conducting stages of our systematic mapping study are described in the following sub-sections and the reporting stage is presented in Section 2.3. 2.2.1 Planning stage In this stage, we performed the following activities in order to establish a review protocol: 1) establishment of the research question; 2) definition of the search strategy, 3) selection of primary studies, 4) quality assessment, 5) definition of the data extraction strategy; and 6) selection of synthesis methods. Each of them is explained in detail as follows. 2.2.1.1 Research question The goal of our study is to examine the current use of UEMs in Web development from the point of view of the following research question: “What usability evaluation methods have been employed by researchers to evaluate Web artifacts, and how have these methods been used?”. This will allow us to categorize and summarize the current knowledge concerning Web usability evaluation, to identify gaps in current research in order to suggest areas for further investigation and to provide useful knowledge for novice usability practitioners. Since our research question is too broad, it has been decomposed into more detailed subquestions in order for it to be addressed. Table 2.1 shows these research subquestions along with their motivation. Table 2.1. Research sub-questions Research Sub-questions Q1. Origin of the UEMs employed Q2. Underlying usability definition of the UEMs employed Q3. Types of UEMs employed
Q4. Type of evaluation performed by the UEMs employed
Motivation To discover whether the UEMs have been specifically crafted for the Web domain or whether they have been taken from existing UEMs from the HCI field. To discover the homogeneity in the definitions of the usability term on which the UEMs are based on. To discover which are the most frequently employed types of UEMs, and what type of UEMs can be applied in conjunction with others. To discover the degree of automation that UEMs present and which usability aspects are commonly evaluated in both manual and automated evaluations.
27
Literature review on Usability Evaluation Methods for the Web Q5. Phase(s) and Web artifacts in which the UEMs are applied
Q6. Feedback provided by the UEMs
Q7. Empirical Validation of the UEMs
To discover during which stages of the Web development process UEMs are most frequently applied, what kind of Web artifacts that are generated during the Web development process are evaluated, and how the UEMs are integrated into the Web development processes. To discover whether the UEMs provide recommendations and guidance to Web designers and developers in order to overcome usability problems or whether they only provide a list of usability problems. To discover whether the UEMs that are proposed in the existing literature have been validated through empirical studies.
2.2.1.2 Search strategy The main digital libraries that were used to search for primary studies were: IEEEXplore, ACM Digital Library, Springer Link, and Science Direct. We also manually searched the conference proceedings and journals in which studies relevant to the Web Usability domain had previously been published:
Conferences and workshops: o World Wide Web conference – WWW (2003-2009), Usability and accessibility & Web engineering tracks. o International conference on Web Engineering – ICWE (20032009). o International Web Usability and Accessibility workshop – IWWUA (2007-2009). Journals and books: o Internet Research Journal: “Electronic Networking Applications and Policy” - IR. Volumes 4-19 (1994-2009) (ed. Emerald Group Publishing Limited). o Journal of Usability Studies – JUS. Volumes 1-5 (2005-2009). Special issues: o International Journal of Human-Computer Studies “Web Usability” Special Issue - 1 volume published in 1997 (IJHCS). o IEEE Internet Computing Special issue on “Usability and the Web” - 1 volume published in 2002 (IEEEIC).
In order to perform the automatic search of the selected digital libraries, we used a search string (see Table 2.2) consisting of three parts with the aim of 28
2.2 Research method covering the concepts that represent the Web usability evaluation domain. The first part is related to the studies that are developed in the Web domain, the second part is related to the studies that are related to the usability domain, and the third part is related to studies that present evaluations. Table 2.2 shows the search string in which Boolean OR has been used to join alternate terms and synonyms in each main part; and Boolean AND has been used to join the three main parts. Table 2.2. Search string applied Concept Web Usability Evaluation
Alternative terms & Synonyms (web OR website OR internet OR AND www) (usability OR usable) AND (evalu* OR assess* OR measur* OR experiment* OR stud* OR test* OR method* OR techni* OR approach*)
The asterisk symbol ‘*’ signifies any character whose purpose it is to include any word variation of each search term (e.g., the search term ‘evalu*’ includes the following words: evaluation OR evaluate OR evaluates OR …)
The search was conducted by applying the search string to the same metadata (i.e., title, abstract and keywords) of each article for all the sources (the search string syntax was adapted in order for it to be applied in each digital library). These search terms were also taken into account in the other sources that were manually inspected in order to perform a consistent search. The period reviewed included studies published from 1996 to 2009. This starting date was selected because 1996 was the year in which the term “Web Engineering” was coined and it has been used as starting date in other related evidence-based works in the Web domain such as that of Mendes et al. (2005). As the search was performed in 2010, publications pertaining to that year and later ones were not considered in the systematic mapping study. In order to validate our search strategy, we compared the results obtained with a small sample of 12 primary studies (Alva et al. [S06], Atterer and Schmidt [S11], Batra and Bishu [S18], Blackmon et al. [S23], Chi [S45], Conte et al. [S53], Cunliffe [S61], Hornbæk and Frøkjær [S91], Ivory and Hearst [S97], Matera et al. [S125], Molina and Toval [S130], and Olsina et al. [S142]) which we had previously identified as studies that should appear in the results in order to ensure that the search string was able to find the sample. Note that the references of the included studies, which are cited by “[S---]”, can be found in Appendix A.1. In addition, the starting date of the search was validated by checking the references of the most relevant primary studies in order to detect 29
Literature review on Usability Evaluation Methods for the Web whether any papers were missing. Since this validation was applied after the primary studies had been selected, this is explained in the following section. 2.2.1.3 Selection of primary studies Each study that was retrieved from the automated search or the manual search was evaluated by three conductors (the author of this thesis and his both supervisors) in order to decide whether or not it should be included by considering its title, abstract and keywords. Discrepancies in the selection were solved by consensus among the three conductors after scanning the entire paper. The studies that met at least one of the following inclusion criteria were included:
Studies presenting the definition of UEM(s) that are applied to the Web domain. Studies reporting usability evaluations in the Web domain through the employment of existing UEM(s)
The studies that met at least one of the following exclusion criteria were excluded:
Papers that are not focused on the Web domain. Papers presenting only recommendations, guidelines, or principles for Web design. Papers presenting only usability attributes and their associated metrics. Papers presenting only accessibility studies. Papers presenting techniques on how to aggregate usability measures. Papers presenting testing processes that are focused on checking functional aspects. Introductory papers for special issues, books, and workshops. Duplicate reports of the same study in different sources. Papers not written in English.
The references of the selected studies (only those which had been found to be most relevant by each digital library) were followed in order to check whether other relevant studies could be included in our search. This procedure allowed us to validate the starting date of our systematic mapping study. Although relevant studies related to the usability evaluation domain were found (e.g. Nielsen 1994), no relevant studies specifically focused on the Web domain were found prior to 1996. The reliability of inclusion of a candidate study in the systematic mapping study was assessed by applying Fleiss’ Kappa (Fleiss 1981). Fleiss’ Kappa is a 30
2.2 Research method statistical measure for assessing the reliability of agreement between a fixed number of raters when classifying items. This measure is scored as a number between 0 (poor agreement) and 1(full agreement). We asked three independent raters to classify a random sample of 20 studies, 10 of which had previously been included in the mapping study and 10 of which had not. The Fleiss’ kappa obtained was 0.84. This indicates an acceptable level of agreement among raters. 2.2.1.4 Quality Assessment A three-point Likert-scale questionnaire was designed to provide a quality assessment of the selected studies. The questionnaire contained three subjective closed-questions and two objective closed-questions. The subjective questions were: a) The study presents a detailed description of the UEM employed. b) The study provides guidelines on how the UEM can be applied. c) The study presents clear results obtained after the application of the UEM. The possible answers to these questions were: “I agree (+1)”, “Partially (0)”, and “I don’t agree (-1)”. The objective questions were as follows: d) The study has been published in a relevant journal or conference proceedings. The possible answers to this question were: “Very relevant” (+1), “Relevant (0)”, and “Not so relevant (-1)”. This question was rated by considering the order of relevance provided by the digital library, the CORE conference ranking (A, B, and C conferences), and the Journal Citation Reports (JCR) lists. e) The study has been cited by other authors. The possible answers to this question were: “Yes (+1)” if the paper has been cited by more than 5 authors; “Partially (0)” if the paper has been cited by 1-5 authors; and “No (-1)” if the paper has not been cited. This question was rated by considering the Google scholar citations count. It is important to note that the minimum score for early publications (i.e., papers published in 2009) is considered as “Partially (0)” in order not to penalize them. Each of the studies selected has a score for each closed-question that has been calculated as the arithmetic mean of all the individual scores from each reviewer. The sum of the five closed-question scores of each study provides a final score (an integer between -5 and 5). These scores were not used to 31
Literature review on Usability Evaluation Methods for the Web exclude papers from the systematic mapping study but were rather used to detect representative studies in order to discuss each research sub-question. 2.2.1.5 Data extraction strategy The data extraction strategy that was employed was based on providing the set of possible answers for each research sub-question that had been defined. This strategy ensures the application of the same extraction data criteria to all selected papers and it facilitates their classification. The possible answers to each research sub-question are explained in more detail as follows. With regard to Q1 (Origin of the UEMs employed), a paper can be classified in one of the following answers: a) New: if it presents at least one evaluation method that is specifically crafted for the Web. b) Existing: if the paper uses existing methods from the HCI field in the Web domain. With regard to Q2 (Underlying usability definition of UEMs employed), a paper can be classified in one of the following answers: a) Standard: if the underlying usability definition of the UEM is based on standards such as ISO/IEC 9241-11 (1998) or ISO/IEC 9126-1 (2001). b) Ad-hoc: if the underlying usability definition of the UEM is based on an ad-hoc definition by other authors. With regard to Q3 (Types of UEMs employed), the taxonomy proposed by Ivory and Hearst (2001) was employed in order to classify the UEMs. A paper can be classified in one or more of the following answers: a) Testing: if it involves an evaluator observing participants interacting with a user interface to determine usability problems (e.g., think-aloud protocol, remote testing, log file analysis). b) Inspection: if it involves an expert evaluator using a set of criteria to identify potential usability problems (e.g., heuristic evaluation, guideline reviews, or cognitive walkthroughs). c) Inquiry: if it presents a method that gathers subjective input from participants, such as their preferences or their feelings (e.g., focus group, interviews, and questionnaires). d) Analytical Modeling: if it presents an engineering approach that enables evaluators to predict usability by employing different kinds of models (e.g., GOMS analysis, Cognitive Task Analysis). 32
2.2 Research method e) Simulation: if it simulates user interaction through any kind of simulation algorithm or the analysis of usage data (e.g. Petri net models, information scent). With regard to Q4 (Type of evaluation performed by the UEMs), a paper can be classified in one of the following answers: a) Automated: if it presents a tool that automatically performs the entire method or a large portion of the method (e.g., log analyzers, source code or model checkers, user simulators). This means that the evaluator only needs to interpret the results since the main evaluation tasks are performed automatically. b) Manual: if it presents a usability evaluation that is performed manually, signifying that the method can be computer-aided but that the main evaluation tasks need to be performed by a human evaluator (e.g., interviews, user questionnaires, think-aloud methods). With regard to Q5 (Phase(s) and Web artifacts in which the UEMs are applied), a paper can be classified in one or more ISO/IEC 12207 (1998) highlevel processes: a) Requirements: if the artifacts that are used as input for the evaluation include high-level specifications of the Web application (e.g., task models, uses cases, usage scenarios). b) Design: if the evaluation is conducted on the intermediate artifacts that are created during the Web development process (e.g., navigational models, abstract user interface models, dialog models). c) Implementation: if the evaluation is conducted at the final user interface or once the Web application is completed. With regard to Q6 (Feedback provided by the UEMs), a paper can be classified in one of the following answers: a) Yes: if the UEM provides recommendations or guidance to the designer on how the detected usability problems can be corrected. b) No: if the UEM is aimed at only reporting usability problems. With regard to Q7 (Empirical Validation of the UEMs), a paper can be classified in one of the following types of strategies that can be carried out depending on the purpose of the validation and the conditions for empirical investigation (Fenton and Pfleeger 1996): a) Survey: if it provides an investigation performed in retrospect, when the method has been in use for a certain period of time in order to obtain feedback about the benefits and limitations of the UEM. 33
Literature review on Usability Evaluation Methods for the Web b) Case study: if it provides an observational study in which data is collected to evaluate the performance of the UEM throughout the study. c) Controlled experiment: if it provides a formal, rigorous, and controlled investigation that is based on verifying hypotheses concerning the performance of the UEM. d) No: if it does not provide any type of validation or if it only presents a proof of concept. In order to validate our data extraction strategy, the Fleiss’ Kappa statistic (Fleiss 1981) was applied to assess the agreement among evaluators when the studies were classified into the possible answers. We asked three independent raters to classify a random sample of 15 studies that had previously been included in the review. Average Fleiss’ kappas for each research sub-question were: Q1: 0.84; Q2: 0.95; Q3: 0.79; Q4: 0.93; Q5: 0.81; Q6: 0.83 and Q7: 0.81. Overall, this result suggests an acceptable level of agreement among raters. A template for both quality assessment and data extraction activities was designed to make easier the management of the data extracted for each paper (see Appendix A.2). 2.2.1.6 Synthesis methods We applied both quantitative and qualitative synthesis methods. The quantitative synthesis was based on:
Counting the primary studies that are classified in each answer from our research sub-questions. Defining bubble plots in order to report the frequencies of combining the results from different research sub-questions. A bubble plot is basically two x-y scatter plots with bubbles in category intersections. This synthesis method is useful to provide a map and giving a quick overview of a research field (Petersen et al. 2008). Counting the number of papers found in each bibliographic source per year.
The qualitative synthesis is based on:
34
Including several representative studies for each research sub-question by considering the results from the quality assessment. Summarizing the benefits and limitations of the UEMs classified in each proposed research sub-question.
2.3 Results 2.2.2 Conducting stage The application of the review protocol yielded the following preliminary results (see Table 2.3): Table 2.3. Results of the conducting stage
Automated search
Source IEEExplore (IEEE) ACM DL (ACM) Springer Link (SL) Science Direct (SD)
Manual search
Total WWW Conference ICWE Conference IWWUA Workshop Internet Research Journal Journal of Usability Studies International Journal of HCS IEEE Internet Computing Other Total Overall results from both searches
Potential studies 863 960 571 179 2573 46 32 20 11 9 7 5 130 2703
Selected Studies 83 63 16 11 173 5 7 4 4 5 1 3 4 33 206
A total of 206 research papers were therefore selected in accordance with the inclusion criteria. We found several issues at this stage:
Some studies had been published in more than one journal/conference. In this case, we selected only the most complete version of the study. Some studies appeared in more than one source. In this case, they were taken into account only once according to our search order, which was the following: IEEEXplore, ACM, Springer Link, Science Direct, etc.
The search results revealed that the research papers concerning Web usability had been published in several conferences/journals related to different fields such as Human-Computer Interaction (HCI), Web Engineering (WE), and other related fields.
2.3 Results The overall results, which are based on counting the primary studies that are classified in each of the answers to our research sub-questions, are presented in 35
Literature review on Usability Evaluation Methods for the Web Table 2.4. Any readers who wish to view the complete list of selected studies included in this systematic mapping study are referred to Appendix A.1. Both the classification of the selected papers in each category and their quality scores are provided in Appendix A.3. Table 2.4. Results of the systematic mapping
Research sub-questions Q1. Origin of the UEMs employed Q2. Underlying usability definition of the UEMs employed Q3. Types of UEMs employed
Q4. Type of evaluation performed by the UEMs employed Q5. Phase(s) and Web artifacts in which the UEMs are applied Q6. Feedback provided by the UEMs Q7. Empirical Validation of the UEMs
Possible answers New Existing Standard Ad-hoc User testing Inspection Inquiry Analytical Modeling Simulation Manual Automated Requirements Design Implementation Yes No Survey Case Study Experiment No
Results # % Studies Percentage 81 39.32 % 125 60.68 % 37 17.96 % 169 82.04 % 121 58.74 % 88 42.72 % 72 34.95 % 44 17 143 63 7 53 187 65 141 25 32 34 115
21.36 % 8.25 % 69.42 % 30.58 % 3.40 % 25.73 % 90.78 % 31.55 % 68.45 % 12.14 % 15.53 % 16.50 % 55.83 %
Note that Q3 and Q5 are not exclusive; a study can be classified in one or more of the answers. The summation of the percentages is therefore over 100%.
The following sub-sections present the analysis of the results from each research sub-question, the map created by combining different sub-questions, and to what extent the UEMs for the Web domain may be an interest topic after analyzing the number of research studies for each year covered. 2.3.1 Origin of the UEMs employed The results for sub-question Q1 (Origin of the UEMs employed) revealed that around 39% of the papers reviewed had usability evaluation methods that were specifically designed for the Web (see Table 2.4). For instance, we found 36
2.3 Results representative examples of these methods in Blackmon et al. [S23], Conte et al. [S53], and Triacca et al. [S185]. Blackmon et al. [S23] proposed the Cognitive Walkthrough for the Web method (CWW). CWW is an adaptation of the original Cognitive Walkthrough (CW) method. Since CWW was crafted for applications that support use by exploration, CWW is presented as an appropriate method for the evaluation of Web sites. The aim of CWW is to simulate users performing navigation tasks on a Web site by assuming that the users perform goal-driven exploration. Conte et al. [S53] presented the Web Design Perspectives method (WDP). This method extends and adapts the generic heuristics for user interfaces proposed by Nielsen (1994) with the aim of drawing closer to the dimensions that characterize a Web application: content, structure, navigation and presentation. Triacca et al. [S185] proposed a usability inspection method for Web applications called the Milano-Lugano Evaluation Method (MiLE+). This method distinguishes between the application-independent analysis and the application-dependent analysis. The former is related to a technical and objective perspective, whereas the latter is related to the specific context of use of the Web application and how it meets user goals. The remaining 61% of the studies reported the use of existing evaluation methods from the HCI field such as cognitive walkthroughs, heuristic evaluations, questionnaires or remote user testing (see Table 2.4). These methods have been defined to be applied in any kind of user interfaces without considering the application domain. These results may indicate that there are more UEMs adapted from existing methods to be applied in the Web domain than UEMs that have been defined by considering the specific characteristics of Web applications. We observed that the UEMs for the Web pay special attention to content and navigational issues, and not only to the user behavior. This fact is relevant since the main dimensions that define Web applications are content, navigation and presentation. We consider that UEMs for the Web should address the usability concept in a broader manner by considering usability aspects that are related to the aforementioned dimensions, and not only focus on usability aspects related to the effectiveness and efficiency of users in performing tasks, or the end-user satisfaction. 2.3.2 Underlying usability definition of the UEMs The results for sub-question Q2 (Underlying usability definition of the UEMs) revealed that around 82% of the papers reviewed present UEMs that are based on an ad-hoc definition of the usability concept (see Table 2.4). On the other hand, around 18% of the papers reviewed present UEMs whose definition of 37
Literature review on Usability Evaluation Methods for the Web the usability concept is based on standards (see Table 2.4). For instance, we found representative examples of these methods in Alonso-Rios et al. [S04], Moraga et al. [S131], and Oztekin et al. [S144]. Alonso-Rios et al. [S04] presented an HTML analyzer that parses HTML code in order to extract usability information from Web pages. This analyzer basically examines usability aspects which are related to ease of navigation, understandability, flexibility, and compatibility, and these are based on the World Wide Web Consortium (W3C) guidelines (2008). These aspects are classified into six categories related to the Web application source code (i.e., Web page, images, forms, tables, lists, and links). Moraga et al. [S131] presented a UEM for evaluating second generation Web portals (i.e., portlets). This method is based on a usability model that decomposes usability into measurable concepts and attributes. The measurable concepts (e.g., understandability, learnability) of this usability model are based on the usability sub-characteristics proposed in the quality model of the ISO/IEC 9126-1 standard (2001). Oztekin et al. [S144] proposed the UWIS methodology for usability assessment and design of Web-based information systems. UWIS is a checklist whose aim is to provide usability indexes. These usability indexes are defined by considering the usability sub-characteristics proposed in the ISO/IEC 9241-11 (1998) (i.e., effectiveness, efficiency and satisfaction), the dialogue principles for user interface design according to the ISO/IEC 9241-10 (1996) standard, and the usability heuristics proposed by Nielsen (1994). The results for this sub-question indicate that the UEMs are based on different underlying concepts of usability. This raises several issues, since these UEMs may not evaluate the same aspects of usability. The comparison of UEMs in order to determine their performance is therefore considered to be a complex task. This problem results from the fact that the usability concept has not been homogeneously defined. Although several approaches present UEMs whose usability definition is based on standards, these standards are not consistent with each other. This could be alleviated, at least to some extent, if new proposals consider the next generation of standards (i.e., ISO/IEC 25000 SQuaRE standard (2005) in progress) in order to define the aspects of usability to be evaluated. The SQuaRE standard integrates both perspectives of the usability concept: usability of the software product which is based on the ISO/IEC 9126-1 standard; and usability in use which is based on the ISO/IEC 9241-11 standard. This provides a comprehensive structure for the role of usability as part of software quality (Bevan 2009). 38
2.3 Results 2.3.3 Types of UEMs employed The results for sub-question Q3 (Types of UEMs employed) revealed that the most frequently used type of UEM is user testing, signifying that around 59% of the papers reviewed reported some kind of testing involving users (see Table 2.4). These results may indicate that most evaluations are performed during the later stages of the Web development lifecycle. We identified the following representative sub-types of user testing methods:
Think-Aloud Protocol: users think aloud while they are performing a set of specified tasks. Examples of this UEM sub-type are reported in works such as Krahmer and Ummelen [S118], Stefano et al. [S171], and Van Waes [S188]. Question-Asking Protocol: testers ask the users direct questions. Examples of this UEM sub-type are reported in the studies conducted by Corry et al. [S56], Gee [S75], and Wang and Liu [S193]. Performance Measurement: testers or software tools record usage data and obtain statistics during the test. Examples of this UEM sub-type are reported in works such as Nakamichi et al. [S134], Nakamichi et al. [S135], and Norman and Panizzi [S138]. Log Analysis: testers or software tools analyze usage data. Examples of this UEM sub-type are reported in works such as Chi [S45], Costagliola and Fuccella [S58], and Kazienko and Pilarczyk [S110]. When usage data is particularly related to gaze points obtained from the analysis of eye movement, the method is called Eye Tracking. Examples of Eye Tracking methods are reported in works such as Cooke and Cuddihy [S55], and De Kock et al. [S63]. Remote Testing: Testers and users are not co-located during the test. These methods are commonly applied in conjunction with Log Analysis methods. Examples of this UEM sub-type are reported in works such as Lister [S121], Paganelli and Paterno [S146], and Thompson et al. [S180].
Inspection methods account for around 43% of the papers reviewed (see Table 2.4). Although inspection methods are intended to be performed by expert evaluators, most of them were applied by novice evaluators such as Web designers or students in order to compare the results. We identified the following representative sub-types of inspection methods:
Heuristic evaluation: experts identify heuristic violations in Web artifacts. Examples of this UEM sub-type are reported in works such as 39
Literature review on Usability Evaluation Methods for the Web
Allen et al. [S03], Nielsen and Loranger [S136], and Oztekin et al. [S144]. Cognitive Walkthrough: experts simulate a user’s goal achievement by going through a set of tasks. Examples of this UEM sub-type are reported in works such as Clayton et al. [S52], and Filgueiras et al. [S69]. Core ideas of cognitive walkthroughs have led to the emergence of concrete methods for the Web domain such as the Cognitive Walkthrough for the Web (Blackmon et al. [S23]), and the Metaphor of Human-Thinking (Hornbæk and Frøkjær [S91]). Perspective-based inspection: experts conduct an oriented and narrow evaluation that can be based on design perspectives, inspectors’ tasks, or metric calculation. Some examples of this sub-type of methods are the Web Design Perspectives (Conte et al. [S53]), the Abstract-Tasks Inspection (Costabile and Matera [S57]), and the WebTango Methodology (Ivory and Hearst [S98]). Guideline review: experts verify the consistency of Web artifacts by using a set of usability guidelines. Examples of this UEM sub-type are reported in works such as Becker and Mottay [S20], and Vanderdonckt et al. [S189]. Inquiry methods account for around 35% of the papers reviewed (see Table 2.4). Since these methods focused on gathering subjective data from users, the majority were used in combination with other types of methods such as testing or inspection to perform a more complete evaluation. We identified the following representative sub-types of inquiry methods: Questionnaire: users provide answers to specific questions. Examples of this UEM sub-type are reported in works such as Cao et al. [S37], and Zaharias [S202]. Interviews: One user and one expert participate in a discussion session concerning the user’s attitude towards the artifact to be evaluated. Examples of this UEM sub-type are reported in works such as Van Velsen et al. [S187], and Vatrapu and Pérez-Quiñones [S190]. Focus group: Multiple users participate in a discussion session concerning their attitudes towards the artifact to be evaluated. Examples of this UEM sub-type are reported in works such as Go et al. [S77], and Jung et al. [S105].
Analytical Modeling accounts for around 21% of the papers reviewed (see Table 2.4). This is intended to model certain aspects such as user interfaces, task environments, or user performance in order to predict usability. We 40
2.3 Results identified the following representative sub-types of Analytical Modeling methods:
Cognitive Task Analysis: User tasks are modeled in order to predict usability problems. Examples of this UEM sub-type are reported in works such as Paganelli and Paterno [S145], and Saward et al. [S158]. Task environment analysis: Evaluation of the mapping between users’ goals and user interface tasks. Examples of this UEM sub-type are reported in works such as Ahn et al. [S02], and Bolchini et al. [S29]. GOMS analysis: Human task performance is modeled in terms of Goals, Operators, Methods, and Selection rules (GOMS) in order to predict execution and learning time. Examples of this UEM sub-type are reported in works such as Tonn-Eichstädt [S184].
Simulation methods only account for around 8% of the papers reviewed (see Table 2.4). Few methods can be considered to be only simulation methods, since they present characteristics from other kinds of methods (particularly from analytical modeling). These are mainly based on agents or algorithms whose intention is to simulate user behavior. For example, Chi et al. [S46] presented the Information Scent Absorption Rate, which measures the navigability of a Website by computing the probability of users reaching their desired destinations on the Web site. The InfoScent Bloodhound Simulator tool was developed to support this method with the aim of generating automated usability reports. This paper presents a user study which argues that Bloodhound correlates with real users surfing for information on four Websites and that it can reduce the need for human work during usability testing. 2.3.4 Type of evaluation performed by the UEMs The results for sub-question Q4 (Type of evaluation performed by the UEMs) revealed that around 69% of the studies performed the evaluations manually whereas around 31% of the studies reported the existence of some kind of automated tool to support the proposed method (see Table 2.4). These tools are mainly based on source code checking, usage data or log analysis, and user simulation. Some examples of automated evaluations were found in Becker and Berkemeyer [S19], Ivory and Megraw [S99], and Vanderdonckt et al. [S189] Becker and Berkemeyer [S19] proposed a technique to support the development of usable Web applications. This technique is supported by a GUI-based toolset called RAD-T (Rapid Application Design and Testing) which allows early usability testing during the design stage. Usability evaluations are possible since Self-Testing Hypertext Markup Language (ST41
Literature review on Usability Evaluation Methods for the Web HTML) was developed as an HTML extension in order to integrate usability and functional requirements into Web page items. These requirements can be verified through an inspection of the ST-HTML source code. Ivory and Megraw [S99] proposed the WebTango methodology. The purpose was to define a set of quantitative measures and compute them for a large sample of rated Web interfaces. Data obtained from these computations can be used to derive statistical models from the measures and ratings. This approach not only allows the statistical models to be employed to predict ratings for new Web interfaces, but the significance of the measures can also be evaluated. A tool was developed to automate various steps of this methodology, such as obtaining of the statistical models or the calculation of certain measures. Vanderdonckt et al. [S189] proposed a usability evaluation method based on the automated review of guidelines. Usability and accessibility guidelines from literature were interpreted and expressed in the Guideline Definition Language (an XML-compliant formal language). In this approach, a guideline can be evaluable if HTML elements reflect its semantics. These guidelines mainly focus on aspects such as color combinations, alternative text for visual content, etc. A tool was developed to illustrate how these formal guidelines can be checked in Web page source code. The results for this sub-question indicate that the majority of the efforts in automated UEMs are focused on the source code since it is the only artifact employed in most cases. There is a shortage of this kind of methods which can evaluate, for example, intermediate artifacts such as abstract user interfaces or navigational models. Most of the tools found are based on the operationalization of usability guidelines (mostly focused on aesthetic issues), or on calculating and interpreting usability measures at the final user interface level. However, it is important to note that automated usability evaluation has several drawbacks. It is oriented towards gathering objective data, hence, user perceptions and user context, cannot be considered. Although automated UEMs can reduce efforts and resources, they should be used in conjunction with other UEMs in order to consider as many usability dimensions as possible. 2.3.5 Phase(s) and Web artifacts in which the UEMs are applied The results for sub-question Q5 (Phases and Web artifacts in which the UEMs are applied) revealed that around 90% of the evaluations are performed at the implementation level of the Web application (see Table 2.4). This kind of usability evaluations is also known as summative evaluation. It takes place after 42
2.3 Results the product has been developed, or possibly when a prototype version is ready. The artifacts that were most commonly analyzed were the final Web user interfaces and the logs that contain the user actions. For instance, Nakamichi et al. [S135] presented the WebTracer tool for recording and analyzing the user’s operations on Web pages while they directly interact with the website. The aim was to collect quantitative data to detect possible usability problems without interrupting the user’s operation. Around 26% of the studies (see Table 2.4) describe evaluations performed at the design level, employing the intermediate artifacts obtained during the Web development process (e.g., abstract user interfaces, navigational models). This kind of usability evaluations is also known as formative evaluation. For instance, Atterer and Schmidt [S11] proposed a model-based usability validator prototype. The aim was to perform an analysis of models that represent enriched user interfaces. This approach takes advantage of navigational and presentation models that are available in model-driven Web development methods (e.g., WebML (Ceri et al. 2000) or OO-H (Gómez et al. 2001)) since they contain data concerning the ways in which the site is intended to be traversed and abstract properties of the page layout. Only around 3% of the studies (see Table 2.4) describe evaluations performed at the requirements specification level (e.g., laboratory user testing of paper mock-ups or prototypes). One representative example was found in Molina and Toval [S130] who suggested integrating usability requirements in the development of model-driven Web applications is presented. The aim is to extend the expressiveness of the models that define the navigation of the Web application in order to represent usability requirements that can be evaluated through the application of automated metrics. The results for this sub-question indicate that there is a need for UEMs that can be used at early stages of the Web development lifecycle. Although evaluations at the implementation stage are necessary to explore user behavior, since there are usability aspects that can only be accessed through user interaction, applying UEMs only at this stage can lead to various difficulties since more of them may be detected later. Correcting these problems can make the maintenance of the source code difficult. Usability evaluations must be performed not only at the implementation stage but also during each phase of the Web application development. If usability problems are detected earlier, the quality of the final Web applications can be improved, thus saving resources in the implementation stage. This could contribute towards a reduction in the cost of the Web development process. 43
Literature review on Usability Evaluation Methods for the Web 2.3.6 Feedback provided by the UEMs The results for sub-question Q6 (feedback provided by the UEMs) revealed that around 68% of the studies only provided reports on usability problems, giving no explicit feedback and guidance to the corresponding design activities. The remaining studies (around 32%) also offered suggestions for design changes based on the usability problems detected (see Table 2.4). Some representative examples of this were found in Blackmon et al. [S24], Chi [S45], and Hornbæk and Frøkjær [S92]. Blackmon et al. [S24] reported two experiments aimed at presenting Cognitive Walkthrough for the Web (CWW) as an effective UEM with which to repair usability problems related to unfamiliar and confusable links. CWW uses the Latent Semantic Analysis algorithm (LSA) to compute the semantic similarities between the user goals and the headings/links/descriptions of other widgets. This enables developers to very quickly check whether the Web application links are also comprehensible and not confusing for their intended users, and if not, it provides guidance on how to repair them. Chi [S45] presented a visualization method based on data mining for Web applications. The purpose is to apply a set of techniques in order to help developers to understand usage data, content changes and linkage structures. These techniques can be used to identify specific usability problems on large Web sites where they discover major traffic patterns and propose changes to improve how the user accesses the Web content. The ScentViz prototype was developed to implement these techniques and to show how usability evaluations can be enhanced using visualization methods. Hornbæk and Frøkjær [S92] reported on an experiment aimed at comparing the assessment of both the usability and utility of problems, and redesign suggestions. The results of the experiment showed how redesign proposals were assessed by developers as being of higher utility than simple problem descriptions. Usability problems were seen more as a help in prioritizing ongoing design decisions. The results for this sub-question indicate that most of the UEMs have been designed to generate a list of usability problems, but not to provide explicit guidance on how these problems can be properly corrected. Usability evaluation must take into account both activities: discovering and repairing usability problems. Simply employing lists of usability problems is not sufficient. The developers need more support to explore new alternatives with which to improve their designs. This indicates a need for new UEMs or extensions of existing methods to incorporate redesign issues as an integral 44
2.3 Results part of the evaluation method. If this goal is to be attained, the evaluation methods need to be integrated into the Web development process to a greater extent in order to understand the traceability between the usability problems detected and the artifacts that originate these usability problems. 2.3.7 Empirical validation of the UEMs The results for sub-question Q7 (Empirical Validation of the UEMs) revealed that 56% of the studies did not conduct any type of validation of the method (see Table 2.4). Around 12% of the studies presented UEMs which had been validated through a survey (see Table 2.4). For instance, Zaharias [S202] proposed a questionnaire for evaluating e-learning applications. Two pilot trials were conducted and analyzed in order to validate the coverage of the questionnaire. Results obtained from the empirical evaluation allowed new versions of the questionnaire to be developed in order for it to be more reliable. Around 16% of the papers report case studies (see Table 2.4). For instance, Matera et al. [S125] presented a case study in which three methods were applied to the evaluation of a Web application: design inspections to examine the hypertext specification, Web usage analysis to analyze user behavior, and a heuristic evaluation to analyze the released prototypes and the final Web application. The case study took place in an iterative development process, in which versions of Web applications were released, evaluated, and improved by taking into account the problems encountered during the evaluation. Around 17% of the papers report controlled experiments (see Table 2.4). For instance, Bolchini and Garzotto [S30] performed an empirical study to evaluate the quality of the MiLE+ method. The concept of quality was operationalized into attributes in order to facilitate the measuring process. These attributes were: the degree to which the method supports the detection of all usability problems (performance) and how fast this detection (efficiency) takes place; the effort needed by an evaluator to perform an evaluation with the method (cost-effectiveness) and the ease with which the method was learnt (learnability). The results show that the MiLE+ method achieved acceptable levels in all attributes, providing a good support for inexperienced evaluators. However, this experiment was conducted solely with experts and novice users, and the results obtained were not compared with other methods, making it difficult to draw conclusions as to why this method should be used rather than others. The results for this sub-question show that experiments (17%) and case studies (16%) were the most frequently employed types of empirical methods used for 45
Literature review on Usability Evaluation Methods for the Web validation purposes. This is explained by the fact that experimentation is a common research method in the Human-Computer Interaction field, and case studies are commonly used in the Software Engineering field. However, since only 44% of the papers included validations, there would appear to be a need for more validation studies. 2.3.8 Mapping results The seven research sub-questions were combined in order to establish a mapping with the aim of providing an overview of the Web usability evaluation field. This mapping allows us to obtain more information about how the results from each sub-question are related to the others, and what the possible research gaps are. Figure 2.1(a) shows the mapping results obtained from research sub-questions Q1 (Origin) and Q2 (Usability definition) in comparison to research subquestions Q5 (Stages) and Q7 (Validation). These results may indicate that:
The majority of UEMs that are specifically crafted for the Web are applied at the implementation stage of the Web development process and present more empirical validations than the UEMs that were taken from the HCI field. The majority of UEMs whose underlying usability definition is based on standards are likely to present more empirical validations compared with the number of UEMs whose underlying usability definition is based on ad-hoc definitions. However, the majority of these UEMs are applied in later stages of the Web development process.
Figure 2.1(b) shows the mapping results obtained from research sub-questions Q1 (Origin) and Q2 (Usability definition) in comparison to research subquestions Q4 (Type of evaluation) and Q6 (Feedback). These results may indicate that:
Fewer UEMs adapted from existing HCI methods have been automated than UEMs developed specifically for the Web Most UEMs have been designed to report only a list of usability problems, independent of their origin or underlying usability definition.
Figure 2.1(c) shows the mapping results obtained from research sub-questions Q5 (Stages) and Q7 (Validation) in comparison to research sub-questions Q4 (Type of evaluation) and Q3 (Type of UEM). These results may indicate that: 46
The majority of automated UEMs are applied at the implementation stage where the most common method is user testing. However,
2.3 Results
inspection methods are likely to be used at earlier stages of the Web development process, especially in the design stage. There is a need to perform more empirical validations of the UEMs, regardless of the type of method and the type of evaluation performed.
Figure 2.1. Mapping results obtained from research sub-questions combinations (I)
Figure 2.2(a) shows the mapping results obtained from research sub-question Q3 (type of UEM) when compared with itself. These results may indicate that:
UEMs are not used in isolation since it is a common practice to apply several different UEMs in order to address a broad range of usability problems. Inquiry methods are likely to be combined with user testing and inspection methods in order to provide subjective feedback from users.
Figure 2.2(b) shows the mapping results obtained from research sub-questions Q1 (Origin), Q2 (Usability definition), and Q3 (stages) when combined. These results may indicate that: 47
Literature review on Usability Evaluation Methods for the Web
There is a shortage of UEMs whose usability definition is based on standards, regardless of their origin or type of method. The majority of UEMs that are specifically crafted for the Web are defined as inspection, user testing and analytical modeling methods.
Figure 2.2(c) shows the mapping results obtained from research sub-questions Q3 (Type of UEM), Q4 (Type of evaluation) and Q6 (Feedback) when combined. These results may indicate that:
User testing methods are likely to be more automated than the other types of usability evaluation methods. Only few automated methods provide explicit recommendations and guidance to Web developers in comparison to the manual usability evaluation methods.
Figure 2.2. Mapping results obtained from research sub-questions combinations (II)
2.3.9 Interest of the topic Web usability evaluation has led to the appearance of a large number of studies in recent years. These studies can be found in papers published mainly in the 48
2.3 Results fields of Human-Computer Interaction and Web Engineering. All the studies agree on the importance of usability evaluations in the Web domain. However, the scope of most of the studies found is centered on reporting the usability evaluation results of a specific Web application. There are fewer studies with a broad scope, implying that almost none of the papers provided results that can be generalized for a particular Web vertical domain (e.g., e-commerce, egovernment, e-learning). Figure 2.3 shows the number of selected publications on Web usability evaluation methods by year and source. The analysis of the number of research studies on Web usability showed that there has been a growth of interest in this topic, particularly since 2004.
Figure 2.3. Number of publications on Web usability by year and source
The relative increase in this topic was of about 766% (from 3 selected studies in 1997 up to 26 selected studies in 2009). This can be considered as an indicator of how Usability Evaluation Methods for the Web have gained importance in recent years. The following terms: Software Engineering, Web Engineering, Human-Computer Interaction, and Usability Evaluation were also sought in the same digital libraries that were selected in our search strategy with the objective of obtaining the relative increase mean associated with these research fields. Figure 2.4 shows a comparison of these relative increases with that obtained from our systematic mapping study. Since the Web usability evaluation method topic can be considered as a sub-topic of Usability evaluation and Web engineering, these results confirm the interest in the topic.
49
Literature review on Usability Evaluation Methods for the Web
Figure 2.4. Relative increase means associated to related research fields
There are no conclusions with regard to which the best bibliographic sources are since those papers that appeared in several sources were considered only once. However, most of the relevant studies concerning usability evaluation methods applied to Web domain were found in the IEEExplore and the ACM digital library.
2.4 Discussion This section summarizes the principal findings of this systematic mapping study. It also highlights the limitations that may represent threats to its validity and discusses the implications for research and practice. 2.4.1 Principal findings The goal of this systematic mapping study was to examine the current use of usability evaluation methods in Web development. The principal findings of our study are the following:
50
Usability evaluation methods have been constantly modified to better support the evaluation of Web artifacts. However, the methods evaluate different usability aspects depending on the underlying definition of the usability concept (ISO/IEC 9241-11, ISO/IEC 91261). Therefore, there is no single method that is suitable for all
2.4 Discussion
circumstances and type of Web artifacts. It depends on the purpose of the evaluation and the type of artifact that is evaluated (e.g., abstract user interfaces, log files, final Web user interfaces). Our results suggest that a combination of methods (e.g., inspection and inquiry methods) could provide better results. The majority of the papers reported on evaluations at the implementation phase (e.g., final user interfaces, log analysis). The study also reveals that the evaluations are mainly performed in a single phase of the Web application development. There is a shortage of automated evaluation methods, specifically those that can be applied at early stages (e.g. requirements specifications, navigational models, presentation models). The majority of the papers do not present any kind of validation. Among the papers that present empirical validations, several controlled experiments have been reported. More replications are therefore needed to build up a body of knowledge concerning usability evaluation methods for the Web. The majority of the methods reviewed only reported a list of usability problems; they did not provide explicit feedback or suggestions to help designers improve their artifacts. Web usability evaluation is an important topic and interest in it is growing.
2.4.2 Limitations of the systematic mapping study The principal limitations of this systematic mapping study are related to publication bias, selection bias, inaccuracy in data extraction, and misclassification. Publication bias refers to the problem that positive results are more likely to be published than negative ones since negative results take longer to be published or are cited in other publications to a lesser extent (Kitchenham 2007). In order to alleviate this threat (at least to some extent), we scanned relevant special issues of journals and conference proceedings. However, we did not consider grey literature (i.e., industrial reports or PhD theses), unpublished results, or papers published after 2009 (since this review was conducted at the beginning of this research work). This may have affected the validity of our results to some extent since some studies could have been excluded from the systematic mapping (especially recent works after 2009). Selection bias refers to the distortion of a statistical analysis owing to the criteria used to select publications. We attempted to alleviate this threat (at least to some extent) by defining our inclusion criteria in order to gather the 51
Literature review on Usability Evaluation Methods for the Web largest possible amount of papers that fit into the Web usability evaluation domain. Inaccuracy in data extraction and misclassification refer to the possibility of a study’s information being extracted in different ways by different reviewers. In order to alleviate this threat (at least to some extent), the extraction and classification of the papers was conducted by all three conductors (the author of this thesis and his both supervisors). Each of the 206 studies was classified by each reviewer and the discrepancies that appeared were solved by consensus. We have also detected other limitations related to the systematic mapping procedure itself. Since the goal of systematic mapping studies is more oriented towards categorizing the selected papers and identifying representative studies rather than performing evidence aggregations of empirical results, the results of empirical validations should be analyzed by considering more specific research questions (e.g., how many unique usability evaluation methods have not been validated?, which usability evaluation methods have proven to be the most effective?). This could be done by applying aggregation techniques in order to combine evidence, although these techniques are more commonly applied in systematic reviews. 2.4.3 Implications for research and practice The findings of our systematic mapping study have implications for both researchers who are planning new studies of usability evaluations of Web applications and for practitioners who are working in Web development companies and would like to integrate usability evaluation methods into their Web development process in an effective manner. For researchers, we believe that the usability concept has not been defined consistently in the ISO/IEC standards (as shown in Table 2.4, Figure 2.1(a, b)), which might be a problem since usability as a quality characteristic may not actually cover all the usability aspects even though the UEMs used are effective. We therefore consider that new UEMs should take into account all the usability definitions and specific Web application characteristics in order to provide more complete results. Our findings show that the majority of the papers reported evaluations at the implementation phase or in a single phase of the Web application development (as shown in Table 2.4 and Figure 2.1(a, c)). Usability evaluations at each phase of the Web application development are critical to ensure that the product will actually be usable. We therefore consider that there is an important shortage of evaluation methods with which to address usability in the early stages of Web 52
2.4 Discussion application development, and not only when the application is partially or fully implemented. The main problem seems to be that most Web development processes do not take advantage of the intermediate artifacts that are produced during early stages of the Web development process (i.e., requirements and design stages). These intermediate artifacts (e.g., navigational models, abstract user interface models, dialog models) are mainly used to guide developers and to document the Web application. Since the traceability between these artifacts and the final Web application are not well-defined, performing evaluations using these artifacts can be difficult. New research should be oriented towards integrating usability evaluations into the Web development process whose intermediate artifacts can be effectively evaluated. For instance, this problem does not appear in model-driven Web development processes in which models (intermediate artifacts) that specify an entire Web application are applied in all the steps of the development process, and the final source code is automatically generated from these models (Abrahão et al. 2007). The evaluation of these models can provide early usability evaluation reports in order to suggest changes that can be directly reflected in the source code. Our study confirms the viability of this approach, since some papers applied usability evaluations in model-driven development processes (e.g., Atterer and Schmidt [S11], Molina and Toval [S130]). This is also reflected in most of the automated evaluation methods that were found which also perform evaluations of artifacts obtained during the implementation phase such as HTML source code (as shown in Figure 2.1(c)). Research into automated evaluation methods should go further. It should also be focused on the evaluation of intermediate artifacts applied at early stages (e.g. requirements specifications, navigational models, presentation models). A further finding was that the majority of the reviewed methods only allowed the generation of a list of usability problems (as shown in Table 2.4, Figure 2.1 (b) and Figure 2.2(c)). There is little guidance or suggestions to help designers with the problem of how the usability problems can be corrected. UEMs need to include suggestions about how the identified usability problems can be corrected. Finally, we detected that few validations of UEMs have been published in literature (as shown in Table 2.4 and Figure 2.1(a, c)). When a method is proposed, it is essential to conduct experiments to provide empirical evidence about its usefulness (e.g. ease of use, effectiveness, efficiency, application cost). More controlled experiments are therefore needed to compare the proposed methods. They should use the same measures in order to determine which methods are the most appropriate in different situations. 53
Literature review on Usability Evaluation Methods for the Web We have also learned some lessons that may be useful for practitioners. These lessons are related to which kind of UEM can be applied at different stages of the Web development process and how they can be combined. Owing to the fact that few UEMs are applied at the requirements analysis stage, we could only draw conclusions about the design and implementation stages. The types of methods that were most widely applied at the design stage were Inspection methods (as shown in Figure 2.1(b)). These methods focus mainly on evaluating abstract or partially implemented user interfaces. They are mainly based on heuristic evaluation and guideline reviews that do not require end-user participation. This makes them useful for application by Web developers themselves; however, in most cases these evaluations need to be performed by expert evaluators. The types of methods that were most frequently applied at the implementation stage were User testing, Inspection, and Inquiry methods (as shown in Figure 2.1(b)). These methods mainly focus on evaluating the final Web application or usage data log. Both types require user participation and their planning is often more costly than heuristic evaluations. Table 2.5 suggests several usability evaluation methods by considering the results obtained from the quality assessment, along with the results obtained from the answers to each research sub-question. The rows of the table show each UEM and the columns show the answers for each criterion from the extracted data. Practitioners who are interested in performing usability studies by using these UEMs can refer to the attached references. Practitioners must bear in mind that there is no single UEM that addresses all the existing usability problems. Most of the studies therefore employed more than one UEM in order to take advantage of the evaluation infrastructure. For instance, in most cases in which a user testing method was applied (e.g., ThinkAloud Protocol, Remote Testing), it was often combined with another inquiry method (e.g., Questionnaires, Focus Group, Interviews), thereby taking full advantage of end-user participation in order to gather both objective and subjective data (see Figure 2.2 (a)). An important task for practitioners is not only to compare results from different UEMs, but also to collect data concerning the employment of the UEMs, that can be used to assess the usability of the UEM itself. This data can be very useful in detecting deficiencies and in re-designing evaluation methods in order for them to be more effective and easier to apply.
54
2.4 Discussion Table 2.5. Usability evaluation methods that may be of interest to practitioners Ref.
UEM
Blackmon et al. [S23]
Origin Def.
Cognitive Walkthrough for the Web Chi et al. InfoScent [S46] Simulator Conte et al. Web Design [S53] Perspectives Costabile Systematic and Matera Usability [S57] Evaluation Hornbæk Metaphor of and HumanFrøkjær Thinking [S91] Ivory and WebTANGO Hearst [S98]
New
Nakamichi et al. [S135] Nielsen and Loranger [S136] Triacca et al. [S185]
WebTracer
New New
Type
Au. Stage Feed Emp. validated
Adhoc
Inspec. Yes Design Yes Analytic. Simul. AdTesting Yes Imple. No hoc Simul. Stand. Inspec. No Design No
New
Adhoc
Inspec.
No
Imple.. Yes
Exis.
Adhoc
Inspec
No
Design Yes Imple..
New
Adhoc
Inspec Yes Design No Analytic. Imple..
New
Testing
Yes Imple.. No
Web Heuristic New Evaluation
Adhoc Adhoc
Inspec
No
Design Yes Imple..
MILE+
New
Stand. Inspec
No
Design Yes
Van Waes [S188]
Think-Aloud Protocol
Exis.
Adhoc
Testing
No
Imple.. Yes
Zaharias [202]
Questionnaire Exis.
Adhoc
Inquiry
No
Imple. No
Experiment (Blackmon et al. [S24]) Experiment (itself) Experiment (itself) Experiment (itself) Experiment (Hornbæk & Frøkjær [S91][S92]) Survey (Ivory and Megraw [S99]) Case study (itself) Survey (itself) Experiment (Bolchini & Garzotto [S30]) Experiment (Krahmer & Ummelen [S118], Van Velsen et al. [S187]) Survey (itself & Cao et al. [S37]) Experiment (Van Velsen et al. [186])
55
Literature review on Usability Evaluation Methods for the Web
2.5 Conclusions In recent years, a great number of methods have been employed to evaluate the usability of Web applications. However, no mapping studies exist that summarize the benefits and drawbacks of UEMs for the Web domain since the majority of studies are informal literature surveys driven by the researcher’s expectations. This chapter has presented a systematic mapping study that summarizes the existing information regarding usability evaluation methods that have been employed by researchers to evaluate Web artifacts. From an initial set of 2703 papers, a total of 206 research papers were selected for the mapping study, and the results obtained have allowed us to extract conclusions regarding the stateof-the-art in the field, to identify several research gaps, and to extract some guidelines for novice usability practitioners. Moreover, the application of a well-defined review protocol will also allow us to efficiently update and extend the systematic mapping study in future years. The results obtained show the need for usability evaluation methods that are specifically crafted for the Web domain, which can be better integrated into the Web application lifecycle, particularly during the early stages of the Web development process. We hope that our findings will be useful in the promotion and improvement of the current practice of Web usability research, and will provide an outline to which usability evaluation methods can be applied in order to evaluate Web artifacts and how they are employed.
2.6 Extension: a systematic review on the effectiveness of Web usability evaluation methods In previous sections, we conducted a systematic mapping study in order to investigate what usability evaluation methods have been employed to evaluate Web artifacts, and how have these methods been used. This research question was used to construct a search string by including synonyms and variations of the terms: Web, usability, and evaluation in order to retrieve potential papers. After applying inclusion and exclusion criteria, a total number of 206 selected papers were classified by considering several data extraction criteria: origin of the UEM, underlying usability definition; type of UEM; type of evaluation performed by the UEM; phase(s) and Web artifacts in which it is applied; feedback provided by the UEMs; and type of empirical study used to validate the UEM. 56
2.6 Extension: a systematic review on the effectiveness of Web usability evaluation methods Upon considering the knowledge obtained from our systematic mapping study, more concrete research questions related to the empirical validations of UEMs arose, such as how many individual Web usability evaluation methods have been validated and which usability evaluation methods have proven to be the most effective in the Web domain. Since the goal of systematic mapping studies is more oriented towards categorizing the selected papers at a high level of granularity and identifying representative studies than performing evidence aggregations of empirical results, the results of papers presenting empirical validations should be analyzed by considering a systematic review protocol (Kitchenham 2007, Budgen et al. 2008). This section presents a systematic review whose aim is to analyze which usability evaluation methods have proven to be the most effective in the Web domain. The papers selected from our previous systematic mapping study were used as potential papers to be included in the review. 2.6.1 Research method We performed a systematic review by considering the guidelines that are provided in Kitchenham (2007). The following subsections describe its stages: establishment of the research question, search strategy, selection of primary studies, quality assessment, data extraction, and synthesis strategy. 2.6.1.1 Establishment of the Research Question The goal of our study is to examine the effectiveness of usability evaluation methods in Web development from the point of view of the following research question: “Which usability evaluation methods have proven to be the most effective in the Web domain?”. This will allow us to aggregate the current empirical knowledge to provide useful information for researchers and practitioners in the selection of UEMs in Web development projects. As suggested by guidelines for performing systematic reviews (Kitchenham 2007, Petticrew and Roberts 2005), the research question has been structured by following the PICOC criteria:
Population: Web applications. Intervention: Usability evaluation methods (UEM). Comparison: Different usability evaluation methods. Outcome: Effectiveness of the UEM. Context: Research papers.
57
Literature review on Usability Evaluation Methods for the Web 2.6.1.2 Search Strategy and Selection of Primary Studies In these stages, we reused the set of 206 papers included in our previous systematic mapping study as the potential set of papers to be included in the review. This rationale was based on the fact that reutilization is possible since our research question is a specialization of our previous systematic map’s research question. In fact, composing a new search string including terms such as effectiveness and comparison may considerably restrict the set of relevant papers. These 206 papers were obtained after applying a validated search strategy in relevant bibliographic sources from the years 1996 to 2009, along with several inclusion and exclusion criteria in order to obtain a relevant set of papers concerning the use of UEMs in the Web domain. Further details of this review protocol can be found in previous sections. The initial set of 206 papers was evaluated by the three conductors of the previous systematic mapping (the author of this thesis and his both supervisors) in order to decide whether or not each paper should be included as a primary study. The discrepancies were solved by consensus. The studies that met both of the following inclusion criteria were included:
Papers presenting surveys, case studies, or experiments concerning the empirical validation of usability evaluation methods. These kinds of studies are the most representative ones to gather empirical data (Fenton and Pfleeger 1996). Papers comparing the effectiveness of two or more usability evaluation methods. We selected this kind of studies since comparisons among UEMs allow empirical data aggregation from different sources.
After applying these inclusion criteria, a total of 28 studies were selected. The reliability of inclusion of a candidate study in the systematic review was assessed by applying Fleiss’ Kappa as an agreement measure (Fleiss 1981). We asked three independent raters to classify a random sample of 20 studies, 10 of which had previously been included in the systematic review and 10 of which had not. The Fleiss’ kappa obtained was 0.96, which indicates an acceptable level of agreement among raters. 2.6.1.3 Quality Assessment A three-point Likert-scale questionnaire was designed to provide a quality assessment of the selected empirical studies as suggested by Kitchenham (2007). This quality assessment was performed independently by the three review conductors and its objective was to ensure, at least to some extent, that our results would be based on good quality empirical studies. The questionnaire contained five subjective closed-questions: 58
2.6 Extension: a systematic review on the effectiveness of Web usability evaluation methods 1. Is the paper based on research and is not merely a “lessons learned” report based on expert opinion? 2. Is there a clear statement of the aims of the research? 3. Is there an adequate description of the context in which the research was carried out? 4. Is there an adequate description of the usability evaluation methods to be compared? 5. Is there an adequate description of the measures intended to assess the UEM effectiveness? The first three questions, which were extracted from the questionnaire proposed in Dybå and Dingsøyr (2008), are based on principles of good practice for conducting empirical research in Software Engineering (Kitchenham et al. 2002). The others were specifically crafted for our review with the aim to assess the quality of the data provided to researchers and practitioners. The possible answers to these questions were: “Yes (+1)”, “Borderline (0)”, and “No (-1)”. Each of the studies selected had a score for each closed-question which was calculated as the arithmetic mean of all the individual scores from each reviewer. The sum of the five closed-question scores of each study provided a final score (an integer between -5 and 5). Papers with a total score of less than or equal to 3 were excluded from the review. This threshold was arbitrarily established with the aim to select highquality papers which have obtained; at least, three closed-questions with the maximum score and the other two with borderline score. After applying the quality assessment, a total of 18 studies were finally selected to be included in the review. The complete list of selected studies is shown in Appendix A.1, whereas the intermediate results are available for perusal at Appendix A.3. 2.6.1.4 Data Extraction and Synthesis Strategy We extracted the following information for each of the studies selected: a) The aim and type of the empirical study. b) The usability evaluation methods that were evaluated and their type of method based in the taxonomy proposed in Ivory and Hearst (2001): Testing, Inspection, Inquiry, Analytical modeling, and Simulation. c) The measures that were employed to assess the effectiveness of the usability evaluation methods. d) The Web artifacts that were evaluated (e.g., conceptual models, mockups, prototypes, final application). 59
Literature review on Usability Evaluation Methods for the Web e) The context of the empirical study (e.g., participant or evaluators profile, number of participants or evaluators). The data extracted was coded to facilitate the interpretation of empirical evidence from different empirical studies. We followed an aggregation strategy similar to that presented in Dieste et al. (2008). The papers selected were coded as Px, effectiveness measures were coded as Mi (where ‘x’ and ‘i’ signify sequential numbers), and the UEMs used in the experiments were coded with acronyms. Once all the data had been identified and coded, we built expressions as follows: [Evidence Id |[Paper involved]| Effectiveness measure] Result effect among UEMs For instance, if paper P01 shows that both usability evaluation methods “UEM1” and “UEM2” detected more usability problems (M1) than another usability evaluation method “UEM3”, the expression built was: [01 |[P01]| M1] (UEM1, UEM2) > UEM3 (1) Expression (1) is worded as “The evidence 01, which is supported by the study P01, shows that UEM1and UEM2 are more effective than UEM3 according to the number of usability problems detected”. It should be noted that ‘≈’ could be used instead of ‘>’ if the effect to be expressed is equally effective (no significant differences). In addition, the expressions obtained can be aggregated to summarize the results. The merging process can only take place if the effectiveness measures are the same. For instance, expression (1) can be merged with expressions (2) and (3): [02 |[P02]| M1] UEM3 > UEM4
(2)
[03 |[P03]| M1] UEM3 ≈ UEM5
(3)
Finally, the result of the merging process is expression (4). These expressions are useful in order to rank UEMs in different levels based on their effectiveness (e.g., UEM1 and UEM2 are the most effective methods at the first level). Note that in (4), the evidence IDs involved are provided instead of ID studies in order to maintain the traceability among previous evidences: [04 |(01, 02, 03)| M1] (UEM1, UEM2) > (UEM3 ≈ UEM5) > UEM4
(4)
2.6.2 Results The analysis of the extracted data provided us with the following results for each criterion listed in the “Data Extraction and Synthesis Strategy” Section. 60
2.6 Extension: a systematic review on the effectiveness of Web usability evaluation methods With regard to the aim and type of empirical studies (criterion (a)), the results shows that 50% of the selected studies were intended to empirically validate a usability evaluation method which had been specifically proposed for the Web domain. On the other hand, the other 50% were intended to perform comparative studies among well-known UEMs in order to provide guidance to researchers and practitioners. In addition, experiments were the most common type of empirical study found (around 83%). This is owing to the fact that experiments provides a high level of control and are useful for comparing usability evaluation methods in a more rigorous manner. Case studies and surveys account for 12% and 6% of the selected studies, respectively. With regard to the usability evaluation methods that were evaluated (criterion (b)), the UEMs most frequently used in the comparisons were Heuristic Evaluation (HE), Think-Aloud Protocol (TAP), Cognitive Walkthrough (CW), and the Metaphor of Human-Thinking (MOT). Table 2.6 shows the complete list of the UEMs that were found in the systematic review by including also their type of method and their attached empirical studies. Any UEM defined as a new modified version of other one has been considered as a separated UEM when these modifications pursued the improvement of the UEM (e.g., Heuristic Evaluation vs. Heuristic Evaluation Plus). Table 2.6. UEMs evaluated in the empirical studies Acro. ASE CDL CTP CW CWW EE ESE EYE GPP
Usability Evaluation Method Automated Summative Evaluation Co-discovery Learning Conceptual Tool for Predicting Cognitive Walkthrough Cognitive Walkthrough for the Web Expert Evaluation End-Survey Evaluation Eye-tracking Gerhardt-Powals Principles
Type Testing Testing Inspection Inspection Inspection Inspection Inquiry Testing Inspection
HE
Heuristic Evaluation
Inspection
HEP INT LBT LSP MOT
Heuristic Evaluation Plus Interviews Lab-Based Testing Logic Scoring Preference Methaphor of Human-Thinking
Inspection Inquiry Testing Inquiry Inspection
Empirical Studies [P18] [P11] [P13] [P01][P07][P11] [P01] [P13] [P14] [P06] [P10] [P02][P04][P05] [P06][P08][P10] [P11][P14][P15] [P02] [P17] [P18] [P03] [P07][P08][P09]
61
Literature review on Usability Evaluation Methods for the Web QUE RUT SUE
Questionnaire Remote Usability Testing Systematic Usability Evaluation
Inquiry Testing Inspection
TAP
Think-Aloud Protocol
Testing
TUT Traditional Usability Testing WDP Web Design Perspectives
Testing Inspection
[P03][P17] [P16] [P05] [P09][P11][P12] [P17] [P15][P16] [P04]
With regard to the measures that were employed to assess the effectiveness of UEMs (criterion (c)), the most common measure employed was the ratio of usability problems detected (M1). This measure is also known as thoroughness and is defined as the ratio between the number of problems identified and the total number of existing problems. In some studies, such as Chattratichart and Brodie [P02], Hvannberg et al. [P10], and Koutsabasis et al. [P11], this measure is weighted by the validity measure in order to provide a more rigorous effectiveness measure. Validity is defined as the ratio between the real problems identified (i.e., problems which are not false positives) and the total number of problems identified. Table 2.7 shows the complete list of the measures that are involved in the studies. The variety of measures employed to assess the effectiveness of UEM makes it difficult to summarize empirical data from different studies. Table 2.7. Effectiveness measures employed Code
Measure Name
Empirical Studies [P01][P02][P04][P05][P06][P07] [P08][P09][P10][P11][P13][P14] [P15][P16]
M1
Ratio of usability problems detected
M2
Severity and quality of problems
[P07][P08][P09][P12][P17]
M3
Ratio of task success
[P12][P18]
M4
Usability scores
[P03]
M5
Number evaluators
[P05]
M6
Number of evaluator utterances
[P12]
M7
Number of comments elicited
[P17]
With regard to the Web artifacts that were evaluated (criterion (d)), all the selected studies used a final Web application as the evaluation object. However, a few studies also used other Web artifacts to support the usability 62
2.6 Extension: a systematic review on the effectiveness of Web usability evaluation methods evaluations. For instance, in [S05] Hypermedia Design Models are also used, and [S09] also uses prototypes for evaluating and redesigning user interfaces. With regard to the context of the empirical studies (criterion (e)), we observed that the majority of studies used graduate students as both evaluators to perform usability inspections (e.g., heuristic evaluations, cognitive walkthroughs) and participants in experimental sessions (e.g., think-aloud protocol, remote user testing). However, replications of experiments, which are needed to strengthen the empirical results obtained and to generalize them under certain conditions, are less common than expected. Finally, as a result of the data synthesis, Table 2.8 presents the empirical evidences extracted from the selected studies that were coded according to the representation proposed in the synthesis strategy. Table 2.8. Evidences extracted and aggregated Individual Evidences from Empirical Studies [01 |[P01] | M1] CWW > CW [10 |[P10]| M1] HE ≈ GPP [02 |[P02] | M1] HEP > HE
[11 |[P11]| M1] CDL > (HE ≈ TAP ≈ CW)
[03 |[P03]| M4] LSP > QUE
[12 |[P12]| M3] TAP(E&S) ≈ TAP(B&R)*
[04 |[P04]| M1] WDP > HE
[13 |[P13]| M1] CTP ≈ EE
[05 |[P05]| M1] SUE > HE
[14 |[P14]| M1] HE > ESE
[06 |[P06]| M1] HE > EYE
[15 |[P15]| M1] HE ≈ TUT
[07 |[P07]| M1] MOT > CW
[16 |[P16]| M1] TUT ≈ RUT
[08 |[P08]| M1] MOT > HE
[17 |[P17]| M7] TAP > (INT, QUE)
[09 |[P09][P09]| M1] MOT ≈ TAP
[18 |[P18]| M3] ASE ≈ LBT
*(2 variants of TAP) Aggregated Evidences [19 |(02, 04, 05, 06, 08, 10, 11, 14, 15, 16)| M1] (CDL, HEP, MOT, SUE, WDP) > (GPP≈HE≈TUT≈RUT) > (EYE, ESE) [20 |(01, 07, 11)| M1] (CWW, MOT, CDL) > CW
Our results suggest that the following UEMs can be considered as the most effective methods with which to perform Web usability evaluations: CWW, HEP, MOT, SUE and WDP as inspection methods; and TAP and CDL as 63
Literature review on Usability Evaluation Methods for the Web testing methods. However, it is important to note that more empirical evidences are needed to strengthen these results. 2.6.3 Limitations of the systematic review The main limitations of this systematic review are related to publication bias, selection bias, and inaccuracy in data extraction and synthesis. Since our initial set of candidate papers was provided by our previous systematic mapping, we had already assured to scan relevant special issues of journals and conference proceedings in order to alleviate the publication bias. However, our systematic mapping study neither considered grey literature (i.e., industrial reports or PhD theses), unpublished results, nor papers published after 2009 (i.e., the same limitations from our previous Systematic Mapping Study). This may have affected the validity of our results to some extent since some studies could have been excluded from the systematic mapping (especially recent works after 2009). We attempted to alleviate the selection bias (at least to some extent) by defining our inclusion criteria in order to gather the largest possible amount of studies presenting empirical evidences about UEM effectiveness; and by validating the inclusion strategy through assessing the agreement level among three independent raters. Although the quality assessment is intended to select high-quality empirical studies, this may have also affected the validity of our results regarding the final number of selected papers. In order to alleviate the inaccuracy in data extraction and synthesis (at least to some extent), these stages were performed by three conductors (the author of this thesis and his both supervisors). In addition, all the discrepancies that appeared were solved by consensus. We have also detected other limitation related to the systematic review procedure itself which is intended to be addressed in further work. Since the goal of this study is only based on the effectiveness of UEMs, we have not considered other attributes other performance characteristics which may be interesting for both researchers and practitioners. 2.6.4 Conclusions We have presented a systematic review to analyze which Web usability evaluation methods have proven to be the most effective. A total of 18 out of 206 empirical studies regarding UEM comparisons were selected. Empirical evidences from these studies were extracted, coded and aggregated in order to discover which UEMs have been proven to be more effective than others. 64
2.6 Extension: a systematic review on the effectiveness of Web usability evaluation methods This systematic review has some implications for research and practice. For researchers, the review identifies two issues: 1) low number of empirical studies; and 2) different measures to quantify the effectiveness of a UEM. The first issue shows that there is a clear need for more empirical studies of comparing Web usability evaluation methods, not only in number but also in quality. This limitation is in line with the systematic review performed in Web Engineering field by Mendes (2005), in which it is claimed that the majority of empirical studies cannot be considered to be methodologically rigorous. The second issue shows that there is a need of a standard effectiveness measure for the comparison of Web usability evaluation methods. This is in line with studies performed in the Software Engineering field such as Gray and Salzman (1998) and Hartson et al. (2003); and also in line with studies performed in the Human-Computer Interaction field such as Hornbæk and Law (2007) and Hornbæk (2010). These works claimed that most of the experiments based on comparisons of usability evaluation methods do not clearly identify which aspects of these methods are being compared. For practitioners, this review shows empirical evidences of UEMs which can be proven to be effective for evaluating the usability of Web applications. However, an important task for practitioners is not only to compare results from different UEMs, but also to collect data concerning the employment of the UEMs, that can be used to assess the usability of the UEM itself. This data can be very useful in detecting deficiencies and in re-designing evaluation methods in order for them to be more effective. Although our results suggest that several UEMs are effective methods with which to perform Web usability evaluations, these results need to be interpreted with caution since they aim to guide researchers and practitioners, and are not intended to show which method is better than another since other factors such as the context of the empirical studies may affect these results.
65
Chapter 3 3 Standards for Usability Evaluation The International Organization for Standardization (ISO) has developed a variety of models with which to specify and measure software usability, among many others, those for quality characteristics. The employment of standards has certain advantages, such as the fact that usability evaluation methods based on standards are uniform in their definitions of concepts since these concepts have been agreed between the different groups involved in developing the standard. They also provide a useful basis for conducting usability inspections. In this chapter we therefore present and discuss the existing standards which are related to usability evaluation and the approaches for usability evaluation based on these standards.
3.1 Existing standards for usability evaluation The existing standards related to usability evaluation have been categorized into two groups: process-oriented standards (ISO/IEC 9241 and ISO/IEC 13407) and product-oriented standards (ISO/IEC 9126 and ISO/IEC 14598). We also present the new series of standards (ISO/IEC 25000, also called SQuaRE) whose aim is to improve and unify those which already exist.
67
Standards for Usability Evaluation 3.1.1 Process-oriented standards: ISO/IEC 9241 and 13407 ISO/IEC 9241 is a suite of international standards related to ergonomic requirements for office work carried out using visual display terminals. It provides requirements and recommendations concerning hardware, software and environmental attributes (which contribute to usability), and subjacent ergonomic principles. The standard is divided into 17 parts. Parts 1 to 2 show the overview of the standard series and offer guidelines for its employment. Parts 3 to 9 deal with hardware design requirements and guidelines, which may have implications for software. Finally, parts 10 to 17 deal with software attributes. With regard to the usability concept, part 11 of this standard explains how to identify the information that has to be considered when specifying or evaluating usability in terms of measures of user performance and satisfaction. Explicit guidance is given on how to describe the context of use of the product and the usability measures (Bevan and Schoeffel 2001). In spite of its name, the definitions in part 11 are also known to be applicable to other situations in which a user interacts with a product to achieve certain objectives. This extension makes usability a generic usability concept, which can probably be applied outside its conventional applications in information technology. ISO/IEC 9241 (1998) therefore defines usability in the following manner: “software is usable when it allows the user to execute his task effectively, efficiently and with satisfaction in the specified context of use”. According to this standard, the measurement of the usability of Web applications would thus consist of three usability attributes: a) Effectiveness: How well do the users achieve their goals when using the web application? b) Efficiency: What resources are consumed in order to achieve these goals? c) Satisfaction: How do the users feel about their use of the Web application? This standard presents usability guidelines and is used to evaluate usability according to the context of use of the software. ISO/IEC 9241-11 additionally recommends a process-oriented approach for usability, which allows the usable interactive system to be attained through a human-centered design process. This standard is therefore applied in conjunction with the ISO/IEC 13407standard. The ISO/IEC 13407 standard (1999) provides guidance on the activities involved in the life cycle pertaining to User Centered Design. It describes User68
3.1 Existing standards for usability evaluation Centered Design as a multidisciplinary activity, which incorporates human factors and ergonomic knowledge in order to improve effectiveness and efficiency, working conditions, and counteracting possible adverse effects of use related to health, safety and performance. Figure 3.1 shows the activities carried out in a User-Centered Design.
Figure 3.1. User-Centered Design process
As is mentioned in Abran et al. (2003), adopting the usability definition of the ISO/IEC 9241 standard has the following advantages: a) The ISO/IEC 9241-11 model identifies the usability aspects and context-of-use components to be taken into consideration during specification, design and usability evaluation. b) User performance and satisfaction provide direct measurements of usability in a particular context. c) User performance and satisfaction measurements provide a basis for comparing usability with other design features in the same context. d) Usability can be defined and verified within quality systems conforming to ISO/IEC 9001. However, this standard also has some weaknesses: a) It addresses usability strictly from a process perspective, hence tackling only a single viewpoint. b) ISO/IEC 9241-11 does not tackle the learnability characteristic as is recommended by the majority of standards on and experts in usability. 69
Standards for Usability Evaluation c) It does not tackle the security aspects, which are considered to be very significant by domain experts. 3.1.2 Product-oriented standards: ISO/IEC 9126 and 14598 The ISO/IEC 9126 standard is a set of international standards on software quality from the product perspective. This set has one of the most extensive quality models developed, based principally on the McCall model, one of the first existing quality models (McCall 1977). An early version of the quality model was first published in 1991 (ISO/IEC 9126 1991), and was subsequently improved over the next ten years (ISO/IEC 9126 2001). This international standard divides software quality into six general categories of characteristics: functionalities, reliability, usability, effectiveness, maintainability and portability. The objective of the ISO/IEC 9126 is to provide a framework for the evaluation of software quality. ISO/IEC 9126 does not prescribe specific quality requirements for software, but rather defines a quality model which can be applied to every kind of software. The latest version (ISO/IEC 9126 2001) includes the user's perspective and introduces the concept of quality in use as the ability of the software product to enable users to achieve their specific goals with effectiveness, productivity, satisfaction and safety. These characteristics provide a closer definition of the term ‘usability’ which appears in ISO/IEC 9241-11. The ISO/IEC 9126 (2001) is divided into four parts: 1. ISO/IEC 9126-1: This standard specifies two distinct perspectives of models for the software quality lifecycle (see Figure 3.2): a. Internal and external quality is modeled with the same set of six characteristics: functionality, reliability, effectiveness, usability, maintainability and portability. b. Quality in use characteristics are modeled with four other characteristics: effectiveness, productivity, security and satisfaction. 2. ISO/IEC 9126-2: This part describes the measures that can be used to specify or evaluate the behavior of the software when operated by the user. 3. ISO/IEC 9126-3: This part describes the measures that can be used to create the requirements that describe the static properties of the interface, which can be evaluated by inspection without operating the software.
70
3.1 Existing standards for usability evaluation 4. ISO/IEC 9126-4: This part describes the measures that can be used to specify or evaluate the impact of the use of the software when operated by the user.
Figure 3.2. Quality in the life cycle from ISO/IEC 9126
In the 1991 version of ISO/IEC 9126, usability was defined as “a set of attributes that bear on the effort needed for use and on the individual assessment of such use, by a stated or implied set of users”. The concept of usability was therefore more productoriented. Usability was seen as an independent factor of software quality and it focused on software attributes, such as its interface, which make it easy to use. However, the attributes that a product requires for usability depend on the nature of the user, the task and the environment. In a product-oriented approach, usability is seen as a relatively independent contribution to software quality, as now defined in the 2000 edition of ISO/IEC 9126-1: “The capability of the software product to be understood, learned, used and attractive to the user, when used under specified conditions”. By following this definition, usability was broken down into the following sub-features:
Understandability: The capability of the software product to enable the user to understand whether the software is suitable, and how it can be used for particular tasks and conditions of use. Learnability: The capability of the software product to enable the user to learn its application. Operability: The capability of the software product to enable the user to operate and control it. Attractiveness: The capability of the software product to be attractive to the user. Compliance: The capability of the software product to adhere to standards, conventions, style guides or regulations relating to usability. 71
Standards for Usability Evaluation Usable products can thus be designed by incorporating product characteristics and attributes, which are beneficial to users in particular contexts of use. Users are directly interpreted as interactive system users. They can include operators and direct or indirect users who are influenced by or depend on using the software. Since ISO/IEC 9126 is limited to specifying an overall quality model, it should be applied in conjunction with ISO/IEC 14598. This standard provides a framework with which to assess the quality of any software product and indicates the requirements to be met in measurement methods and evaluation processes. The ISO/IEC 14598 thus consists of six parts:
ISO/IEC 14598-1: This part provides an overview of the other five parts and explains the relationship between software product evaluation and the quality model defined in the ISO/IEC 9126 (see Figure 3.3). ISO/IEC 14598-2: This part contains requirements and guidelines for support functions such as the planning and management of software product evaluation. ISO/IEC 14598-3: This part provides requirements and guidelines for software product evaluation when the evaluation is carried out in parallel with the development by the same developers. ISO/IEC 14598-4: This part provides requirements and guidelines for software product evaluation and is carried out according to acquirers who plan to purchase a product or reuse existing or pre-developed software. ISO/IEC 14598-5: This part provides the requirements and guidelines for software product evaluation when the evaluation is carried out by independent evaluators. ISO/IEC 14598-6: This part provides guidelines for the documentation of the evaluation module.
The advantages of using the definition of usability shown in this set of standards are:
72
There is a clearly defined and agreed upon model, supported with appropriate measures, that clarifies the definition of usability, and proposes measures to provide objective evidence of achievement It can be used as a reference for contractual agreements between an acquirer and a software supplier and can also be used to avoid certain misunderstandings between them.
3.1 Existing standards for usability evaluation
It proposes an evaluation process that can be tailored to acquirers, developers and external evaluators.
However, there are also some shortcomings which have not yet been fully addressed, such as:
The set of metrics is provided for measuring sub-characteristics which in turn encompass concepts that are extremely difficult to measure if they are not broken down into attributes. There is concept overlapping between usability defined as an internalexternal quality characteristic and other related characteristics that are mentioned in the quality in use. Having two separate standards that are employed in conjunction may lead to inconsistencies in both their lifecycles and may make them difficult to use.
Figure 3.3. Evaluation process view according to ISO/IEC 14598-1
3.1.3 ISO/IEC 25000 SQuaRE standard series Issues such as having two complementary standards: ISO/IEC 9126 (Software Product Quality) and ISO/IEC 14598 (Software Product Evaluation), have motivated the development of the ISO/IEC 25000 standard (2005) known as 73
Standards for Usability Evaluation SQuaRE (Software Quality Requirement Evaluation). The goal pursued with the creation of this standard is to provide a set of standards that are more logically organized, enriched with new contributions, and unified in accordance with the previous standards in order to be able to cover the two main processes: the specification of software quality requirements, and software quality evaluation supported by a measuring process. SQuaRE focuses exclusively on establishing criteria for software product specification, measurement and evaluation. SQuaRE is therefore a consolidation and review of the previous ISO/IEC 9126 and ISO/IEC 14598 standards which it has replaced. The divisions within the SQuaRE series are:
74
ISO/IEC 2500n - Quality Management Division: This division defines all common models, terms and definitions further referred to by all other International Standards from the SQuaRE series. It also provides requirements and guidance for a supporting function that is responsible for the management of the requirements, and the specification and evaluation of software product quality. ISO/IEC 2501n - Quality Model Division. This division contains detailed quality models for computer systems and software products, quality in use, and data. Practical guidance on the use of the quality models is also provided. ISO/IEC 2502n - Quality Measurement Division. This division includes a software product quality measurement reference model (see Figure 3.4), mathematical definitions of quality measures, and practical guidance for their application. ISO/IEC 2503n - Quality Requirements Division. This division helps specify quality requirements, based on quality models and quality measures. These quality requirements can be used in the process of quality requirements elicitation for a software product to be developed or as input for an evaluation process. ISO/IEC 2504n - Quality Evaluation Division. This division provides requirements, recommendations and guidelines for software product evaluation, whether performed by evaluators, acquirers or developers.
3.1 Existing standards for usability evaluation
Figure 3.4. Software product quality reference model according to SQuaRE
The main advantages with regard to its predecessors, ISO/IEC 9126 and ISO/IEC 14598 are:
Improved coordination of the guidance used to measure and evaluate the quality of software products. Improved guidance for specifying quality requirements for software products. Better differentiation between the stakeholders who benefit from the software product and its needs (end-user, organization and technical support team). Better integration among the existing definitions of usability thanks to the quality model perspectives.
The main differences between them are:
The former term “metric” has been replaced with the term “measure”. The introduction of a general reference. The introduction of detailed guidelines devoted to each division. The introduction of quality measure elements within the division of quality measurement. The addition and review of a data quality model. The addition and review of the evaluation process. The coordination and harmonization of the content of ISO/IEC15939 (2000). 75
Standards for Usability Evaluation
The introduction of guidelines for practical use as examples. The renaming of some sub-characteristics in order to avoid ambiguity. The addition of new sub-characteristics.
With regard to the quality model proposed, there are three perspectives according to the context in which it is applied (see Figure 3.5): Product Quality Model, which is employed to evaluate a particular software product, Data Quality Model, which is employed to evaluate the quality of the information managed by the software; and Quality in Use Model, which is employed to assess how the stakeholders benefit from the software product to achieve their objectives in a specific context of use.
Figure 3.5. Quality models perspectives according to SQuaRE
With regard to the concept of usability, a better harmonization among the different definitions of usability which were proposed by the previous standards (ISO/IEC 9241 and ISO/IEC 9126) is evident in the SQuaRE standard. This results from a better differentiation between the stakeholders who benefit from the software product: end-user, organization and technical support. Thus, as is presented in Table 3.1, Quality in use may have different perspectives depending on the stakeholder to be considered (Bevan 2007), since if only the perspective of the end-user were considered we would obtain 76
3.1 Existing standards for usability evaluation a definition of usability closer to that proposed in the ISO/IEC 9241-11 standard. Table 3.1. Stakeholder views of quality in use Stakeholder: Characteristics
End-User Usability
Usage Organization
Technical support
Cost-effectiveness
Maintenance
System effectiveness
User effectiveness
Task effectiveness
Support effectiveness
System resources
Productivity (time)
Cost efficiency (money)
Support cost
Adverse consequences Stakeholder satisfaction
Risk to operator (health and safety)
Commercial risk
User satisfaction
Management satisfaction
Software failure or corruption Support satisfaction
What is more, usability is still included as a quality sub-characteristic in the Product Quality Model which has been defined very similarly to the definition proposed in the ISO/IEC 9126 standard. The main modifications of this redefinition with regard to the definition from ISO/IEC 9126 are:
The characteristics of Understandability and Attractiveness have been renamed as Appropriateness Recognizability and User Interface Aesthetics, respectively, in order to provide a more concise meaning. The characteristics of User Error Protection and Accessibility have been added.
However, it is important to note that SQuaRE states that “Usability can either be specified or measured as a product quality characteristic in terms of its sub-characteristics, or specified or measured directly by measures that are a subset of quality in use”. This is a positive aspect since it can be interpreted as a first step towards the harmony between the different definitions of the term usability. Thanks to this statement, usability can be considered both in the early stages of development and in specific end-user contexts.
77
Standards for Usability Evaluation
3.2 Web usability evaluation approaches based on standards There is a wide variety of proposed usability evaluation methods based on usability models (or quality models if usability is included in addition to other quality characteristics) according to the guidelines presented in the aforementioned quality evaluation standards or according to compilations of usability definitions proposed by other authors. Although the objective of this section is to analyze those usability evaluation approaches that have been specifically crafted for Web applications, it is worth briefly mentioning former contributions made to the Software Engineering field by authors such as McCall (1977), Nielsen (1993) and Dromey (1998). These contributions, which were mainly based on quality/usability models, were useful to consolidate the current usability definitions and have been the basis for the quality evaluation standards. McCall (1977) presents one of the former quality models in which key attributes of a final software product are called quality factors from the user viewpoint. These factors were classified into three main groups: product review (e.g., maintainability, flexibility), product transition (e.g., portability, interoperability) and operation of the product (e.g., usability, efficiency). The concept of usability begins to be related to how users can operate the product as successfully as possible. Nielsen (1993) is one of the most referenced authors in the Usability Engineering field. His work provides a fairly detailed model focused on the concepts of social acceptability and practical acceptability. It defines usability as a sub- characteristic of usefulness, which is, in turn, a sub-characteristic of practical acceptability. The usability dimension of the model incorporates the following attributes: easy to learn, efficient to use, easy to remember, fewer errors, and subjectively pleasing. The first four attributes represent the quality characteristics of a software product, whereas the last attribute represents endusers’ subjective evaluations of a software system. Dromey (1998) uses a constructive strategy to characterize behaviors and uses. Behavior is something that the software exhibits itself when it is executed under the influence of a set of inputs (e.g., usability). Use is something that different users do with or to software. Dromey’s model enumerates specific properties and classifies them as pertaining to certain software characteristics, and further enumerates software characteristics that characterize each behavior and use. The aforementioned approaches provided the foundation of usability evaluation for generic software products in the existing standards. Although 78
3.2 Web usability evaluation approaches based on standards Web applications are a particular type of software product, these products have specific characteristics that impact on how Web usability evaluation is addressed. Web usability can be evaluated using the standards described in the previous section. Although these standards are very useful in providing guidance as to which usability aspects can be evaluated (usability model) and how they can be evaluated (evaluation process), the standards’ recommendations are too generic. They propose usability sub-characteristics which are too abstract to be directly measurable and there are no guidelines concerning the integration of the evaluation process into different development processes. There was therefore a need to extend and/or adapt the usability/quality models and evaluation processes proposed in these standards in order to take into account the specific characteristics of Web applications. This has motivated the emergence of several proposals with which to address Web usability evaluation (and also Web quality in general). Some of these examples can be found in works such as those of Ivory (2001), Olsina and Rossi (2002), Granollers (2004), Calero et al. (2005), Seffah et al. (2006), Moraga et al. (2007), and Oztekin et al. (2009). Ivory (2001) presented a methodology with which to evaluate informationcentric Web sites. The methodology proposed five stages: 1) Identifying an exhaustive set of quantitative user interface measures, such as the amount of text on a page, (e.g., color usage, consistency); 2) Computing measures for a large sample of rated interfaces; 3) Deriving statistical models from the measures and ratings; 4) using the models to predict ratings for new interfaces; and 5) Validating model prediction. One of the strengths of this approach is the automation of the process performed by the WebTango tool, whereas one of the weaknesses is that it only considers aspects of the final user interface (i.e., source code). However, the degree of usability is quantified by comparing similarities between a baseline of known quantitative results for other previously evaluated Web applications. Despite being very useful for establishing rankings of user interfaces, the qualitative analysis is neglected (i.e., descriptions of usability problems detected and recommendations made to solve them). Olsina and Rossi (2002) presented the methodology denominated as Web Quality Evaluation Model (WebQEM) which aims to defining a quantitative evaluation of process quality for Web applications. WebQEM consists of four main phases: 1) Definition and specification of quality requirements, which specify sub-characteristics and attributes based on the ISO/IEC 9126-1 standard (e.g., usability, functionality) and also by considering the explicit needs of Web users; 2) Basic evaluation by applying metrics in order to quantify the attributes; 3) Overall assessment by selecting the aggregation criteria and the 79
Standards for Usability Evaluation scoring model; and 4) Conclusion, which offers recommendations to improve the quality of the Web application. Despite the fact that one of the strengths of this work is that the evaluation process is clearly defined, most of the evaluations proposed were carried out with operative Web applications rather than during the earlier stages of the Web development process. Granollers (2004) proposed the MPIu+a methodology, which allows effective multidisciplinary work to be carried out in the development of usable and accessible interactive systems by permitting the convergence of people belonging to different knowledge areas. The model provides a mapping between basic principles from usability engineering, accessibility and Software Engineering. It also considers both the ISO/IEC 9126 and the ISO/IEC 9241 standards, in addition to the accessibility guidelines proposed by the World Wide Web Consortium (W3C). One of the strengths of MPIu+a is that it is considered to be the prototyping stage as part of the usability and accessibility evaluation lifecycle. However, these evaluations are performed when the prototypes have only just sufficiently evolved. Calero et al. (2005) presented a quality model specifically for Web applications called Web Quality Model (WQM). This model is defined by considering three dimensions: Web features (content, presentation and navigation), quality characteristics based on ISO/IEC 9126-1 (functionality, reliability, usability, efficiency, portability and maintainability), and lifecycle processes based on the ISO/IEC 12207 (development, operation, maintenance) including organizational processes such as project management and program management reuse. WQM incorporates a total of 326 specific metrics for Web products, which have been classified based on these three dimensions. One of its strengths is the information provided concerning which Web metrics have been theoretically and/or empirically validated, and which of their calculations are easier to automate. An evaluation process can be defined by selecting asubset of metrics and using the values obtained from them in order to build a weighted expression for the "overall Web quality". This expression could be employed to quantify the quality of a concrete Web application. However, WQM did not propose a definition of this evaluation process in order to guide evaluators in performing quality evaluations. Seffah et al. (2006) presented the Quality in Use Integrated Measurement (QUIM) as a consolidated model for usability measurement in Web applications. QUIM combines existing models from ISO/IEC 9126-1 and ISO/IEC 9241-11. It defines a first level that includes 10 sub-characteristics which define usability (efficiency, effectiveness, productivity, satisfaction, learning, safety, reliability, accessibility, universality and utility). At the second 80
3.2 Web usability evaluation approaches based on standards level, the sub-characteristics are broken down into 26 measurable criteria (e.g., controllability, privacy, familiarity). However, these criteria are not the result of breaking down a single sub-characteristic, but rather a criterion can belong to different factors from the upper level. At the third level, 127 usability metrics are associated with these criteria. One of the strengths is that an editor tool is presented to define measurement plans that collect data from different combinations of metrics proposed in the model and to access the usability model as a repository with all its categorized usability metrics by including guidance on how to apply them. However, the evaluation process is relegated solely to the application of metrics, and no detailed guidance is defined in order to establish the requirements, specification and design of the evaluation. Moraga et al. (2007) presented a usability model oriented towards the evaluation of portlets (i.e., modular user interface software components that are managed and displayed in a Web portal). The model is based on ISO/IEC 9126 (understandability, learnability and compliance), although the operability sub-characteristic was replaced with customizability which is closer to the context of portlets. The usability evaluation process proposed is based on a number of rankings with acceptance thresholds in order to quantify the subcharacteristics from the models. However, the purpose of these measures is more oriented towards establishing a ranking of scores determining acceptance thresholds for each attribute than providing usability reports. Oztekin et al. (2009) proposed the UWIS methodology for usability assessment and the design of Web-based information systems. UWIS is a checklist whose aim is to provide usability indexes. These usability indexes are defined by considering the usability sub-characteristics proposed in the ISO/IEC 9241-11 (i.e., effectiveness, efficiency and satisfaction), the dialogue principles for user interface design according to the ISO/IEC 9241-10 standard, and the usability heuristics proposed by Nielsen. One of the strengths of this approach is that it provides an easy to use inspection method for the evaluation of Web applications. However, the evaluation process is a simple subjective checklist of issues which must be dealt with in the final Web application. Finally, it is worth mentioning other approaches which are not directly based on the quality evaluation standards, but also propose usability/quality models for the Web context that are based on compilations of usability definitions proposed by other authors. Some of these works are those of Becker and Mottay (2001), Sutcliffe (2002), and Signore (2005). Becker and Mottay (2001) present a usability assessment model with which to identify and measure usability factors. The factors defined are page layout, navigation, design consistency, information content, performance, customer 81
Standards for Usability Evaluation service, reliability, and security. However, all these factors were measured in the final user interface of a Web application. Sutcliffe (2002) presents a model based on initial attractiveness, navigation and transaction. This work mainly focuses on how attractiveness can be operationalized in terms of design guidance. The attractiveness characteristic was divided into the generic aspects of a final UI such as aesthetic design, use of media to direct attention, issues related to the linking of visual styles, etc. Signore (2005) presented a quality model with a set of characteristics that relate internal and external quality factors that can be measured with automated tools. The model distinguishes five dimensions related to the correctness of the source code, presentation criteria (e.g., page layout, text presentation), content issues (e.g., readability, information structure), navigation aspects, and ease of interaction (e.g., transparency, recovery, help and hints).
3.3 Conclusions This chapter has investigated various models that may be useful in addressing the evaluation of Web usability, in particular those proposed in processoriented standards (ISO/IEC 9241 and ISO/IEC 13407) and product-oriented standards (ISO/IEC 9126 and ISO/IEC 14598). These ISO/IEC standards were not designed from the same perspective since they proposed different definitions of the concept of usability. For instance, the usability model from ISO/IEC 9241-11 and the evaluation process from ISO/IEC 14000 were developed by experts from the Human-Computer Interaction field, whereas the usability model from ISO/IEC 9126 and the evaluation process from ISO/IEC 14598 were developed by experts from the Software Engineering field. However, these definitions from experts and researchers are now beginning to be harmonized thanks to the creation of the new standard series: ISO/IEC 25000 SQuaRE standard. SQuaRE states that usability can either be specified or measured as a product quality characteristic in terms of its subcharacteristics, or specified or measured directly with measures that are a subset of quality in use. This is a positive aspect since usability can be considered both in the early stages of development and in specific end-user contexts. We realized that the recommendations made in these standards are too generic. They propose usability sub-characteristics which are too abstract to be directly measurable and there are no guidelines concerning the integration of the evaluation process into different development processes. The usability/quality models and evaluation processes proposed in these standards should therefore 82
3.3 Conclusions be extended and/or adapted in order to take into account the specific characteristics of Web applications. After reviewing several Web usability evaluation approaches which employ a usability/quality based on standards, we have identified two issues:
There is a shortage of Web usability evaluation approaches that are able to address Web usability not only when the Web application is implemented but also at earlier stages of development, such as the analysis and design stages. There is a shortage of Web usability evaluation approaches which are based on the new SQuaRE standard series in order to benefit from the definition of usability which brings together definitions from the fields of both Human-Computer Interaction and Software Engineering.
The main problem would appear to be that most Web development processes do not take advantage of the intermediate artifacts that are produced during the early stages of the Web development process (i.e., requirements and design stages). These intermediate artifacts (e.g., navigational models, abstract user interface models, dialog models) are mainly used to guide developers and to document the Web application. Since the traceability between these artifacts and the final Web application are not well-defined, performing evaluations using these artifacts can be difficult. In order to address this issue, usability evaluations should be integrated into the Web development process, whose intermediate artifacts can be effectively evaluated. For instance, a suitable context would be model-driven Web development processes in which models (intermediate artifacts) that specify an entire Web application are applied in all the steps of the development process, and the final source code is automatically generated from these models. The evaluation of these models can provide early usability evaluation reports in order to suggest changes that can be directly reflected in the source code. The following chapter is therefore devoted to covering some core ideas regarding existing model-driven Web development processes and research works that address usability evaluation in this paradigm.
83
Chapter 4 4 Usability Evaluation in Model-Driven Web Development Recent studies indicate that the adoption of Model-Driven Development (MDD) has increased (Mohagheghi et al. 2012). There are currently several Web development methodologies that follow this approach (model-driven Web development methods). These methods support the development of a Web application by defining different views (models), including at least one structural model, a navigational model, and an abstract presentation model. Some methods also provide model transformations and automatic code generation. The evaluation of these models can provide early usability evaluation reports in order to suggest changes that can be directly reflected in the source code. The aim of this chapter is, therefore, to provide a brief background to the commonalities of these methods and to discuss existing approaches that deal with usability evaluation in this paradigm.
4.1 Model-driven Web development methods Web application design relies to a great extent on a clean separation of concerns and the rigid use of appropriate abstractions. Web engineers typically capture the different design concerns in different models specifically designed for their particular purpose: requirement, data, navigation (also including functionality), and presentation models. By allowing the designer to 85
Usability Evaluation in Model-Driven Web Development concentrate on one particular design concern at a time, the complexity of designing a large Web application is effectively reduced. In a more general context, this form of engineering, in which models are specified and gradually refined, is known as model-driven engineering. Advantages of this approach are the rigorous separation of concerns, the fact that the modeling primitives lie closer to domain concepts (as opposed to implementation details) and are thus more intuitive for the designer to specify, and the possibility of (partly) transforming one model into another, be it automatically using model transformations, or manually. Finally and arguably most importantly, modeldriven approaches provide a relative technological independence regarding the actual targeted implementation, since they allow different implementations to be generated from the specified models. The best-known model-driven engineering initiative is the Model-Driven Architecture (MDA) (Miller and Mukerji 2003) initiated by the Object Management Group (OMG). It is based on OMG's standards, and principally those of the Unified Modeling Language (UML) for modeling purposes, the MetaObject Facility (MOF) as a meta-modeling specification and Query/View/Transformation (QVT) for transformation purposes. MDA consists of three types of models, depending on the specific viewpoint as regards the system:
Computational-independent models (CIM), a vocabulary of the problem domain that defines business terms, facts, and rules that are useful to specify the application domain and the system requirements. Platform-independent models (PIM), which are used to specify the system without any bias towards a concrete implementation. Platform-specific models (PSM), which are used to add necessary specific implementation details targeting (different) implementation platforms.
Transformations defined between the different models allow one model to be (partly) converted into another (Model to Model – M2M). In addition, the use of models as an input of a model compiler permits the source code to be generated (Model to Text – M2T). In recent years, the growing interest in the Internet has led to the emergence of several model-driven Web development approaches which provide a frame of reference for the Web Engineering field. Figure 4.1 presents the most representative approaches in chronological order. According to Escalona and Aragón (2008), the lines indicate that the latest methodologies are based on, or receive the ideas from, previous ones. 86
4.1 Model-driven Web development methods
Figure 4.1. Chronological overview of model-driven Web development methods
The overall tendency was initially oriented towards the structured paradigm. Hypermedia Design Model (HDM) and Relation Management Method (RMM) were structured. However, with the introduction of Enhanced Object Relationship Methodology (EORM) and Object-OrientedHypermedia Design Method (OOHDM) (Schwabe and Rossi 1995), this tendency moved towards the object-oriented paradigm. We have selected a subset of model-driven Web development methods depicted in Figure 4.1 in order to provide a brief description of each proposal in the following sub-sections. In particular, we have selected the best-known ones to follow the tendency of the object-oriented paradigm: OOHDM (Schwabe and Rossi 1995), WSDM (De Troyer and Leune 1998), SOHDM (Ogawa et al. 1998), WebML (Ceri et al. 2000), UWE (Hennicker and Koch 2001), W2000 (Baresi et al. 2001), OO-H (Gómez et al. 2001), OOWS (Fons et al. 2003), NDT (Escalona et al. 2004).
87
Usability Evaluation in Model-Driven Web Development 4.1.1 Object-Oriented Hypermedia Design Method (OOHDM) The Object-Oriented Hypermedia Development Hypermedia Design Method (OOHDM) (Schwabe and Rossi 1995) was the first method to introduce the object-oriented modeling paradigm in the development of hypermedia applications. In this method, navigation is modeled through a navigational class diagram and a context diagram. The navigational class diagram is a view of the structural model. Each diagram is associated with a set of particular users, and its modeling primitives are classes and associations. Classes represent the structure of a hypermedia document, and they are defined as a view of the conceptual classes and built from query languages. The associations can represent navigational links (anchor) or access structures that are included as attributes of classes. The context diagram is a collection of navigational objects that satisfy a condition which can be defined as a query. A context allows the set of nodes to be accessed forward and backward like a tour. The contexts are associated with one navigational class, and it is possible to swap the context within the same class. The OOHDM approach is divided into four main stages: 1. Conceptual analysis: This stage allows the creation of a domain model through the application of object-oriented modeling techniques. The classes and their relationships are identified, and may be of association, aggregation, composition, and generalization-specialization types. The result of this stage is a structural model consisting of classes, associations and attributes. It is therefore similar to the class diagram from the Unified Modeling Language (UML). 2. Navigational Design: This stage allows the reorganization of the information provided by the structural model and also determines how it will be displayed to users. The navigational model consists of the navigational class diagram and the diagram of contexts. 3. Abstract interface design: This stage defines the way in which the objects are perceived through the user interface. The separation between navigational design and user interface design makes the division of development tasks easier. It is also possible to have different interfaces for the same navigational model. OOHDM uses the Abstract Data View (ADV) (Cowan et al. 1993). An ADV is represented by a static structure of the interface, the object composition, and the events to which they respond. 88
4.1 Model-driven Web development methods 4. Implementation: This is the last stage, in which the correspondences with the specific objects of the implementation platform should be chosen from the design models. It is therefore an entirely dependent stage deployment of the platform chosen. 4.1.2 Web Site Design Method (WSDM) The main feature of the Web Site Design Method (WSDM) (De Troyer and Leune 1998) is that it is a user-centered approach. WSDM defines a Web application by modeling the different groups of users that will probably interact with it. It was one of the first approaches to consider the problem of the diversity of users in Web applications. The WSDM approach is divided into five main stages: 1. Mission statement specification: In this stage, the purpose of the Web application must be expressed, and the target audience is also declared. 2. Audience Modeling: In this stage, users are classified and grouped in order to study system requirements according to each user group. 3. Conceptual design: In this stage, both the class diagram and navigational model are designed. The class diagram represents the static model of the system whereas the navigational model represents the possibilities of navigation for each group of users. 4. Implementation design: In this stage, the conceptual design models are complemented with the information which is required for a concrete implementation, such as a site structure model, a presentation model and a logical data model. 5. Implementation. In this last stage, the result of the implementation design phase is written in a specific programming language. 4.1.3 Scenario-Based Object-Oriented Hypermedia Design Methodology (SOHDM) The Scenario-Based Object-Oriented Hypermedia Design Methodology (SOHDM) (Ogawa et al. 1998) is a Web development process based on scenarios, and consists of six stages, as detailed below: 1. Domain analysis: This stage provides the initial analysis of the system through a model of scenarios whose notation is based on flow charts and events. These scenarios are considered as a combination of use cases and data flow diagrams. 2. Object-oriented modeling: this stage provides the identification of the classes and their relationships by using an Object-Oriented Modeling Technique (OMT) (Rumbaugh 1991). 89
Usability Evaluation in Model-Driven Web Development 3. View design: This stage expresses how the system will be presented to the user. Views are created in order to bring together information from other classes of the object-oriented model. These are also called navigational units. 4. Navigational Design: In this stage, a navigational class model is developed in order to express the navigational possibilities in the system. 5. Implementation: This stage consists of designing the Web pages and the flow among them, other detailed interface aspects and a relational database. 6. Construction: In this stage, the Web application is eventually built. 4.1.4 Web Modeling Language (WebML) The Web Modeling Language (WebML) (Ceri et al. 2000) is a domain-specific language with which to specify the content structure of Web applications (particularly those which are data-intensive) and the organization and presentation of their contents in one or more hypertexts. The WebML development stages focus on the construction of four models: 1. The structural model (also known as the Data Model), which enables the schema of data resources to be described according to the EntityRelationship Model. Their fundamental modeling primitives are entities that are relevant to the problem domain, defined as containers of data elements, and relationships, defined as semantic connections between entities. 2. The hypertext model (also known as the Site View), whose aim is to express the composition of content and the invocation of operations within pages, in addition to the definition of links between pages. 3. The presentation model, which is created by applying the Extensible Stylesheet Language (XSL) to XML documents representing an instance of the navigational model. 4. The personalization model, which consists of the predefined entities: user and group. The characteristics of these entities are used to display individualized content. Finally, WebML is one of the few approaches that present a tool that supports its development process. This tool is called WebRatio, and is currently being applied in an industrial environment.
90
4.1 Model-driven Web development methods 4.1.5 UML based Web Engineering (UWE) The UML based Web Engineering method (UWE) (Hennicker and Koch 2001) is based on the UML notation and also uses the notation from the Rational Unified Process software development (RUP) (Booch et al. 1999) as a methodology for hypermedia applications. The development process is therefore iterative and incremental. The MagicUWEtool is focused on supporting the modeling activities of the UWE development process. The UWE approach is divided into four main stages: 1. Requirements analysis: This stage is aimed at specifying use cases in order to represent the system requirements. 2. Conceptual design: This stage represents the problem domain through a UML class diagram. Use cases, among other techniques, are used as input to identify the classes, methods and attributes of this class diagram. 3. Navigational design: This stage provides the definition of the navigation space which is a partial view of the class diagram, and it also provides the design of navigation structures, which are structures that provide access to the objects from the navigational space. 4. Presentation design: In this stage, the presentation model is created. It is closely related to the elements of the interfaces defined in HTML. These elements are also defined as UML stereotypes. The presentation model elements are: anchors, text entries, images, audio and buttons. 4.1.6 W2000 The W2000 development method (Baresi et al, 2001) defines a framework with which to design Web applications, and integrates the UML with Web design concepts borrowed from the Hypermedia Design Model (HDM) (Garzotto et al. 1993). The W2000 approach is divided into five main stages: Requirements analysis: This stage provides the analysis of both functional requirements and navigational requirements. The latter consists of identifying both the information and navigational needs for different users. Both activities are specified through the creation of UML use cases. Design of evolution states: This stage represents the evolution associated with the content when navigation occurs. This step is required only in those applications that have a complicated behavior and it is modeled as a UML state diagram. 91
Usability Evaluation in Model-Driven Web Development Hypermedia design: This stage includes both information and navigation design. Information design is aimed at organizing the content whereas navigation design defines how users can access and navigate the system. In both cases, UML class diagrams are used in order to represent this design. Functional design: This stage integrates the hypermedia design with the design of evolution states by specifying the main operations performed by users in the application. This design is represented with UML sequence diagrams. Design of visibility: This stage specifies which information and navigation structures should be visible to each user. 4.1.7 Object-Oriented Hypermedia Method (OO-H) The Object-Oriented Hypermedia method (OO-H) (Gómez et al. 2001) provides designers with the semantics and notation needed to develop Web applications. OO-H can be considered as an extension of OOHDM through the employment of use cases and service links. The OO-H approach is divided into three main stages: 1. System analysis: In this stage, user requirements are captured in use cases, and these are then used to derive a structural model with objectoriented analysis techniques. This structural model is represented as a UML class diagram. 2. Navigational design: In this stage, a navigational model is created by using a set of Navigational Access Diagrams (NADs) that specify the functional requirements in terms of navigational needs and users’ actions.Each NAD is a partial view from the class diagram and its purpose is to structure the navigational view of the Web application for a specific kind of user. 3. Design of the presentation: In this stage, a presentation model is created by using a set of Abstract Presentation Diagrams (APDs), whose initial version is obtained by merging the former models (class diagram and NADs). APDs are then refined in order to represent the visual properties of the final user interface. OO-H is supported by the Visual Wade tool. This tool provides complete graphical support for the performance of the domain and navigational analysis, in addition to providing support for the generation of code through the use of PIM-to-code transformations.
92
4.1 Model-driven Web development methods 4.1.8 Object-Oriented Web Solutions (OOWS) The Object-Oriented Web Solutions (OOWS) (Fons et al. 2003) is an extension of the OO-Method (Pastor 1992), which captures the functional requirements of an object-oriented system in order to generate a formal specification. The OOWS approach is divided into three main stages. 1. Requirements Analysis: In this stage, the requirements of Web applications are specified by means of a model that is based on the concept of task. 2. System Specification: This stage consists of the description of the Web application at the conceptual level. This stage was supported with proposals for different models: an object model with which to describe the static structure of the Web application, both functional and dynamic models to describe the behavior of the Web application, and both navigational and presentation models to describe the Web application user interface. 3. Solution Generation: In this stage, the Web application is automatically generated from the models defined in the previous phase. OOWS is supported by Olivanova tool and the OOWSsuite, which provide full support for the creation of PIM models and the generation of code from them through PIM-PSM-code and PIM-to-code transformations. 4.1.9 Navigational Development Techniques (NDT) The Navigational Development Techniques (NDT) (Escalona et al. 2004) is a methodological process for Web application development that is focused on the requirements and analysis phases. It proposes the intensive use of textual templates in the requirements phase and the systematic derivation of analysis models from these templates. This approach proposes the use of prototypes to validate requirements. The approach is supported by the NDT Suite. The development process of this approach is divided into three main stages. 1. Requirements Treatment: In this stage, the Web application requirements are collected and described. 2. Analysis. In this stage, analysis models are systematically derived from the requirements specification. These analysis models are the conceptual model and the navigational model. 3. Prototyping. This stage consists of the development of Web application prototypes from analysis models. These prototypes are used to validate requirements. 93
Usability Evaluation in Model-Driven Web Development
4.2 Usability evaluation approaches for Model-driven Web development processes Recent studies, such as that of Juristo et al. (2007), claim that usability evaluations should also be performed during the early stages of the Web development process in order to improve user experience and decrease maintenance costs. We argue that model-driven Web development processes provide an appropriate context in which to conduct early usability evaluations, since models which are applied at all stages can be evaluated throughout the entire Web development process. Despite the fact that several model-driven Web development processes have been proposed since the late 2000s, and are still evolving (Valderas and Pelechano 2011), few works address usability evaluations in this paradigm. This research line has emerged recently thank to contributions such as those of Atterer and Schmidt (2005), Abrahão and Insfran (2006), Zhao and Zou (2007), Panach et al. (2007), Sottet et al. (2007), and Molina and Toval (2009). Atterer and Schmidt (2005)proposed a prototype of a model-based usability validator. The aim was to perform an analysis of models that represent enriched user interfaces. This approach takes advantage of the navigational and presentation models that are available in model-driven Web development methods since they contain data concerning the ways in which the site is intended to be traversed and abstract properties of the page layout.. This work presented the first steps in this research area. However, the proposed usability evaluation is mainly related to detecting navigational or presentation pattern extraction from usability guidelines. The usability concept is not broken down into measurable attributes. Abrahão and Insfran (2006)proposed a usability model for early evaluation in Model-Driven Architecture environments (MDA). In this model, usability was broken down into the same sub-characteristics as those in the ISO/IEC 9126 (learnability, understandability, operability, and compliance), and then broken down again into more detailed sub-characteristics and measurable attributes. This last breakdown was performed by taking into account a set of ergonomic criteria for user interfaces which were proposed in works such as that of Bastien and Scapin(1993). Relationships between the elements from artifacts (models) of a specific model-driven development method and the usability attributes proposed were then established. However, the usability model was proposed for generic software products rather than products from the Web domain. In addition, it did not provide metrics with which to measure the proposed attributes. 94
4.2 Usability evaluation approaches for Model-driven Web development processes Sottet et al. (2007) addressed the problem of preserving usability during the adaption of user interfaces to their context of use (i.e., user, platform, and environment). This work investigated Model-driven Engineering mappings that could be used to embed both the description and control of usability. These mappings link different user interface perspectives together in order to make explicit both the user interface design rationale and the extent to which properties are preserved at runtime when the user interface is transformed to target a new context of use. Although these ideas are innovative in the interplay between usability and the model-driven development paradigm, the special characteristics of Web applications are not considered since the approach is aimed at addressing generic user interfaces. Zhao and Zou (2007) proposed a framework that incorporates the usability evaluation as an integral part of automatic processes for user interface generation. Usability was modeled by using a goal graph for each intermediate user interface model and by associating the usability goals with the attributes of these models. The aim was to link usability goals to the user interface generation process. Although automated metrics were applied in order to quantify the usability goals, the majority of these metrics were defined by considering only the disposition of elements from the user interface. Moreover, since the approach is aimed at addressing generic user interfaces, the special characteristics of Web applications were not considered either. Panach et al. (2007) employed the aforementioned usability model of Abrahão and Insfran (2006) for the evaluation of Web applications which were developed with the Object-Oriented Web Solutions method (OOWS). The aim was to provide a set of attributes related to the understandability subcharacteristic with automated metrics. These metrics are applied to conceptual models (i.e., platform-independent models that represent the static structure of the Web application) in order to establish indicators of usability. These indicators are based on value intervals obtained after applying the metrics. One of the strengths of this work was the study of the correlation between the calculated metrics at early stages and the end-user perceptions gathered from questionnaires. Although metrics were only applied to one type of conceptual model, further work has recently been carried out to incorporate other usability evaluation methods in order to cover more usability sub-characteristics (Panach et al. 2011). Molina and Toval (2009) presented a proposal with which to integrate usability requirements in model-driven Web development whose aim is to extend the expressivity of models that represent the navigation of Web applications in order to incorporate these usability requirements. This therefore improves the 95
Usability Evaluation in Model-Driven Web Development application of metrics and indicators to these models. A meta-model was defined in order to describe the requirements to be achieved for these navigational models. One of the strengths of this proposal is that it fills in some of the gaps that were identified in our systematic mapping study, such as the lack of a usability evaluation proposal during the early stages of the Web development process. However, the requirements defined are highly dependent on the values of metrics, which are based on thresholds. This can make the elicitation process more difficult if the metrics do not provide guidance concerning the threshold that needs to be selected.
4.3 Conclusions In this chapter we have provided a brief background to existing model-driven Web development methods, and we have analyzed the existing approaches that address usability evaluation in this paradigm. Model-driven Web development methods basically provide models (Web artifacts) as an outcome of each stage of the Web development process. Figure 4.2 presents a generalized overview of the commonalities of the existing model-driven Web development processes.
Figure 4.2. Overview of a generic Model-driven Web development process
With regard to the Requirements Elicitation stage, we realized that the Computation-Independent Models (CIMs) are mainly based on business processes with a higher level of abstraction (e.g., use cases). With regard to the Analysis and Design stage, we realized that the PlatformIndependent Models (PIMs) are mainly based on the three most-common perspectives of a Web application: content (e.g., class diagrams), navigation (e.g., navigational models), and presentation (e.g., abstract user interfaces). 96
4.3 Conclusions With regard to the Model Transformation stage, we realized that Platformspecific Models (PSMs) can be obtained and edited by the Web developer (e.g., database scripts, concrete user interfaces). This means that the development method follows an elaborationist approach (McNeile 2003). On the other hand, Platform-specific Models (PSMs) can be embedded inside the model compiler in order to provide PIM to CM transformations. This means that the development method follows a translationist approach (McNeile 2003), which would appear to be the most common approach. With regard to the Code Generation stage, we realized that Code models (CMs) are obtained as an outcome of the model compiler. Several development methods provide a tool that implements this model compiler and also offers guidance to developers in order to cover as many of the development stages in the process as possible. Finally, the existing approaches employed to address usability evaluations in model-driven Web development methods are the first steps in this research line in order to provide early usability evaluations. However, we realized that:
The concept of Web usability is still partially supported in these approaches. There is no a generic usability evaluation process that can be integrated into different model-driven Web development processes.
In order to address these issues, the following chapter describes the methodological contribution of this PhD thesis, which is in line with the research works mentioned in this chapter. The aim is to define a generic Web Usability Evaluation Process (WUEP) that can be instantiated in different model-driven Web development processes.
97
PART III Methodological contribution
Chapter 5 5 WUEP: A Web Usability Evaluation Process for Model-Driven Web Development This chapter presents the Web Usability Evaluation Process (WUEP), a usability inspection method that offers a generic process for use in evaluating the usability of Web applications which are developed by using a model-driven Web development processes. WUEP employs a Web Usability Model as its principal input artifact which breaks down usability into sub-characteristics, attributes and measures. This chapter is structured as follows: Section 5.1 presents the core idea of how to integrate a Web Usability Model into a Model-Driven Web Development Processes in order to evaluate and to improve the usability of Web applications. Section 5.2 describes the sub-characteristics and attributes of which the Web Usability Model is composed. This description is divided into the two perspectives offered in the ISO/IEC 25000 SQuaRE standard: Software Product Quality and Quality in Use. Finally, Section 5.3 describes the usability evaluation process by detailing all its stages and the outcomes produced in each one. The Software and Systems Process Engineering Metamodel Specification (SPEM2) (2008) was employed in order to define the whole process.
101
WUEP: A Web Usability Evaluation Process for Model-Driven Web Development
5.1 Integrating usability evaluations into Model-driven Web development processes Figure 5.1 shows how the usability of a Web application obtained as a result of this transformation process can be assessed at several stages of a model-driven Web development process. A usability model can be applied at the following levels of abstraction: a) Platform-Independent Models (PIMs); b) PlatformSpecific Models (PSMs); c) Code models (CM); and d) User interaction, when the Web application is being used in a specific context. It is important to note that Computational-Independent Models (CIMs) have been excluded since the level of abstraction that they provide is very high for the detection of usability aspects.
Figure 5.1. Integrating usability evaluations in Model-driven Web development
102
5.1 Integrating usability evaluations into Model-driven Web development processes Although a usability model may have a very large set of measurable attributes, it is important to note that there should be a pre-selection process of those usability attributes that are considered relevant according to several factors such as the aim/type of Web application, the user profile, etc. Another aspect to consider is that attributes from the Web Usability Model can be evaluated at all levels of abstraction. The higher the level of abstraction, the fewer the attributes that can be considered owing to the model’s expressiveness. In addition, the feedback obtained in each type of evaluation has different purposes depending on the abstraction level of the models:
At the PIM level it is possible to assess models that specify the Web application independently of platform details such as: presentation models, navigational models, dialogue models, etc. The set of measurable attributes that can be evaluated at this level is mainly related to how the information will be accessed by users and how this information will be presented by abstract user interface patterns (i.e., navigability, information density, etc.). However, this set of attributes may differ depending on the PIM expressiveness in each Web development method. This evaluation will generate a usability report in order to provide feedback on how to correct these PIM models in the Analysis & Design stages ((1) in Figure 5.1). Thanks to the transformations between models and the explicit traceability between them, changes in the PIM are reflected in the CM, thus avoiding usability problems in the application eventually generated. At the PSM level it is possible to assess the concrete interface models related to a specific platform. The set of measurable attributes that can be evaluated at this level is wider since it includes attributes related to specific software components (widgets) that cannot be considered at PIM level (i.e., the behavior of explore bars, visual feedback from radio buttons, etc.).This evaluation will generate a usability report in order to provide feedback to the: o Analysis & Design stage, if the usability problems detected are related to PIM models ((1) in Figure 5.1). o Model transformation stage, if the usability problems detected are related to the PSM models themselves or the transformation rules between PIM and PSM ((2) in Figure 5.1). At the CM level it is possible to evaluate the final user interface. The set of measurable attributes that can be evaluated at this level is the widest since more aspects related to the end-user perspective can be considered (i.e., browser compatibility, metaphor recognition, 103
WUEP: A Web Usability Evaluation Process for Model-Driven Web Development subjective appealing, etc.). This evaluation will also generate a usability report in order to provide feedback to the: o Analysis & Design stage, if the usability problems detected are related to PIM models ((1) in Figure 5.1). o Model transformation stage, if the usability problems detected are related to PSM models or the transformation rules between PIM and PSM ((2) in Figure 5.1). o Code generation stage, if the usability problems detected are related to transformation rules that are applied to PSM models in order to automatically generate the source code for the final Web application ((3) in Figure 5.1). The aforementioned evaluations take place during the Web application development (formative usability evaluations) and they can be carried out by the same developer by inspecting the models at different levels of abstraction. This evaluation refers to the software product quality perspective from the usability model, and they should be done in an iterative manner until these models (PIM, PSM, and CM) have the required level of usability. This permits the integration of usability evaluations during the early stages of the Web development process. However, the evaluation during the use of the Web application requires the involvement of end-users in order to collect data concerning how users are able to use the Web application. In this evaluation it is possible to evaluate the end-user’s interaction with a Web application in a given context of use. The set of attributes that can be evaluated at this level are those related to how users achieve their goals in terms of effectiveness, productivity, safety and satisfaction. This evaluation refers to the quality in use perspective from the usability model and should be supported by empirical methods such as Log Analysis or Think-aloud Protocols. This evaluation will also generate a usability report in order to provide feedback at any stage of the development process according to the origin of the usability problem detected ((1), (2) and (3) in Figure 5.1).
5.2 Web Usability Model The proposed Web Usability Model is based on the usability model for generic software products proposed in Abrahão and Insfran (2006). This model has been extended and adapted to Web-oriented products in compliance with the ISO/IEC 25000 SQuaRE standard. The Web Model Usability considers the usability sub-characteristics proposed in the ISO/IEC 25000SQuaRE standard, 104
5.2 Web Usability Model (i.e., ISO/IEC 25010 which references both the Software Product Quality Model and the Quality in Use Model). However, as was mentioned in Chapter 3, sub-characteristics are highly generic and are also defined at a high level of abstraction. Our proposed Web Usability Model therefore breaks these subcharacteristics down into other sub-characteristics and attributes in order to cover as broad a set of Web usability aspects as possible. Special attention was paid to the definition of each attribute in order to reduce the possible overlap between them. This breakdown has been carried out by considering the ergonomic criteria proposed in Bastien and Scapin (1993) and the usability guidelines for Web development such as those of Lynch and Horton (2002) and Leavit and Shneiderman (2009). These works have helped us to identify new sub-characteristics and attributes which can be considered relevant for Web applications. On the other hand, the adaptation of the Web Usability Model according to the ISO/IEC 25000 SQuaRE standard (2005) has highlighted the need to consider the two usability perspectives: the usability of a Web application from the perspective of a software product (i.e., product usability), and the usability of the Web application from the perspective of user interaction in a specific context (i.e., usability in use). Finally, the Web metrics proposed in the existing literature (e.g., Calero et al. 2005) were studied in order to provide a generic definition of each metric that can be operationalized in Web artifacts of different abstraction levels and from different model-driven Web development methods. Each metric was associated with a single attribute with the aim of discovering usability problems based on the values obtained after metric calculation. This also helps to quantify how the attribute attached to this metrics affects the usability level of the Web application. The following sub-sections (5.2.1 and 5.2.2) provide more details on each perspective of our Web Usability Model by describing all the subcharacteristics and attributes. The last sub-section (5.2.3) provides a sample set of generic metrics that are associated with their respective attributes. 5.2.1 Web Usability Model from the Quality Product perspective The ISO/IEC 25010 SQuaRE standard states that the usability of a software product can be broken down into the following sub-characteristics: Appropriateness recognizability, Learnability, Operability, User error protection, Accessibility, User interface aesthetics and Compliance. However, these sub-characteristics are generic and need to be broken down into more easily measurable attributes. 105
WUEP: A Web Usability Evaluation Process for Model-Driven Web Development The first five sub-characteristics are related to user performance and can be quantified using objective measures. Appropriateness recognizability refers to the degree to which users can recognize whether a Web application is appropriate for their needs. This subcharacteristic evolved from the Understandability characteristic, which was defined in the ISO/IEC 9126-1 (2001), in order to provide a more precise definition. In our Web Usability Model, this sub-characteristic was broken down by differentiating between those attributes that enable the optical legibility of texts and images (e.g., font size, text contrast, position of the text), and those attributes that allow information readability, which involves aspects of information that group cohesiveness, information density and pagination support. It also includes other sub-characteristics such as familiarity, the ease with which a user recognizes the UI components and views their interaction as natural; workload reduction, which is related to the reduction of user cognitive effort; user guidance, which is related to message availability and informative feedback in response to user actions; and navigability, which is related to how the content is accessed by the user. The above sub-characteristics have been adapted from ergonomic criteria which can be applicable to any type of user interface. However, upon considering both usability and Web development guidelines, navigability has also been included since it is considered to be a highly relevant subcharacteristic in any Web application. Table 5.1 shows a more detailed breakdown of the aforementioned sub-characteristics into measurable attributes. Table 5.1. Breakdown of the Appropriateness recognizability sub-characteristic Sub-characteristic
Attribute 1.1.1 Font color/sixe/face suitability
1.1 Optical legibility
1.1.2 Text recognizability 1.1.3 Disposition 1.2.1 Information grouping cohesiveness
1.2 Readability
1.2.2 Information density 1.2.3 Pagination support
106
Meaning Adaptation of the font (color, type, size) to the context Color combination of text and background should not make reading difficult Position of the text in order to be visible in any situation The degree to which the information is presented in groups with a thematic focus Amount of information needed to prevent overloads Capacity to divide content in order to make its access easier
5.2 Web Usability Model Sub-characteristic
Attribute 1.3.1 Data format consistency
1.3 Familiarity
1.3.2 Metaphor suitability 1.3.3 Internationalization 1.4.1 Action minimization
1.4 Workload reduction
1.4.2 Self-descriptiveness 1.4.3 Information complexity 1.5.1 Message availability
1.5 User guidance
1.5.2 Explicit transaction progress
1.5.3 Explicit user context
1.6.1 Internal search support 1.6.2 Clickability 1.6 Navigability 1.6.3 Interconnectivity 1.6.4 Reachability 1.6.5 Sitemap completeness
Meaning Concepts always use the same representation or notation (e.g., date: dd/mm/yyyyy) Use of metaphors from the real world to help make the interaction more natural Use of elements that follow wellknown standards Reduction of cognitive effort (i.e., actions in a few steps) Elements are shown as concisely as possible Difficulty in understanding the information provided by the Web app Availability of messages in order to guide the interaction (error, advise and warning messages) Capacity to provide the current status of transactions being performed by users(e.g., tasks completed successfully, state indicators) Capacity to provide the context in which it is located within the Web application (e.g., Log status, privacy level) Capacity to provide the content search feature in order to offer more navigational paths Capacity of a link to be recognized as a clickable element Degree of interconnection among the contents/features of the Web app Ease of access to content/features The sitemap provides access to all the features
Learnability refers to the degree to which a Web application facilitates learning about its employment. This definition originates from the “suitability for learning" concept proposed in the ISO/IEC 9241-10 (1996). Its relevance led to its incorporation into previous models as a sub-characteristic. In our Web Usability Model, this sub-characteristic was broken down into other sub-characteristics such as: predictability, which refers to the ease with which a user can determine the result of his/her future actions; affordance, which refers to how users can discover which actions can be performed in the 107
WUEP: A Web Usability Evaluation Process for Model-Driven Web Development next interaction steps; and helpfulness, which refers to the degree to which the Web application provides help when users need assistance. Several of the aforementioned concepts were adapted from the affordance term which has been employed in the Human-Computer Interaction field in order to determine how intuitive the interaction is. These sub-characteristics are of particular interest in Web applications. Users should not have to spend too much time learning about the use of the Web. If they feel frustrated when performing a task, it is likely that they may begin to seek other alternatives. Table 5.2 shows a more detailed breakdown of the aforementioned subcharacteristics into measurable attributes. Table 5.2. Breakdown of the Learnability sub-characteristic Sub-characteristic
Attribute 2.1.1 Meaningful links 2.1.2 Meaningful headings
2.1 Predictability
2.1.3 Meaningful controls 2.1.4 Meaningful multimedia content 2.2.1 Determination of possible actions
2.2 Affordance 2.2.2 Determination of promise actions 2.3.1 Quality of messages
2.3 Helpfulness
2.3.2 Immediate feedback 2.3.3. Online help completeness 2.3.4 Multi-user Documentation
Meaning Capacity to predict the next action according to the name of links. Capacity to predict the nature of the content accessed according to the headings. Capacity to predict which action will be performed by a given control Capacity to predict the purpose of the Web application according to the multimedia content provided Ease with which the user can clearly and quickly recognize what actions can be performed. Ease with which the user can clearly and quickly recognize what actions are most relevant. The messages are useful and meaningful for the user to interact correctly (error, advise and warning messages) Elements which are being interacted provide information about its status (e.g., loading cursors, highlight input fields) Help documents have all information about possible actions that can be performed by the user. All of the kinds of users have been described with their possible actions
Operability refers to the degree to which a Web application has attributes that make it easy to operate and control. This definition comes from the 108
5.2 Web Usability Model “controllability, fault tolerance and conformity to user expectations” concepts defined in ISO/IEC 9241-10 (1996). In our Web Usability Model, this sub-characteristic was broken down into other sub-characteristics related to technical aspects of Web Applications such as: Compatibility with other software products or external agents that may influence the proper operation of the Web application; Data management according to the validity of input data and its privacy; Controllability of the action execution such as cancel and undo support; Capacity to be adapted by distinguishing between adaptability, which is the Web application’s capacity to be adapted by the user, and adaptivity, which is the Web application’s capacity to adapt to the users’ needs (i.e., the difference lies in the agent that carries out the adaptation); and Consistency in the behavior of links and controls. Table 5.3 shows a more detailed breakdown of the aforementioned subcharacteristics into measurable attributes. Table 5.3. Breakdown of the Operability sub-characteristic Sub-characteristic
Attribute 3.1.1 Compatibility with browsers and plugins
3.1 Compatibility
3.1.2 Compatibility with operating systems 3.1.3 Compatibility with speed connections 3.1.4 Compatibility with screen resolution
3.2 Data Management
3.2.1 Validity of input data 3.2.2 Data privacy 3.3.1 Edition deferral 3.3.2 Cancel support
3.3 Controllability
3.3.3 Interruption support 3.3.4 Undo support 3.3.5 Redo support
Meaning Capacity of the Web application to be executed in the most common browsers without altering its behavior and appearance. Capacity of the Web application to be executed in the most common operating systems without altering its behavior and appearance. Capacity of the Web application to be used with the most common connection speeds (e.g., WiFi, 3G) Capacity of the Web application to be adaptable to the most common screen resolutions (e.g., desktop, mobile) Mechanisms are provided to verify the validity of the data entered by the user Mechanisms are provided to display the information according to privacy Content inserted can be edited at any time The actions can be canceled without harmful effects to normal operation The actions can be interrupted without harmful effects to normal operation The actions can be undone without harmful effects to normal operation The actions can be redone for the user
109
WUEP: A Web Usability Evaluation Process for Model-Driven Web Development Sub-characteristic
Attribute 3.3.6 Print format support
3.4 Capability of adaption
3.5 Consistency
3.4.1 Adaptability 3.4.2 Adaptivity 3.5.1 Constant behaviour of links/controls 3.5.2 Permanence of links/controls 3.5.3 Order consistency of links/controls 3.5.4 Headings consistency
Meaning to save work. Capacity to correctly print the content Ability of the Web application to be adapted by users Ability of the Web application to suit the needs of different users. Links/controls always have the same behavior. Links/Controls appear if their associated actions can be performed. Links/Controls are always in the same order so as not to confuse the user. Headings correspond to the actions which were performed to access themselves.
User error protection refers to the degree to which a Web application protects users from making mistakes. In the ISO/IEC 9126-1 standard, this sub-characteristic was implicit in the Operability term. However, the ISO/IEC 25010 SQuaRE standard made it explicit since it is particularly important to achieve freedom from risk. In our Web Usability Model, this sub-characteristic was broken down into other sub-characteristics related to Error prevention and Error recovery. Table 5.4 shows a more detailed breakdown of the aforementioned sub-characteristics into measurable attributes. Table 5.4. Breakdown of the User protection sub-characteristic Sub-characteristic 4. User error protection
Attribute 4.1 Error prevention 4.2 Error recovery
Meaning Availability of validation mechanisms in order to avoid typical errors Availability of mechanisms in order to recover from an error
Accessibility refers to the degree to which a Web application can be used by users with the widest range of characteristics and capabilities. Although the concept of accessibility is so broad that it may require another concrete model, the ISO/IEC SQuaRE standard added this new sub-characteristic in an attempt to integrate both concepts: usability and accessibility. In our Web Usability Model, this sub-characteristic was broken down into other sub-characteristics by considering not only a range of human disabilities (e.g., blindness, deafness) but also temporary technical disabilities (e.g., the 110
5.2 Web Usability Model unavailability of elements, device dependency). Table 5.5 shows a more detailed breakdown of the aforementioned sub-characteristics into measurable attributes. Table 5.5. Breakdown of the Accessibility sub-characteristic Sub-characteristic
Attribute 5.1 Magnifier support 5.2 Device independency
5. Accessibility
5.3 Alternative text support
5.4 Safety colors 5.5 Degree of fulfillment with the WCA Guidelines
Meaning The text of the Web application must be resized regardless of the options offered by the browser for this action. Content should be accessible regardless of the type of input device employed (mouse, keyboard, voice input). The multimedia content (images, sounds, animations) must have an alternative description to support screen readers and the temporary unavailability of these elements. The colors do not damage the integrity of users with specific problems such as epilepsy. Capacity of the Web application to follow the recommendations offered by the Web Content Accessibility Guidelines
The last two usability sub-characteristics are related to the perception of the end-user (attractiveness) or evaluator (compliance) who is using the Web Application. This perception is principally measured by using subjective measures. User interface aesthetics refers to the degree to which a user interface enables pleasing and satisfying interaction for the user. This definition evolved from the Attractiveness concept proposed in the ISO/IEC 9126 standard (2001). Although this sub-characteristic is clearly subjective and can be influenced by many factors in a specific context of use, it is possible to define attributes which may have a high impact on how users perceive the Web application. In our Web Usability Model, this sub-characteristic was broken down into other sub-characteristics related to the Uniformity of the elements presented in the user interface (e.g., font, color, position), Interface appearance customizability, which should not be confused with the sub-characteristic “3.4 Capacity to be adapted", since it is related to user needs, but is not related to aesthetic preferences; and Degree of interactivity, whose definition was proposed by Steuer (1992): "The extent to which users can participate in modifying the 111
WUEP: A Web Usability Evaluation Process for Model-Driven Web Development form and content of a media environment in real time". This concept has recently become increasingly more important owing to collaborative environments and social networks which are enabled through Web applications. Table 5.6 shows a more detailed breakdown of the aforementioned sub-characteristics into measurable attributes in which enduser involvement would not be strictly necessary. Table 5.6. Breakdown of the User interface aesthetics sub-characteristic Sub-characteristic
Attribute 6.1 Color uniformity 6.2 Font color/size/face uniformity
6. User interface aesthetics
6.3 UI position uniformity 6.4 Interface appearance customizability 6.5 Interactivity degree
Meaning The color used in each element of user interfaces is always the same The font employed in each element of user interfaces is always the same according to its color, size, and face The sections into which the user interface is divided are the same throughout the entire Web application The aesthetic characteristics (color, styles, themes) of a user interface can be selected by users according to their preferences Users can participate in modifying the form and content of the Web application in real time
Compliance refers to how the Web application is consistent with regard to rules, standards, conventions and design guidelines employed in the Web domain. In our Web Usability Model, this sub-characteristic was broken down into other sub-characteristics such as degree of fulfillment with the ISO/IEC 25000 SQuaRE (2005) since this is the standard that is based on the model, and degree of fulfillment with some of the most relevant guidelines concerning usability and Web design. These attributes can be quantified by checking what percentage of patterns or guidelines proposed in these standards have been considered in the development of the Web application. Table 5.7 shows a more detailed breakdown of the aforementioned sub-characteristics into measurable attributes. Table 5.7. Breakdown of the Compliance sub-characteristic Subcharacteristic
Attribute
7. Compliance
7.1 Degree of fulfillment with the ISO/IEC 25000 SQuaRE (2005) 7.2 Degree of fulfillment with the “Research-Based Web Design & Usability Guidelines” (2006)
112
5.2 Web Usability Model Subcharacteristic
Attribute 7.3 Degree of fulfillment with the “Web Style Guide” (2002) 7.4 Degree of fulfillment with the “Microsoft Web Design Guidelines” (2009) 7.5 Degree of fulfillment with the “Sun Guide to Web Style” (2009) 7.6 Degree of fulfillment with the “IBM Web Design Guidelines” (2009)
5.2.2 Web Usability Model from the Quality in Use perspective One of the most important issues proposed in SQuaRE is the redefinition of the Quality in Use perspective. This is defined as the degree to which a product or system can be used by specific users to meet their needs to achieve specific goals with effectiveness, efficiency, freedom from risk and satisfaction in specific contexts of use. The properties of Quality in Use are categorized into five sub-characteristics: effectiveness, efficiency, satisfaction, freedom from risk and context coverage. However, as is stated by the SQuaRE standard, usability in use is defined as a subset of quality in use consisting of effectiveness, efficiency and satisfaction when the end-user is the stakeholder to be considered. These subcharacteristics are highly abstract and need to be broken down into measurable attributes that require end-user involvement. Effectiveness in Use is defined as the degree to which specific users can achieve specific goals with completeness and accuracy in a specified context of use. This definition is very similar to that which was proposed in the ISO/IEC 9241-11. In our Web Usability Model, this sub-characteristic was broken down into other sub-characteristics such as Helpfulness, which also appears in the Web Usability Model from the software product perspective, but in this case, it is based on the results after end-user interaction; and User task performance, which contemplates whether users are able to perform all the tasks in the Web application as accurately as possible. Table 5.8 shows a more detailed breakdown of the aforementioned sub-characteristics into measurable attributes. Table 5.8. Breakdown of the Effectiveness in Use sub-characteristic Subcharacteristic 8.1. Helpfulness
Attribute 8.1.1 Online help effectiveness 8.1.2 Online help
Meaning The online help allows the user to understand what procedures need to be followed to perform their tasks The online help covers all the problems that
113
WUEP: A Web Usability Evaluation Process for Model-Driven Web Development Subcharacteristic
Attribute
Meaning
completeness
users have detected during their interaction The frequency with which users need extra help as a result of becoming disoriented Users are able to perform all their tasks regardless of the procedure used Users are able to correctly perform all their tasks by following the logical procedures established
8.1.3 Need of help 8.2 User task performance
8.2.1 User task completion 8.2.2 User task accuracy
Efficiency in Use is defined as the degree to which specific users use the right amount of resources in relation to the effectiveness obtained in a specified context of use. This definition is very similar to that which was proposed in the ISO/IEC 9241-11 and to the “productivity” concept proposed in the ISO/IEC 9126-1. In our Web Usability Model, this sub-characteristic was broken down into other sub-characteristics such as User task efficiency; Cognitive effort, which refers to the effort needed by the user to interact with the Web application; and Context limitations, which although they are not strictly dependent on the user, may largely determine the efficiency in use. Table 5.9 shows a more detailed breakdown of the aforementioned sub-characteristics into measurable attributes. Table 5.9. Breakdown of the Efficiency in Use sub-characteristic Subcharacteristic 9.1 User task efficiency
9.2 Cognitive effort
9.3 Context limitations
114
Attribute
Meaning
9.1.1 User tasks time completion
Users perform their tasks correctly in the shortest time possible The task is designed to be performed in the most intuitive and quickest way possible Degree of mental effort that users have to make for an adequate performance level. Time needed for the user to accurately remember the functionality of the Web application Extent to which external processes may affect the correct operation of the Web application Extent to which some user constraints such as age or cultural contexts are considered
9.1.2 User task load 9.2.1 Subjective mental effort 9.2.2 User interface memorability 9.3.1 System load 9.3.2 Adaptability to user skills
5.2 Web Usability Model Satisfaction in Use is defined as the degree to which users are satisfied with a specified context of use. This definition is also very similar to that proposed in the ISO/IEC 9241-11. In our Web Usability Model, this sub-characteristic was broken down into other sub-characteristics based on different dimensions of satisfaction. These dimensions are: Cognitive, when users perceive that the application complies with the functionality that they expected to find; Emotional, when users are attracted while they are using the Web application; Physical, when users do not perceive that their physical integrity is being threatened; and Trust, when users trust that the Web application operation will not harm their interests. Table 5.10 shows a more detailed breakdown of the aforementioned subcharacteristics into measurable attributes. Table 5.10. Breakdown of the Satisfaction in Use sub-characteristic Subcharacteristic 10.1 Cognitive satisfaction
10.2 Emotional satisfaction
Attribute 10.1.1 Perceived usefulness 10.1.2 Quality of the results 10.2.1 Perceived appealing 10.2.2 Perceived frustration 10.3.1 Health risk
10.3 Physical satisfaction
10.3.2 Content risk 10.4.1 Error appearance
10.4 Trustiness
10.4.2 Credibility 10.4.3 Economic risk
Meaning Users perceive that the Web application meets the needs that led them to start using it Results obtained by users after the interaction are desirable Users find the design and appearance of the user interface attractive Users perceive that they are not capable of achieving their objectives after several attempts Users can perform all tasks without any risk to their health(e.g., epilepsy) Users perceive that they are being discriminated against based on social/cultural aspects Users tend as not to trust in the Web application when it shows a considerable amount of errors Users perceive the information as true and proven Users can perform all their tasks without any risk which may affect loss of their money
Compliance in Use refers to how users interact according to rules, standards, conventions and design guidelines in the Web domain.
115
WUEP: A Web Usability Evaluation Process for Model-Driven Web Development In our Web Usability Model, this sub-characteristic was broken down into other sub-characteristics such as the degree of fulfillment with the ISO/IEC 25000 SQuaRE (2005) since this is the standard upon which the model is based; the degree of fulfillment with ergonomic criteria from the HumanComputer Interaction field (Bastien and Scapin 1993); and the degree of fulfillment with some of the most relevant questionnaires related to the Quality in Use: SUMI (Kirakowski and Corbett 1993), SUS (Brooke 1996), and QUIS (Chin et al. 1988). Table 5.11 shows a more detailed breakdown of the aforementioned sub-characteristics into measurable attributes. Table 5.11. Breakdown of the Compliance in Use sub-characteristic Sub-characteristic 11. Compliance in use
Attribute 11.1 Degree of fulfillment with the ISO/IEC 25000 SQuaRE 11.2 Degree of fulfillment with the ergonomic criteria 11.3 Degree of fulfillment with the SUMI questionnaire 11.4 Degree of fulfillment with the SUS questionnaire 11.5 Degree of fulfillment with the QUIS questionnaire
5.2.3 Generic Web measures Once the sub-characteristics and attributes have been identified, generic Web measures are then associated with the measurable attributes in order to quantify them.(the term “measure” rather than the term “metric” is employed in order to be compliant with the SQuaRE standard). The objective of including generic measures is to operationalize the Web Usability Model to be applied in different Web development methods, particularly those based on the model-driven development paradigm. As a starting point for this task, we analyzed the Web measures proposed in several works such as those of:
116
Calero et al. (2005), which conducted a survey by classifying existing measures from literature according to the Web Quality Methodology (WQM). A large number of metrics related to the usability characteristic were collected. In particular, we paid special attention to those metrics that have been theoretically or empirically validated. The SQuaRE standard (2005), which proposes a set of measures related to usability sub-characteristics. This set directly refers to a set of internal and external metrics proposed in parts 2 to 4 of the ISO/IEC 9126 standard (2001). The World Wide Web Consortium (W3C) (2008), which proposed some measures according to Web design and accessibility guidelines.
5.2 Web Usability Model The majority of the studies that present or collect Web measures do not associate them with specific quality attributes. They are mainly focused on defining measures that are usually applied when the Web application has almost been developed, (i.e., metrics related to user interface elements or source code). It is important to clarify that for those attributes in which no measures were found to quantify them, we have proposed new measures to be associated with these attributes in order for them to be applicable at more than one level of abstraction. However, this is different as regards measures that are related to navigation issues, where a variety of measures from graph theory have been proposed. These measures can be applied to navigation models that are developed in the early stages of a Web development process. Each measure was analyzed by taking into account the criteria proposed in SQuaRE, such as its purpose, its interpretation, its measurement method, the measured artifact, the validity evidence, etc. This analysis allows us to understand which usability attribute from our model is related to the concept that is intended to be measured by the measure itself. For example, the “number of navigation links” measure (Abrahão et al. 2003) is intended to quantify the amount of links between "navigational contexts" applied to models which define the user's navigation paths, and it was therefore associated with the Reachability attribute (see Table 5.1, attribute 1.6.4), which belongs to the Navigability sub-characteristic. Another example is the font style measure (Ivory 2001) which aims to count the number of different combinations of font styles directly applied to the final user interface, and this measure would therefore be associated with the Font color/size/face uniformity (see Table 5.6, attribute 6.2). It is possible to provide a measure definition that may, as far as possible, be applicable to each:
Abstraction level, since a measure refers to a measurable entity, this entity may be present in models that specify the Web application at different abstraction levels and can also be evaluated in different Web artifacts. For example, the “number of navigation links” (Abrahão et al. 2003) could be measured at the level of : o Platform-Independent Models (PIMs) if navigation is modeled as a graph in which the nodes represent the information accessed and the edges represent these Navigational links. o Platform-Specific Models (PSMs) if navigation is modeled in a particular technological platform by representing the elements that permit navigation between them. 117
WUEP: A Web Usability Evaluation Process for Model-Driven Web Development
o Code Model (CM - final application) if the entities that represent these navigation links were inspected in the final source code (e.g., HTML tags, JavaScript functions). Model-driven Web development method, since each method provides its own Platform-Independent Models with their own modeling primitives, which can provide a different level of expressiveness between different methods. To continue with the previous example, the “number of navigation links” measure is defined according to "navigational contexts" which is a concept coined by the OOWS method, whereas the same concept is called “navigational target” in the OO-H method.
The aim of applying measures was to reduce the subjectivity inherent to existing inspection methods. It is important to note that by applying measures, the evaluators inspect these artifacts in order to detect problems related to the usability for end-users but not those related to the usability of model-driven artifacts themselves. The inspection of these models (by considering the traceability among them) therefore allows the source of the usability problem to be discovered and facilitates the provision of recommendations to correct these problems during the earlier stages of the Web development process. In other words, we are referring to a Web application that can be usable by construction (Abrahão et al. 2007). The criteria considered to provide a generic definition of measures are also useful to provide guidelines concerning how to operationalize them in Web artifacts from different abstraction levels and from different Web development methods. This allows the Web Usability Model to be a versatile artifact, thus making the model a versatile Web Usability device that cannot only be applied to model-driven Web development methods (the purpose of this thesis) but also to traditional Web development methods. Appendix C presents a subset of measures which were associated with attributes from the Web Usability Model. For each measure, the name of the measure (and its reference if the measure has been proposed in existing literature), its associated usability attribute, its generic description of the metrics, the scale of its value obtained, its interpretation according the value range offered, and the abstraction levels of a model-driven Web development method in which it could be applied as a guideline are shown.
118
5.3 Definition of the Web Usability Evaluation Process
5.3 Definition of the Web Usability Evaluation Process This section details the Web Usability Evaluation Process (WUEP), which employs the aforementioned Web Usability Model as the principal input artifact. WUEP has been defined by considering the second version of the “Software & Systems Process Engineering Metamodel” (SPEM 2.0), which was proposed by the Object Management Group (2002). SPEM 2.0 is one of best-known standards with which to specify software processes, and is aimed at providing a detailed definition of these software processes in order to guide the roles involved in carrying out the process in as clear a manner as possible. Sub-section 5.3.1 briefly describes the basics of SPEM 2.0, its advantages, and the rationale for selecting it as the notation with which to define WUEP. The aim of the following sub-sections is to provide a description of each stage proposed in WUEP. 5.3.1 Introduction to SPEM2 for defining software processes The second version of the Software & Systems Process Engineering Metamodel Specification (SPEM 2.0) is a meta-model with which to define process models from Software Engineering and Systems Engineering. Its scope is limited to the minimum necessary to define these processes without adding specific characteristics of a particular discipline or domain, but it is employed to model processes from different styles, cultures, formality levels, or life cycle paradigms. This feature makes it a suitable candidate for use in modeling not only software development processes, but also quality assessment processes, in which it is also necessary to define the guidelines and artifacts involved in the whole process. The core idea of representing processes in SPEM 2.0 is based on three basic elements depicted in Figure 5.2: Role, Work product and Task. Tasks represent the effort to be made, Roles represent who performs the tasks, and Work products represent the inputs needed or the outputs produced in the tasks. The following are therefore specified: "Who (Role) carries out a task in order to obtain, from certain inputs (work products), an outcome (work products)”.
119
WUEP: A Web Usability Evaluation Process for Model-Driven Web Development
Figure 5.2. Core idea of representing processes in SPEM 2.0
Figure 5.3 provides an overview of how the key concepts defined in this specification are positioned to represent method content or process. Method content is primarily expressed using work product definitions, role definitions, and task definitions. Guidance, such as guidelines, whitepapers, checklists, examples, or roadmaps, are defined in the intersection of Method Content and Process, because Guidance can be defined to provide backgrounds for both method content and specific processes (e.g., exemplary process walkthroughs). The right-hand side of the diagram contains the elements used to represent processes in SPEM 2.0. The main element is the activity entity which can be both nested to define breakdown structures and related to other activities in order to define a flow of work. Activities are used to define processes and they also manage references to method content. These references are represented by matching ‘use’ concepts.
Figure 5.3. Key terminology mapped onto Method Content vs. Process in SPEM 2.0
Table 5.12 briefly describes the most commonly used modeling primitives when defining a process in SPEM 2.0. 120
5.3 Definition of the Web Usability Evaluation Process Table 5.12. Modeling primitives used to model processes in SPEM 2.0. Icon
Name
Description
Role definition
Set of skills, competencies and responsibilities of an individual or group
Task definition
Work Product definition
Category
Guidelines
Role use Task use Work Product use Activity Phase Iteration Process package
Describes work unit that can be assignable and manageable. It identifies the work that is being performed by roles. It can be broken down into several steps The product used or produced by the tasks. There are two types of products: Artifacts of a tangible nature (e.g., model, document, code, files) and Deliverable artifacts which package products for their delivery to an internal or external customer. They can be associated with each other through aggregation, composition or impact relationships Classifies elements such as Tasks, Roles and Products based on the criteria established by the process engineer. There are different types of categories: Role group (for Roles), Discipline (for Tasks), Domain (for Products) Provides additional information regarding other elements. The sub-types of guidelines can be (among others): Reusable Assets, guidelines, documentation, templates. The icon presented is generic, but others that are more specific to their nature can be used. Represents the role that performs a task or activity within a defined process. It refers to a role definition (element content). Represents a task within a defined process. It refers to a Task Definition (element content). Work Product represents an input or output, related to an activity or task. Refers to a definition of a Product of Labor (Content item) Activity represents a set of tasks that run within the process, along with their roles and associated Work products. If only one group of tasks is represented, it is possible to use the “Activity” or “Phase” element (the latter was included for backward compatibility), or if the set of tasks is repeated several times, it is possible to use the “iteration” element. Represents a package containing all the elements of a defined process
121
WUEP: A Web Usability Evaluation Process for Model-Driven Web Development Employing a framework such as that offered by SPEM 2 provides many advantages, since models of software processes are presented in a computerprocessable format, and it also provides the capacity to:
Facilitate the understanding and communication between stakeholders, since it provides a common framework in which the concepts have a formal definition, thus promoting homogeneous knowledge. Facilitate reuse, since the definition of a process can be integrated into other process models as parts or patterns. Support the improvement of processes, since the formal definition of activities together with their parameters makes it easier to evaluate them through measurement processes, which can provide feedback to improve processes. Support the process management as a repository in which to hold the entire process content. This facilitates access to this content by the responsible roles. Lead the process automation and the support for automatic executions through the creation of workflows, which can be implemented in software tools.
5.3.2 Web Usability Evaluation Process defined using SPEM 2.0 The Web Usability Evaluation Process (WUEP) has been defined by extending and refining the quality evaluation process that is proposed in the ISO/IEC 25000 SQuaRE standard (2005). The aim of this process is to integrate usability evaluations into model-driven Web development processes by employing a Web Usability Model as the principal input artifact. Figure 5.4 shows an overview of the main stages of WUEP. Three roles are involved: evaluation designer, evaluator, and Web developer. The evaluation designer performs the first three stages: 1) Establishing the requirements of the evaluation, 2) Specification of the evaluation, and 3) Design of the evaluation. The evaluator performs the fourth stage: 4) Execution of the evaluation. Finally, the Web developer performs the last stage: 5) Analysis of changes. The following sub-sections describe each of the main stages by including the activities into which they are broken down.
122
5.3 Definition of the Web Usability Evaluation Process
Figure 5.4. Overview of the Web Usability Evaluation Process (WUEP)
5.3.2.1 Stage 1: Establishment of Evaluation Requirements The aim of this stage is to establish the requirements of the evaluation in order to delimit the scope of the evaluation. The activities involved in this stage are described below: 1. Establish the purpose of evaluation. This activity determines the aim of the usability evaluation, i.e., whether the evaluation will be performed in a Web application in order to provide feedback during the Web development process, or during the use of the Web application in a specific context. This activity determines which Web applications are going to be evaluated and when the evaluation will take place:
While the Web application is under development (i.e., formative usability evaluation), if the aim is to predict the usability of Web applications from the Software Quality Product perspective in order to correct problems that may appear in the final Web application. When the Web application is already being used by end-users in a specific context of use (i.e., summative usability evaluation in a specific context of use), if the aim is to evaluate the usability from the Quality in Use perspective in a specific environment. Both formative and summative evaluations, if the aim is also to compare the predictions of usability predicted in the early stages with the results obtained through user testing in a specific context of use.
2. Specify profiles. The different factors that will condition the evaluation are determined. These factors are the:
Type of Web application, since each family of Web applications has different goals that have an impact on the selection of usability 123
WUEP: A Web Usability Evaluation Process for Model-Driven Web Development
attributes, i.e., navigability might be more relevant to Intranets, whereas attractiveness might be more relevant to social networks. Web development method, since knowledge about its process and artifacts is needed in order to properly integrate the usability evaluations; Context of use, which takes into account parameters such as the users’ profile (e.g., age, cultural values, language), technological requirements (e.g., operating systems, access devices), and the work environment (e.g., business rules, company type).
3. Select the Web artifacts to be evaluated. The artifacts selected may depend on either the Web development method or the technological platform. The artifacts to be considered might be:
Platform-Independent models which are obtained as output from the analysis and design stages of a model-driven Web development process. For instance: content/domain models, navigational models, and abstract user interface models. Platform-Specific models which are obtained as output from the model transformation stage of a model-driven Web development process. For instance: specific user interface models, and database schemas. Code models which are obtained as output from the code generation stage of a model-driven Web development process. For instance: source code and final user interfaces. User interaction which is obtained by gathering data from users who employ the Web application in a specific context of use.
4. Select usability attributes. The Web Usability Model is used as a catalog in order to select which usability attributes will be evaluated. The selection of usability attributes is recommended in order to involve not only the evaluator designer but also external domain experts in order to select a proper set of attributes. The different perspectives of the Web Usability Model are considered according to the purpose evaluation: usability of the software product perspective for formative evaluations during Web development, and usability in use perspective for summative evaluation in a specific context of use. The outcomes of the above activities represent the Evaluation Requirements document that will be used as input by the next stage. Figure 5.5 presents the SPEM notation of this stage.
124
5.3 Definition of the Web Usability Evaluation Process
Figure 5.5. WUEP stage 1: Establishment of Evaluation Requirements
5.3.2.2 Stage 2: Specification of the Evaluation The aim of this stage is to specify the evaluation in terms of which measures are intended to be applied and how the values obtained by these measures allow usability problems to be detected. The activities involved in this stage are described below. 1. Select the measures to be applied. The Web Usability Model is used to discover which of the measures are associated with the usability attributes selected. These measures will allow us to interpret whether or not these attributes contribute towards achieving a certain degree of usability in the Web application. The generic description of the measure is considered in order to identify whether the expressiveness of the artifact will allow us to operationalize the measure to be applied to it, since it may be possible to find measures that cannot be operationalized. In this case, limitations in the expressiveness of artifacts from the Web development method can be discovered and recommendations can also be made to improve the expressiveness of artifact metamodels. It is worth reminding the reader that the aim of providing a generic definition is to allow measures to be applied to 125
WUEP: A Web Usability Evaluation Process for Model-Driven Web Development artifacts of different abstraction levels and from different model-driven Web development processes. 2. Operationalize the measures. The calculation formulas of the selected measures should be operationalized by identifying variables from the generic definition of the measure in the modeling primitives of the selected artifacts, in other words, by establishing a mapping between the generic description of the measure and the concepts that are represented in the artifacts. In the case of models, this mapping is established in the artifact metamodel in order to calculate the formula in its instances (i.e. artifacts). In the evaluation of Web artifacts (PIM, PSM, and CM), the calculation of the operationalized formulas may require assistance from an evaluator to determine the values of the variables involved, or it may require a verification tool if these formulas are expressed in variables that can be automatically computed from the input models by query languages such as the Object Constraint Language (OCL). It is important to note that the operationalization needs to be performed once by a concrete Web development method, and can be reused in further evaluations that involve Web applications from the same Web development method. 3. Establish rating levels for measures. Rating levels are established for ranges of values obtained for each measure by considering their scale type and the guidelines related to each measure whenever possible. These rating levels allow us to discover whether the associated attribute improves the Web application’s level of usability, and are also relevant in detecting usability problems that can be classified by their level of severity. The outcomes of the above activities represent the Evaluation Specification document that will be used as input by the next stage. This document is an evolution of the Evaluation Requirements since all the outcomes are included. Figure 5.6 presents the SPEM notation for this stage.
126
5.3 Definition of the Web Usability Evaluation Process
Figure 5.6. WUEP Stage 2: Specification of the Evaluation
5.3.2.3 Stage 3: Design of the Evaluation The aim of this stage is to design how the evaluation will be performed and what information will be collected during the evaluation. 1. Define the template for usability reports. This template is defined in order to present all the data that is related to the usability problems detected. A usability report is commonly a list of usability problems detected by the evaluator. Each usability problem can be described with the following fields:
ID: code which refers to a single usability problem. Description: description of the usability problem. Affected attribute: attribute from the Web Usability Model that is affected by the problem. Severity level: this could be low, medium or critical depending on the value obtained through measures. 127
WUEP: A Web Usability Evaluation Process for Model-Driven Web Development
Artifact evaluated: artifact to which measures have been applied to detect usability problems that may appear in the final Web application. Source of the problem: artifact that originates the usability problem detected (e.g., PIMs, PSMs, CMs, and transformation rules). Occurrences: number of appearances of the same usability problem detected. Recommendations: description of how to correct the usability problem detected. It is important to note that some recommendations might also be automatically provided by interpreting the range values.
Other fields that are useful in allowing Web developers to post-analyze the usability problems detected can also be added, such as:
Priority: Importance of the usability problem according to other factors related to the Web development process. Effort: Resources that are needed to correct the usability problem. Changes: Modifications that must be performed in order to take the aforementioned fields into consideration.
2. Elaborate an evaluation plan. Designing the evaluation plan implies: establishing an evaluation order of artifacts; establishing a number of evaluators; assigning tasks to these evaluators, and considering any restrictions that might condition the evaluation. The recommended order is to first evaluate the artifacts that belong to a higher abstraction level (PIMs), since these artifacts drive the development of the final Web application. This allows us to detect usability problems during the early stages of the Web development process. The artifacts that belong to a lower level of abstraction (PSMs and CMs) are then evaluated. The outcomes of the above activities represent the evaluation plan that will be used as input by the next stage. This document contains the information needed by the evaluator in order to perform the usability evaluation. Figure 5.7 presents the SPEM notation for this stage.
128
5.3 Definition of the Web Usability Evaluation Process
Figure 5.7. WUEP Stage 3: Design of the Evaluation
5.3.2.4 Stage 4: Execution of the Evaluation The aim of this stage is to execute the evaluation in accordance with the Evaluation Plan. The evaluator applies the operationalized measures to the artifacts that have been selected. If the rating levels obtained identify a usability problem, the elements of the artifact involved that contribute towards achieving this measure value are analyzed. This helps us to determine the source of the usability problems thanks to the traceability that exists among the models in a model-driven Web development process. Figure 5.8 presents the SPEM notation for this stage. The outcomes of this stage are a:
A platform-independent usability report, which collects the usability problems that are detected during the evaluation of PIMs; A platform-specific usability report, which collects the usability problems that are detected during the evaluation of PSMs; A final Web application usability report, which collects the usability problems that are detected during the evaluation of CMs; and
129
WUEP: A Web Usability Evaluation Process for Model-Driven Web Development
A Usability Report in Use, which collects the usability problems that are detected during the end-user interaction in a specific context.
Figure 5.8. WUEP Stage 4: Execution of the Evaluation
5.3.2.5 Stage 5: Analysis of Changes The aim of this stage is to classify all the usability problems detected from each of the usability reports shown above and to analyze the recommendations provided in order to propose changes with which to correct the artifacts. The source of these usability problems may be located in:
130
Platform-independent Models (PIMs), and are related to content, navigation and presentation (e.g., problems detected in structural models, navigational models, or abstract user interfaces models). They are collected to create the improvement report in analysis & design. Platform-specific Models (PSMs) or transformation rules among PIMs and PSMs. They are collected to create the improvement report in model transformation. Generation rules among PSMs and CMs. They are collected to create the improvement report in code generation.
5.4 Conclusions The last two reports are also useful for providing feedback in order to improve the Computer-Aided Web Engineering tool (CAWE) that supports the Web development method and performs the transformations among models, along with the generation rules among models and the final source code. Figure 5.9 presents the SPEM notation for this stage. It is worth mentioning that after applying the changes suggested by the improvement reports, re-evaluations of the artifacts might be necessary.
Figure 5.9. WUEP Stage 5: Analysis of Changes
5.4 Conclusions In this chapter we have presented the methodological contribution of this thesis: the core idea of integrating usability evaluations during several stages of model-driven Web development processes, which is supported by a Web Usability Evaluation Process (WUEP). WUEP provides the concept of usability with wide-ranging support since its underlying Web Usability Model has been extended and adapted to the Web domain by considering the new ISO/IEC 25000 series of standards (SQuaRE), along with several usability guidelines. The explicit definition of the activities and artifacts of WUEP also 131
WUEP: A Web Usability Evaluation Process for Model-Driven Web Development provides evaluators with more guidance and offers the possibility of automating (at least to some extent) several activities in the evaluation process by means of a process automation tool. We believe that the inherent features of model-driven Web development processes (e.g., traceability between models by means of model transformations) provide a suitable environment in which to perform usability evaluations. The integration of WUEP into these environments is thus based on the evaluation of artifacts, particularly intermediate artifacts (models), at several abstraction levels from different model-driven Web development processes. The evaluation of these models (by considering the traceability among them) allows the source of the usability problem to be discovered and facilitates the provision of recommendations to correct these problems during the earlier stages of the Web development process. This signifies that if the usability of an automatically generated user interface can be assessed, the usability of any future user interface produced by model-driven Web development processes could be predicted. In other words, we are referring to a user interface that can, at least to some extent, be usable by construction (Abrahão et al. 2007). Usability can thus be taken into consideration throughout the entire Web development process. This enables better quality Web applications to be developed, thereby reducing effort at the maintenance stage. The following chapter is devoted to the practical contribution of this thesis. The Web Usability Evaluation Process has been instantiated in two different well-known model-driven Web development methods: OO-H (Gómez et al. 2001) and WebML (Ceri et al. 2000) in order to show the feasibility of the theoretical framework.
132
PART IV Practical Contribution
Chapter 6 6 Instantiation of the Web Usability Evaluation Process This chapter presents the practical contribution of this thesis: how the Web Usability Evaluation Process (WUEP) can be instantiated for the evaluation of a Web application developed using a model-driven Web development process. The aim is to show the feasibility of WUEP by providing examples which help to clarify its defined tasks, and to learn some lessons which may not only help to improve the evaluation process, but also provide information on how to improve the model expressiveness of model-driven Web development processes. WUEP was instantiated in order to be applied to two different well-known model-driven Web development methods: Object-Oriented Hypermedia (OOH), and Web Modeling Language (WebML). Section 6.1 is devoted to the instantiation in the OO-H method, whereas Section 6.2 is devoted to the instantiation in the WebML method. A collection of the lessons learned from both instantiations is presented in Section 6.3.
6.1 Instantiation of WUEP in the OO-H method This section presents how WUEP can be instantiated for the evaluation of a Web application developed using the Object-Oriented Hypermedia method 135
Instantiation of the Web Usability Evaluation Process (OO-H). This method is supported by the VisualWade tool, which provides the edition and compilation of the models proposed by the method. We have selected the OO-H method for the following reasons:
The fact that it is a model-driven Web development method that is being employed in the development of real Web projects in a local company. The availability of the corresponding conceptual models of real Web applications in addition to their generated source code. The fact that it can be considered a representative method of the whole set of model-driven Web development methods, as is mentioned in Moreno and Vallecillo (2008). The flexibility of its CAWE tool (VisualWade), which can be extended in order to automate the evaluation of some usability attributes, and also the visual editors provided for modeling purposes since they facilitate the application of metrics by usability inspectors.
Section 6.1.1 briefly introduces the OO-H by providing an overview of the Web artifacts (models) proposed and their principal modeling primitives. Section 6.1.2 presents the Web application to be evaluated as an example, including a brief explanation of both its functionality and the Web artifacts whose aim is to specify the Web application. Section 6.1.3 makes use of the contents of previous sections and the definition of WUEP in order to show how the instantiation is carried out in the proposed example. 6.1.1 Introduction to OO-H and its modeling primitives Object-Oriented Hypermedia is a model-driven Web development method that provides the semantics and notation needed to develop Web applications. Figure 6.1 shows its process schema which involves the following models:
136
Use Case Model: A set of diagrams that represent the Web application’s functionality and the stakeholders. It is important to note that this model does not provide mechanisms with which to specify non-functional requirements. Class Model: Diagram representing the domain concepts and the static structure of the Web application (i.e., similar to a UML class diagram). It consists of classes, attributes, methods and relationships between classes. It also allows the integration of OCL expressions in order to define additional restrictions or attribute derivations.
6.1 Instantiation of WUEP in the OO-H method
Navigational model: Set of Navigation Access Diagrams (NADs) that specify the functional requirements in terms of navigational needs and users’ actions. Each NAD is a partial view from the class diagram and its purpose is to structure the navigational view of the Web application for a specific kind of user. It also allows the integration of OCL expressions in order to define constraints and navigation filters. Presentation example: A set of Abstract Presentation Diagrams (APD) whose initial version is obtained by merging the former models (class diagram and NADs). The APDs are then refined in order to represent the visual properties of the final user interface.
It should be noted that OO-H offers a traslationist vision of the model-driven development paradigm (McNeile 2003), in other words, Platform-specific Models (PSMs) are embedded in the model compiler in order to provide direct PIM to CM transformations.
Figure 6.1. Overview of the Object-Oriented Hypermedia process
Some of the most relevant modeling primitives belonging to the concrete Platform-independent models proposed by the OO-H method are presented below: Navigational Model and Abstract Presentation Model.
137
Instantiation of the Web Usability Evaluation Process 6.1.1.1
OO-H navigational model
The Navigational Model is defined by a set of Navigation Access Diagram (NAD). Table 6.1 presents a brief description of the main modeling primitives employed to specify a NAD. They can be classified into two main categories: nodes and links. Filters and navigational patterns are also included to improve the NAD expressiveness. Filters can be expressed by using OCL expressions which help to restrict the users' access according their profiles. Navigational patterns provide the Index and Navigation features. The Index feature allows the information to be separated on different pages for better readability, while the Navigation feature allows the number of items per page to be shown in order to guide the user. Table 6.1. NAD modeling primitives in OO-H Nodes Modeling primitive
Meaning A Collection is a hierarchical structure that groups a set of navigational links. It is an abstraction from the menu concept. A Navigational Class represents a view of a set of attributes and methods in a class from the UML class diagram that defines the content and the static structure of the Web application. An attribute can be: Visible: its value is shown to the user. Referenced: Available on request from the user. Hidden: Employed for debugging purposes. Labels are special nodes that display derived information which is built through OCL expressions. A Navigational Target is a package that includes all the elements (Navigational Class, Navigational links, Home) that work covering the navigation needs for a specific type of user. In fact, it represents an entire NAD.
Links Modeling primitive
138
Meaning Each NAD has a unique Entry Point User that indicates the starting point of the navigation process. A Target Link represents that the target node is reachable by explicit user navigation. (Depicted as a bold arrow) A Source Link represents that the target node is reachable in the same navigation step in which the source node was reached. (Depicted as an empty arrow)
6.1 Instantiation of WUEP in the OO-H method An Automated Link represents that the target node is reachable with no need for user navigation. (Depicted as an arrow with a broken line) A Service Link represents the execution of a method from a navigational class. It can be both Target Link or Source Link (It is depicted with a gear icon)
6.1.1.2
OO-H abstract presentation model
A default APD, reflecting the abstract page structure of the interface, can be automatically derived from the NAD diagram. This default APD provides a functional but rather simple interface (with default location and styles for each information or interaction item, and only simple patterns are applied), which needs further refinements in order to become useful for its inclusion in the final application. It can, however, serve as a prototype with which to validate that the user requirements have been correctly captured. Furthermore, it separates the different features that contribute to the final interface appearance and behavior by using a page taxonomy, based on the concept of templates and expressed as XML documents, which are, namely:
Tstruct: Used to capture the information that needs to be shown. Tform: Used when the page, apart from information, includes calls to underlying logic. Tlink: Captures the interconnection and dependencies among pages. Tfunction: Gathers client functionality used on the different pages. Texternal: Used to gather type, location and behavior of external elements (e.g., images, applets) that may refine the initial interface. Tlayout: Where the location of elements and the definition of simultaneous views and synchronization is captured. Tstyle: Where OO-H maintains features such as typography or color palette for each element of the interface. Twidget: Where implementation constructs are related to the different information and interaction items depending on the final implementation platform and language. Tlogic: Where the system keeps implementation details regarding interaction with underlying business logic (e.g., kind of service, parameters, connection protocol).
139
Instantiation of the Web Usability Evaluation Process Since working with XML files is difficult and non-intuitive, the VisualWade tool provides a graphical editor which abstracts the edition of these XML files in a more intuitive manner based on a common Web design tool. This editor is able to manage all the modifications of the XML documents. 6.1.2 Operationalization of measures for OO-H The operationalization of measures is a means to establish a mapping between the generic definition of the measure and the modeling primitives that are represented in a specific model obtained during a specific Model-driven Web development process. This subsection presents the operationalization of a subset of measures (extracted from the Web Usability Model) to be applied in Web artifacts from the OO-H method. These measures are the same as those that will be applied in the following section, 6.1.4, which aims to show the usability evaluation of a Web application developed by using OO-H. Although we are aware that this step belongs to the “Specification of the Evaluation” stage of WUEP, we provide the operationalized measures in this sub-section since they can be reused for any usability evaluation of a Web application developed by using OO-H, and not only for the case study presented in the following sections. Table 6.2 presents the operationalization of some of the Web generic measures that were collected in Appendix B.3. This table only shows the details of the measure operationalization (i.e., calculation formula to be applied to a Web artifact from OO-H, and the thresholds established in order to detect a usability problem). The details regarding the generic definition of the measure are shown in Appendix B.3.
140
6.1 Instantiation of WUEP in the OO-H method
Table 6.2. Operationalized measures for OO-H Measure Attribute Web artifact Operationalization
Default value availability (DVA) Appropriateness recognizability / Workload reduction / Action minimization Navigational Access Diagram (NAD) Default values refer to those attributes from Navigational Classes that require a default value to be shown to users. This feature can be found on the attribute properties. Therefore, the formula to be applied is: DVA (NAD) =
Thresholds
Number of attributes without a default value Total number of potential attributes
Where “potential attributes” are those attributes that are required to have a default value (e.g., code identifiers, derived attributes, attributes whose values need to be recover for query/modification purposes, attributes with a common selected value). [DVA = 0]: No usability problem. [0 < DVA ≤ 0.3]: Low usability problem. [0.3 < DVA ≤ 0.6]: Medium Usability Problem. [0.6 < DVA ≤ 1]: Critical Usability Problem. These thresholds were established by equally dividing the range of obtained values in convenient intervals
Measure Attribute Web artifact Operationalization
Thresholds
Breadth of the inter-navigation (BiN) Appropriateness recognizability / Navigability / Reachability Navigational Access Diagram (NAD) This measure can be only operationalized in those NADs that represent the first navigation level. Therefore, the formula to be applied is: BiN (NAD) = Number of Output Target Links from Collections connected to Navigational targets. [BiN = 0]: Critical Usability Problem. [1 ≤ BiN ≤ 9]: No usability problem. [10 ≤ BiN ≤ 14]: Low usability problem. [15 ≤ BiN ≤ 19]: Medium Usability Problem. [BiN ≥ 20]: Critical Usability Problem. These thresholds were established considering Hypertext research works such as Botafogo et al. 1992, and usability guidelines such as Leavit and Shneiderman 2006, and Lynch and Horton 2002.
141
Instantiation of the Web Usability Evaluation Process Measure Attribute Web artifact Operationalization
Thresholds
Breadth of the intra-navigation (BaN) Appropriateness recognizability / Navigability / Reachability Navigational Access Diagram (NAD) This measure can be only operationalized in those NADs that are packaged in a Navigational Target since they represent the second navigation level. Therefore, the formula to be applied is: BaN (NAD) = Number of Target Links which starts the navigation. (i.e., those Target Links which have not been reached through others path containing Target Links) [BaN = 0]: Critical Usability Problem. [1 ≤ BaN ≤ 9]: No usability problem. [10 ≤ BaN ≤ 14]: Low usability problem. [15 ≤ BaN ≤ 19]: Medium Usability Problem. [BaN ≥ 20]: Critical Usability Problem. These thresholds were established considering Hypertext research works such as Botafogo et al. 1992, and usability guidelines such as Leavit and Shneiderman 2006, and Lynch and Horton 2002.
Measure Attribute Web artifact Operationalization
Thresholds
Depth of the Navigation (DN) Appropriateness recognizability / Navigability/ Reachability Navigational Access Diagram (NAD) This measure considers the number of navigation steps from the longest navigation path. Therefore, the formula to be applied is: DN (NAD) = Number of navigation steps from the longest navigation path Where “Navigation step” is when a Target Link exists between two nodes (any modeling primitive and/or more than one modeling primitives connected by Automated Links and/or Source Links). And where “Longest navigation path” is the path with the greatest number of navigation steps, which begins in the first Navigational Class or Collection where the navigation starts, and which ends in the last Navigational Class or Service Link, from which it is not possible to reach another modeling primitive previously visited. [1 ≤ DN ≤ 4]: No usability problem. [5 ≤ DN ≤ 7]: Low usability problem. [8 ≤ DN ≤ 10]: Medium Usability Problem. [DN ≥ 10]: Critical Usability Problem. These thresholds were established considering Hypertext research works such as Botafogo et al. 1992, and usability guidelines such as Leavit and Shneiderman 2006, and Lynch and Horton 2002.
142
6.1 Instantiation of WUEP in the OO-H method Measure Attribute Web artifact Operationalization
Thresholds
Compactness (Cp) Appropriateness recognizability / Navigability/ Interconnectivity Navigational Access Diagram (NAD) This measure is calculated by applying the formula: (Max – i j Dij) Cp (NAD)= Max – Min Where: Max = (n2 - n)*k; Min = (n2 - n); n = quantity of nodes (Navigational Classes, Collections, Labels, Services) in the graph; k = constant superior to the amount of nodes; ∑i ∑j Dij = the sum of distances taken from the matrix of converted distances (with factor k); Dij = the distance between the nodes i and j. [0.2 ≤ Cp ≤ 0.8]: No usability problem. [0.1 ≤ Cp < 0.2] ∪ [0.8 < Cp ≤ 0.9]: Low usability problem. [0 < Cp < 0.1] ∪ [0.9 < Cp < 1]: Medium Usability Problem. [Cp=0] ∪ [Cp=1]: Critical Usability Problem. These thresholds were established considering Hypertext research works such as Botafogo et al. 1992.
143
Instantiation of the Web Usability Evaluation Process Measure Attribute Web artifact Operationalization
User Operation Cancellability (UOC) Operability / Controllability / Cancel support Navigational Access Diagram (NAD) This measure considers the Services (depicted by an engine icon) which are connected the Navigational Classes methods through Service Links. These methods provide the cancellation if exists: - A Target Link from the associated Navigation Class to the previous navigation step when the Service Link is a Source Link.
-
A Target Link from the Service node to the previous navigation step of the associated Navigation Class when the Service Link is a Target Link.
Therefore, the formula to be applied is:
UOC(NAD) = Thresholds
Number of Services that do not provide a return Target Link
[UOC = 0]: [0 < UOC ≤ 0.3]: [0.3 < UOC ≤ 0.6]: [0.6 < UOC ≤ 1]:
Total number of Services No usability problem. Low usability problem. Medium Usability Problem. Critical Usability Problem.
These thresholds were established by equally dividing the range of obtained values in convenient intervals
144
6.1 Instantiation of WUEP in the OO-H method Measure Attribute Web artifact Operationalization
Proportion of links without meaningful names (PLM) Learnability / Predictability / Meaningful links Abstract Presentation Diagram (APD) This measure can be calculated in all the abstract pages belonging to an Abstract Presentation Diagram (APD) by considering the proportion of non-proper names used by APD links. Therefore, the formula to be applied is: PLM(APD) =
Thresholds
Number of links without a meaningful name
[PLM = 0]: [0 < PLM ≤ 0.3]: [0.3 < PLM ≤ 0.6]: [0.6 < PLM ≤ 1]:
Total number of links No usability problem. Low usability problem. Medium Usability Problem. Critical Usability Problem.
These thresholds were established by equally dividing the range of obtained values in convenient intervals Measure Attribute Web artifact Operationalization
Proportion of non-meaningful messages (PNM) Learnability / Helpfulness / Quality of messages Abstract Presentation Diagram (APD) This measure can be calculated by considering those Abstract Pages with provide an error/warning/advise message. Therefore, the formula to be applied is: Number of non-meaningful messages PNM(APD) = Total number of messages
Thresholds
[PNM = 0]: [0 < PNM ≤ 0.3]: [0.3 < PNM ≤ 0.6]: [0.6 < PNM ≤ 1]:
No usability problem. Low usability problem. Medium Usability Problem. Critical Usability Problem.
These thresholds were established by equally dividing the range of obtained values in convenient intervals.
145
Instantiation of the Web Usability Evaluation Process Measure Attribute Web artifact Operationalization
Color Contrast (CC) Appropriateness Recognizability / Optical legibility / Text recognizability Abstract Presentation Diagram (APD) This measure can be calculated by considering the ForeColor and BackgroundColor attributes of those textual elements (links, normal text) disposed in all the Abstract Pages. Therefore, the formula to be applied in each element is: CC (∀element ∈ APD) = Σ | ForeColor(i)- BackgroundColor(i)|
Thresholds
let i={Red Value, Green Value, Blue Value} based on the RGB notation. [CC > 500]: No usability problem. [400 < CC ≤ 500]: Low usability problem. [300 < CC ≤ 400]: Medium Usability Problem. [CC ≤ 300]: Critical Usability Problem. These thresholds were established considering the W3C guidelines (2008).
Measure Attribute Web artifact Operationalization
Proportion of images without alternative text (PIA) Accessibility / Alternative text support Abstract Presentation Diagram (APD) This measure can be calculated in all images which are integrated in the abstract pages by considering their “text” attribute associated. Therefore, the formula to be applied is: PIA(APD) =
Thresholds
Number of images with an empty text attribute
[PIA = 0]: [0 < PIA ≤ 0.3]: [0.3 < PIA ≤ 0.6]: [0.6 < PIA ≤ 1]:
Total number of images No usability problem. Low usability problem. Medium Usability Problem. Critical Usability Problem.
These thresholds were established by equally dividing the range of obtained values in convenient intervals.
146
6.1 Instantiation of WUEP in the OO-H method Measure Attribute Web artifact Operationalization
Understandability of data inputs (UDI) Appropriateness recognizability / Workload reduction / Action minimization Abstract Presentation Diagram (APD) This measure can be calculated by considering the labels of the input fields of the forms represented in the abstract pages. Therefore, the formula to be applied is: UDI(APD) =
Thresholds
Number of input fields without a meaningful name Total number of input fields
[UDI = 0]: [0 < UDI ≤ 0.3]: [0.3 < UDI ≤ 0.6]: [0.6 < UDI ≤ 1]:
No usability problem. Low usability problem. Medium Usability Problem. Critical Usability Problem.
These thresholds were established by equally dividing the range of obtained values in convenient intervals. Measure Attribute Web artifact Operationalization
Proportion of validation mechanisms for input data (PVM) Operability / Data management / Validity of input data Abstract Presentation Diagram (APD) This measure can be calculated by considering the mechanisms associated to the input fields of forms represented in the abstract pages. Therefore, the formula to be applied is: PVM(APD) =
Thresholds
Number of input fields without a validation mechanism Total number of potential input fields
Where “potential input fields” are those fields that are required to have a validation mechanism such as data about a restricted set of values (e.g., gender, age), Data according to a concrete format (e.g., dates, telephone numbers, emails), etc. [PVM = 0]: No usability problem. [0 < PVM ≤ 0.3]: Low usability problem. [0.3 < PVM ≤ 0.6]: Medium Usability Problem. [0.6 < PVM ≤ 1]: Critical Usability Problem. These thresholds were established by equally dividing the range of obtained values in convenient intervals
147
Instantiation of the Web Usability Evaluation Process Measure Attribute Web artifact Operationalization
Visibility of links and actions (VLA) Learnability / Affordance / Determination of possible actions Final User Interface (FUI) This measure can be calculated by considering all the clickable elements of user interface in order to determine whether they easy to identify. Therefore, the formula to be applied is: VEA(FUI) =
Thresholds
Number of clickable elements that are difficult to identify Total number of clickable elements
[VLA = 0]: [0 < VLA ≤ 0.3]: [0.3 < VLA ≤ 0.6]: [0.6 < VLA ≤ 1]:
No usability problem. Low usability problem. Medium Usability Problem. Critical Usability Problem.
These thresholds were established by equally dividing the range of obtained values in convenient intervals Measure Attribute Web artifact Operationalization
Headings according to the target of the links (HAT) Operability / Consistency / Heading consistency Final User Interface (FUI) This metric can be calculated by considering the names of the links and the headings of the content reached by these links. Therefore, the formula to be applied is: HAT (FUI) = Number of links that are not in accordance with the heading reached by the link.
Thresholds
[HAT = 0]: [1 ≤ HAT ≤ 3]: [4 ≤ HAT ≤ 6]: [HAT ≥ 7]:
No usability problem. Low usability problem. Medium Usability Problem. Critical Usability Problem.
These thresholds were established by proposing arbitrary intervals.
148
6.1 Instantiation of WUEP in the OO-H method Measure Attribute Web artifact Operationalization
Current state when interacting with the user interface (CSI) Appropriateness recognizability / User guidance / Explicit user context Final User Interface (FUI) The current state of the user interface can be characterized by checking if the interface: Provides information on which user is using the Web application. Clearly points out in which section or functionality is the user currently. Provides traceability about previous actions to reach that state (breadcrumbs, highlighted links in sub-sections, etc.). Highlight which element of the user interface is being used at that time by the user. According to the previous list of issues. The value of the metric is: 0 = If the interface meets the four issues. 1 = If the interface meets only three out of the four issues. 2 = If the interface meets only one or two out of the four issues. 3 = If the interface does not meet any issues.
Thresholds
[CSI = 0]: [CSI = 1]: [CSI = 2]: [CSI = 3]:
No usability problem. Low usability problem. Medium Usability Problem. Critical Usability Problem.
Measure Attribute Web artifact Operationalization
Misfit UI elements (ME) User interface aesthetics / UI position uniformity Final User Interface (FUI) This measure can be calculated by considering if the elements contained within a frame exceed its size, causing it not fit properly for being correctly displayed. Therefore, the formula to be applied is: ME (FUI) = Number of misfit UI elements
Thresholds
[ME = 0]: [1 ≤ ME ≤ 2]: [3 ≤ ME ≤ 4]: [ME ≥ 5]:
No usability problem. Low usability problem. Medium Usability Problem. Critical Usability Problem.
These thresholds were established by proposing arbitrary intervals.
149
Instantiation of the Web Usability Evaluation Process Measure Attribute Web artifact Operationalization
Variations in the order of links (VOL) Operability / Consistency / Order consistency of links and controls Final User Interface (FUI) This measure can be calculated by considering if links from the same type or navigation structure are always presented in the same order. VOL (FUI) = Number of times that links appears in a different order within the same set of links.
Thresholds
[VOL = 0]: [1 ≤ VOL ≤ 2]: [3 ≤ VOL ≤ 4]: [VOL ≥ 5]:
No usability problem. Low usability problem. Medium Usability Problem. Critical Usability Problem.
These thresholds were established by proposing arbitrary intervals. Measure Attribute Web artifact Operationalization
Behavior differences of UI elements among browsers (BDE) Operability / Compatibility / Compatibility with browsers and plugins Final User Interface (FUI) This measure can be calculated by considering if the user interface elements have the same behavior in the most employed browsers. Therefore, the formula to be applied is: BDE(FUI) = Number of elements with different behavior or appearance
Thresholds
[BDE = 0]: [1 ≤ BDE ≤ 2]: [3 ≤ BDE ≤ 4]: [BDE ≥ 5]:
No usability problem. Low usability problem. Medium Usability Problem. Critical Usability Problem.
These thresholds were established by proposing arbitrary intervals.
6.1.3 Case study: Task Manager The Web application used as a case study is a Task Manager developed for the control and monitoring of Web development projects. A Web development project involves a series of Tasks that are assigned to an Employee, a Web designer who belongs to the Web development company. The start date, predicted end date, priority, etc, of each task is recorded. The Project Manager (Admin) organizes tasks into Folders according to certain criteria: the remaining tasks, the critical tasks, etc. External Files can additionally be attached to a concrete task (e.g., requirements documents, source code, etc.). Developers can also write Comments about the tasks and send Messages to other developers. Every working day, developers generate a Daily Report by including information related to the tasks they are currently working on. Finally, the company’s clients are recorded as Contacts in the same Task Manager application. 150
6.1 Instantiation of WUEP in the OO-H method The models that represent this Web application are described in the following sub-sections. 6.1.3.1 Use Case model Figure 6.2 presents the Use Case model for the Task Manager Web application. It is a Computational-Independent Model (CIM) that was provided, and which is employed as the basis for the Platform-Independent models (PIMs) generated in the analysis and design stages.
Figure 6.2. Use Case model for TaskManager
There are two types of users: Employee and Manager. Basically, the Manager actor can perform all the Web application functional requirements with the exception of that of “Add a Report”. The Employee actors’ functionality is, meanwhile, limited to the creation of a daily report, consulting their own tasks, adding comments or files to tasks, or changing the percentage that has been created for each assigned task. VisualWade does not support the creation and edition of this model. 6.1.3.2 Class model Figure 6.3 presents the Class model for the Task Manager Web application. It represents the concepts of the Web application domain and the relationships 151
Instantiation of the Web Usability Evaluation Process established between them. This first Platform-Independent model is built by considering the Use Case model and the domain knowledge. Each concept is represented in one class. Classes contain a set of attributes and methods. Each class has an attribute that identifies instances created (attributes depicted with the key icon), attributes that describe the entity represented in the class (normal attributes), and derived attributes whose value is derived from another (attributes depicted with the slash '/'). The class methods are intended to create/modify/delete instances belonging to the class and to establish relationships among them.
Figure 6.3. Class diagram for TaskManager
It is important to note that both types of users have been represented with a single class which includes the profile attribute to differentiate them. Navigational models therefore consider both types of users by adding OCL constraints to distinguish the data/actions that are visible to each user: Employee and Manager. VisualWade supports the creation and edition of this class model, 152
6.1 Instantiation of WUEP in the OO-H method thus allowing visibility properties to be assigned to attributes, or parameters to be assigned to methods. 6.1.3.3 Navigation and Presentation models As was mentioned in the introduction to OO-H, navigation and presentation models are closely related. This sub-section therefore presents the Navigation Access Diagram (NAD) with the Abstract Presentation Diagram (APD), both of which have been refined from an initial version obtained directly from each NAD. The navigation model consists of four NADs: one to represent the main access to the home, and three to represent the Web application functionality, while the presentation model also consists of four APDs, one for each NAD. Figure 6.4 presents the first level of navigation (NAD0) which represents the user login (Employee or Manager) by using the Entry Point User link. The Home collection includes the authenticate Target Link with a filter (based on information from the User navigational class) which allows users to login their credentials if both username and password are correctly entered. If the credentials are correct (i.e., constraint represented by a precondition in the LI4 automatic Link), the restricted home Collection is reached. Otherwise, the LI2 Automatic Link reaches the error Collection which offers the option of returning to the original form via another link (LI6 Target Link). This restricted home Collection includes links to each of the four possible Navigational Targets: Tasks, Contacts, Reports and Notes. The LI96 Source Link reaches the connected as Label which shows the user name. The LI63 Automatic Link provides the Tasks Navigational Target as default when users login to the Web application.
153
Instantiation of the Web Usability Evaluation Process
Figure 6.4. NAD0: First level NAD for TaskManager
Figure 6.5 shows the Abstract Presentation Diagram (APD0) associated with the aforementioned NAD0. APD0 includes three Abstract Pages:
154
The first Abstract Page (Figure 6.5(a)) corresponds to the Home collection and the authenticate Target Link that reaches the User navigational class (Figure 6.4(a)). The second Abstract Page (Figure 6.5(b)) corresponds to the error Collection and the LI6 Target Link (Figure 6.4(b)). This page presents the associated error when access is attempted with the wrong credentials. The third Abstract Page (Figure 6.5(c)) corresponds to the restricted home Collection and the Target Links that access all the Navigational Targets (Figure 6.4(c)). The correspondences between the NAD0 and the APD0 are as follows: Tasks --> Tasks, Reports --> Reports, Contacts -> Contacts, Notes -->Whats new. However, the connected as Label is also displayed on this same Abstract Page since it is reached by the LI96 Source Link.
6.1 Instantiation of WUEP in the OO-H method
Figure 6.5. APD0: APD associated with NAD0
Figure 6.6 shows the NAD which represents the task management feature of the Web application (NAD1). The Tasks Navigational Target in Fig 6.4 includes the entire NAD1. The user can start navigation (LR3) by selecting one of the folders which contains Tasks. These folders can be those created by the manager (Folder_name attribute), those which are predefined (Target Links: all, out of date, pending or completed), or those filtered by username (User2). The manager is able to create a new folder by using the new class method of the Sorter Navigational Class. When accessing the folder information (Sorter_detail), the LI12Source Link shows all tasks that are contained in that folder, thus allowing the creation of new tasks (new method of the Task Navigational Class) or access to its details (LI49 Target Link) in order to modify its properties. It is also possible to write comments (Comment Navigational Class) and to attach files (File Navigational Class).
155
Instantiation of the Web Usability Evaluation Process
Figure 6.6. NAD1: NAD for task management
Owing to the large number of Target Links, several Abstract Pages are derived from the previous NAD1. Figure 6.7 shows the Abstract Presentation Diagram (APD1) associated with the previous NAD1. APD1 principally includes seven Abstract Pages, among others:
156
The first Abstract Page (Figure 6.7(a)) corresponds to the Sorter and ByUser navigational classes (Figure 6.6(a)). It shows the available folders and link to allow the creation of a new folder (allowed for the manager).
6.1 Instantiation of WUEP in the OO-H method
The second Abstract Page (Figure 6.7(b)) corresponds to the Sorter_detail and Task Navigational Classes (Figure 6.6(b)) since there is a Source Link between both classes. Its aim is to show the task list filtered by folder. The third Abstract Page (Figure 6.7(c)) corresponds to the No Tasks collection (Figure 6.6(c)). Its aim is to show the associated warning message. The fourth Abstract Page (Figure 6.7(d)) corresponds to the Task_detail, Attached_file and Comment Navigational classes (Figure 6.6(d)) since there are Source Links among them. Its aim is to show the task details along with the actions that can be performed. The fifth Abstract Page (Figure 6.7(e)) corresponds to the new method of the Create_task navigational class (Figure 6.6(e)). It provides the interface needed to enter a new task in the Web application. Form fields correspond to the parameters of the method and they should be entered by the user. The sixth Abstract Page (Figure 6.7(f)) corresponds to the new method of the File Navigational Class (Figure 6.6(f)). It provides the interface needed to associate a new file with an existing task. Form fields correspond to the parameters of the method and they should be entered by the user. The seventh Abstract Page (Figure 6.7(g)) corresponds to the new method of the Comment Navigational Class (Figure 6.6(g)). It provides the interface needed to associate a new comment with an existing task. In this case the only form field is the text of the comment.
It is important to note that some Abstract Pages have been omitted since they are very similar to those mentioned above (e.g., those related to the modify, assign_user, unassign_user methods). We have also omitted the Abstract Page derived from the WSIPmarket Navigational Class since its functionality is provided by an external WebService.
157
Instantiation of the Web Usability Evaluation Process
Figure 6.7. APD1: APD associated with NAD1
Figure 6.8 shows the NAD which represents the contact management feature of the Web application (NAD2). The Contact Navigational Target in Fig 6.4 includes the entire NAD2. Users can retrieve the information concerning all contacts or they can search for a given contact by providing an initial or a search string. These functionalities are represented by the three Target Links 158
6.1 Instantiation of WUEP in the OO-H method that connect the contact menu collection and the Contact Navigational Class. If the search produces no result (LI83 Automatic Link), it reaches a warning state represented by the No Coincidences collection. Users can also create a new contact by accessing the New method of the Contact1 Navigational Class.
Figure 6.8. NAD2: NAD for contact management
Figure 6.9 shows the Abstract Presentation Diagram (APD2) associated with the previous NAD2. APD2 includes four Abstract Pages:
The first Abstract Page (Figure 6.9(a)) corresponds to the Contact menu collection (Figure 6.8(a)). It represents the interface with the different means that can be used to access the contacts, and also the possibility of adding a new one. The second Abstract Page (Figure 6.9(b)) corresponds to the Contacts Navigational Class (Figure 6.8(b)). It shows the list of contacts which is obtained as a result of searching, along with the visible attributes included in the Contact Navigational Class. The third Abstract Page (Figure 6.9(c)) corresponds to the No Coincidences collection (Figure 6.8(c)). Its aim is to show the warning message when no contacts have been found. The fourth Abstract Page (Figure 6.9(d)) corresponds to the new method of the Create_contact Navigational Class (Figure 6.8(d)). It provides the interface needed to enter a new contact in the Web application. Form fields correspond to the parameters of the method and they should be entered by the user.
159
Instantiation of the Web Usability Evaluation Process
Figure 6.9. APD2: APD associated with NAD2
Figure 6.10 shows the NAD which represents the report management feature of the Web application (NAD3). The Reports Navigational Target in Fig 6.4 includes the entire NAD3. The users start the navigation (LR4) in the Reports collection in which they can access all the titles of their own reports (All_reports), the reports classified by user name (ByUser) and the current daily report (Today_report). From the Reports collection, the users can search reports 160
6.1 Instantiation of WUEP in the OO-H method filtered by content (byContent Target Link) or filtered by dates (byDates Target Link).If the search produces no result (LI45 Automatic Link), it reaches a warning state represented by the No Coincidences Collection. In addition, users can create a daily report through the new method from the Create_report Navigational Class, and they can also access and modify the details of each report (Report_detail Navigational Class).
Figure 6.10. NAD3: NAD for report management
Figure 6.11 shows the Abstract Presentation Diagram (APD3) associated with the previous NAD3. APD3 includes five Abstract Pages:
The first Abstract Page (Figure 6.11(a)) corresponds to the Reports collection and the Today_report, All_reports and By_User Navigational Classes (Figure 6.10(a)), since they are connected to the collection by Source Links. It represents the different means that can be used to access the reports. The second Abstract Page (Figure 6.11(b)) corresponds to the Reports_found Navigational Class (Figure 6.10(a)). It represents the list of reports obtained after the report search along with the names of their authors. The third Abstract Page (Figure 6.11(c)) corresponds to the No Coincidences collection (Figure 6.10(c)). Its aim is to show the warning message when no reports have been found. 161
Instantiation of the Web Usability Evaluation Process
The fourth Abstract Page (Figure 6.11(d)) corresponds to the Report_detail Navigational Class (Figure 6.10(d)). It represents the information associated with the report that has been accessed. The fifth Abstract Page (Figure 6.11(e)) corresponds to the new method of the Create_report Navigational Class (Figure 6.10(e)). It provides the user interface for the creation of a new report in the Web application. Form fields correspond to the parameters of the method and they should be entered by the user.
Figure 6.11. APD3: APD associated with NAD3
It is important to note that all the Abstract Pages belonging to an APD are placed in frames in order to compose the final user interface. These frames are 162
6.1 Instantiation of WUEP in the OO-H method defined in the Tlayout template and each Abstract Page can be assigned to one frame to be displayed. Figure 6.12 shows the schematic representation of the Tlayout template for the TaskManager Web application. The identifiers of the frames (L1, L2, L3 and L4) correspond to the numbers which are shown in the figures in which each Abstract Page is presented.
Figure 6.12. Representation of Tlayout template
All of the aforementioned Platform-Independent models (PIMs) are used as input to the model compiler in order to generate the source code of the final Web application. 6.1.3.4 Final User Interfaces (Code Model) The final Web application is obtained directly by the model compiler models: both logic and user interface layers are implemented in PHP (it is possible to select the PHP version), while the persistence layer can be implemented according to the database engine desired (e.g., MySQL, Excel, and Oracle). Examples of final user interfaces which were obtained after executing the source code provided by the model compiler are presented as follows. Figure 6.13 shows the final user interface associated with the login feature (FUI0). Figure 6.14 shows the final user interface associated with the task management (FUI1), Figure 6.15 shows the final user interface associated with the contact management (FUI2), and finally, Figure 6.16 shows the final user interface associated with the management reports (FUI3).
163
Instantiation of the Web Usability Evaluation Process
Figure 6.13. FUI0: Final User Interface for login
Figure 6.14. FUI1: Final User Interface for task management
164
6.1 Instantiation of WUEP in the OO-H method
Figure 6.15. FUI2: Final User Interface for contact management
165
Instantiation of the Web Usability Evaluation Process
Figure 6.16. FUI3: Final User Interface for report management
6.1.4 Evaluating the usability of Web applications developed with OO-H This section is intended to show the feasibility of the Web Usability Evaluation Process (WUEP) by applying it in order to evaluate the usability of the TaskManager Web application that was developed using the OO-H 166
6.1 Instantiation of WUEP in the OO-H method development process. The same stages of WUEP are followed in order to lead the proof of concept. 6.1.4.1 Establishment of the evaluation requirements The steps in this stage are: the establishment of the evaluation purpose, the specification of evaluation profiles, the selection of Web artifacts, and the selection of usability attributes. All these outcomes should be presented in the Evaluation Requirements document: Purpose of the Evaluation: The objective is to conduct a formative evaluation of the usability of the Web application TaskManager. (i.e., the usability evaluation takes place in parallel with the development process). Evaluation Profiles are defined according to the type of Web application, Web development method, and context of use:
Web Application Type: the TaskManager Web application is an Intranet. Some of the more common basic characteristics in these applications are: o Inherent advantages of a Web application: access from any technological platform, centralization and synchronization of the content, etc. o Forums or contact methods as internal discussion topics. o Folders for all relevant topics. o The establishment of security levels. o The creation of places in which to publish notes, articles, opinions, etc. o It allows traceability among the user actions. o It facilitates the realization of collaborative work o Personal Calendar o Contact list (database of business contacts). o The publishing of highlighted events, news, notes, articles, opinions, etc. Development Method: The model-driven Web development method employed was the OO-H method (The information relating to the method is referred to in Section 6.1.1). Meanwhile, the CAWE tool used in Web application development was VisualWade, since it offers the OO-H method full support. Context of use: some relevant aspects concerning how the Web application is going to be used are:
167
Instantiation of the Web Usability Evaluation Process o TaskManager is targeted to Web development companies which need to cover the control and monitoring of the ongoing projects. o The user profile is a Web developer/programmer between 20 and 40 years of age with high-level skills in computer science, whereas the administrator profile is a project manager, without a specific age range and with a medium-high level of knowledge in computer science. o The technological requirements are: PCs running Windows XP/7 and Internet Explorer/Mozilla Firefox as Web browsers. Selection of Web artifacts: According to the purpose of the evaluation, the Web artifacts to be evaluated are those related to all the stages of the Web development process:
Navigational Model: NAD0, NAD1, NAD2, and NAD3. Abstract Presentation Model: APD0, APD1, APD2 and APD3. Final User Interface (Code Model): FUI0, FUI1, FUI2, and FUI3.
Selection of Usability attributes: A set of 15 usability attributes were selected from the Web Usability Model. The attributes were selected by considering which of them would be most relevant to the type of Web application and the context in which they would be used. The list of attributes is presented as follows according to their first-level sub-characteristics. Attributes selected from the Appropriateness Recognizability sub-characteristic are: Attributes selected from the Appropriateness Recognizability sub-characteristic are:
Action minimization (from Workload reduction ) Reachability (from Navigability) Interconnectivity (from Navigability) Text recognizability (from Optical Legibility) Explicit user context (from User guidance)
Attributes selected from the Learnability sub-characteristic are:
Meaningful links (from Predictability) Quality of messages (from Helpfulness) Determination of possible actions (from Affordance)
Attributes selected from the Operability sub-characteristic are: 168
Cancel support (from Controllability) Validity of input data (from Data management)
6.1 Instantiation of WUEP in the OO-H method
Heading consistency (from Consistency) Order consistency of links/controls (from Consistency) Compatibility with browser and plugins (from Compatibility)
Attributes selected from the User interface aesthetics sub-characteristic are:
UI position uniformity
Attributes selected from the Accessibility sub-characteristic are:
Alternative text support
6.1.4.2 Specification of the evaluation The steps in this stage are: the selection of measures, the operationalization of these measures and the establishment of their rating levels. We selected the measures associated with the selected attributes (a total of 18 measures) and then operationalized them in order for them to be applied in the Web artifacts provided by the OO-H method. These measures, along with their operationalization and rating levels, were presented previously in Section 6.1.2. Therefore, and according to the Web artifacts selected, the operationalized measures to be applied in NADs are:
Default value availability (DVA) (from Action minimization) Breadth of the inter-navigation (BiN) (from Reachability) Breadth of the intra-navigation (BaN) (from Reachability) Depth of the Navigation (DN) (from Reachability) Compactness (Cp) (from Interconnectivity) User Operation Cancellability (UOC) (from Cancel support)
The operationalized measures to be applied in APDs are:
Proportion of links without meaningful names (PLM) (from Meaningful links) Proportion of non-meaningful messages (PNM) (from Quality of messages) Color Contrast (CC) (from Text recognizability) Proportion of images without alternative text (PIA) (from Alternative text support) Understandability of data inputs (UDI) (from Action minimization) 169
Instantiation of the Web Usability Evaluation Process
Proportion of validation mechanisms for input data (PVM) (from Validity of input data)
The operationalized measures to be applied in FUIs are:
Visibility of links and actions (VLA) (from Determination of possible actions) Headings according to the target of the links (HAT) (from Heading consistency) Current state when interacting with the user interface (CSI) (from Explicit user context) Misfit UI elements (ME) (from UI position uniformity) Variations in the order of links (VOL) (from Order consistency of links and controls) Behavior differences of UI elements among browsers (BDE) (from Compatibility with browsers and plugins)
6.1.4.3 Design of the evaluation The steps in this stage are: the definition of the template used to report usability problems, and the elaboration of the evaluation plan. Table 6.3 presents the template defined to report usability problems. Table 6.3. Template used to report usability problems ID Description Affected attribute
Severity level
Artifact(s) evaluated
Source(s) of the problem
170
PXX. Code to identify the usability problem detected, where XXX is a sequential number (001, 002, etc.) Textual description of the problem identified based on the result obtained from the measure and the elements involved in its calculation. ID. Sub-characteristic / … / ID. Attribute. Usability attribute belonging to Web Usability Model which is affected by this problem, and also indicating its high-level subcharacteristic. [Critical / Medium / Low] (measure rating level) Criticality level of the intervals defined above for the measure. If the problem exists in several of the devices tested (the same type and level of abstraction) is regarded as the level of criticality higher than them. Code of the Web artifact Web artifact in which measures have been applied to detect usability problems that may appear at the final Web application. It can be: NAD, APD, and FUI. Code of the Web artifact Web artifact that originates the usability problem detected. It can be: NAD, APD, transformation rules, and code generation rules.
6.1 Instantiation of WUEP in the OO-H method Occurrences Recommendations Priority
Resources
Number of appearances Number of appearances of the same usability problem detected in the web artifacts evaluated. Description about how to correct the usability problem detected. [High, Medium, Low] Priority Importance of the usability problem according to other factors related to the Web development process (to be filled in by the stakeholder responsible for the Web artifact). Resources (in terms of time, financial, etc.) need to correct the proposed changes (to be filled in by the stakeholder responsible for the Web artifact).
With regard to the evaluation plan, some restrictions were considered such as not having access to the transformation and code generation rules embedded in the model compiler of VisualWADE. We were therefore able to detect that there are problems associated with these rules, but not exactly what the exact rule causing the usability problem is. The evaluation plan to be followed is based on the evaluation of all the aforementioned Web artifacts from the highest to the lowest abstraction level: 1. All the Navigational Access Diagrams: NAD0, NAD1, NAD2, and NAD3. 2. All the Abstract Presentation Diagrams: APD0, APD1, APD2, and APD3. 3. All the Final User Interfaces: FUI0, FUI1, FUI2, and FUI3. 6.1.4.4 Execution of the evaluation The steps in this stage are the application of the operationalized measures to the artifacts that have been selected. If the rating levels obtained identify a usability problem, the elements of the artifact involved that contribute to achieving this measure value are analyzed. In this case, only the evaluation of Platform-Independent Models and Code Model are considered. PIM Evaluation: NADs. The following operationalized measures were applied to each Navigational Access Diagram. Default value availability (DVA): this measure was applied to only to the NADs which include Navigational classes with those attributes that are required to have a default value (NAD1 and NAD3). This default value has been checked, although this information is not shown in the figures owing to issues of readability.
171
Instantiation of the Web Usability Evaluation Process
DVA(NAD1) = 2/6 = 0.33, since of the 6 attributes which require a default value (start_date, ended_percentage, parent_folder, comment_owner, 2 x ico_priority), only the first two do not have a default value. DVA(NAD3) = 0/1 = 0, since the only attribute which requires a default value (date) has it.
This signifies that a medium usability problem was detected since the value obtained in NAD1 is in the threshold [0.3authenticate> clients > LI4 >Target Links to Navigational Targets DN(NAD1) =4, since there are 4 Target Links that cover the longest path which is composed of the following modeling primitives: Classifier > LI87 >LI86>own_task>LI53>task_details>LI98>classifier_detail> LI12 >LI33> Task1 DN(NAD2) =2, since there are 2 Target Links that cover the longest path which is composed of the following modeling primitives: Contact_menu>newContact>Contact1 > LS16 >LI82> Contact DN(NAD3) =3, since there are 3 Target Links that cover the longest path which is composed of the following modeling primitives: Reports >bydates> Daily_report1 >LI41> daily_report2 >LS11.
This signifies that no usability problem was detected since the values obtained are in the threshold [1 ≤ DN ≤ 4]. Users are therefore able to reach any content in an acceptable number of navigation steps. Compactness (Cp): this measure was applied to all the Navigational Access Diagrams (NAD0, NAD1, NAD2, and NAD3). However, it is necessary to calculate the matrix of converted distances beforehand. Since this calculation requires more extra space, we include only the full explanation for the NAD0. The results for the remaining NADs are shown directly.
Cp(NAD0)= 0.42. The explanation is as follows: since there is a total of 8 nodes (n=8), we assigned letters from "A" to "H" to the NAD’s nodes (i.e., A=home, B=clients, C=error, D=restricted_home, E=Tasks, F=Reports, G=Contacts, H=Notes). We counted the minimum distance 173
Instantiation of the Web Usability Evaluation Process from each node to the others. If one node is not reachable by another, the value assigned is the ‘k’ constant (in this case, we arbitrarily assigned the same value as the total number of nodes: k = 8). The sum of each row corresponds to the Converted Out Distance (COD), and the sum of each column corresponds to the Converted In Distance (CID). Therefore, Σi Σj Ci = 285 (see Table 6.5). Table 6.5. Matrix of converted distances for NAD0 A B C D E F G H COD
A
0
1
2
2
3
3
3
3
17
B
2
0
1
1
2
2
2
2
12
C
1
2
0
3
4
4
4
4
22
D
1
2
3
0
1
1
1
1
10
E
8
8
8
8
0
8
8
8
56
F
8
8
8
8
8
0
8
8
56
G
8
8
8
8
8
8
0
8
56
H
8
8
8
8
8
8
8
0
56
CID 36 37 38 38 34 34 34 34
285
By considering Max = (n2 - n) * k = (82-8) * 8 = 448, and Min = (n2 n) = (82-8) = 56, therefore: 448 - 285 Cp(NAD0) = = 0.42 448 - 56 Cp(NAD1) = 0.79 Cp(NAD2) = 0.58 Cp(NAD3) = 0.26
This signifies that no usability problem was detected since the values obtained are in the threshold [0.2 ≤ Cp ≤ 0.8]. The Web app’s contents are therefore properly connected to each other. This enables users to reach any content by considering the previous content accessed. User Operation Cancellability (UOC): this measure was applied solely to the NADs which include Navigational classes with methods connected to Services Links (NAD1, NAD2, and NAD3): 174
UOC(NAD1) = 8/8 = 1, since none of the Services provides a Target Link to return to the previous navigation step. UOC(NAD2) = 1/1 = 1, since none of the Services provides a Target Link to return to the previous navigation step.
6.1 Instantiation of WUEP in the OO-H method
UOC(NAD3) = 2/2 = 1, since none of the Services provides a Target Link to return to the previous navigation step.
This signifies that a critical usability problem was detected since the value obtained is in the threshold [0.6 < UOC ≤ 1]. Table 6.6 presents the usability report associated with this usability problem (P02). Users may therefore encounter difficulties in controlling the functionalities of the Web application since some operations cannot be cancelled prior to their execution. Table 6.6. Usability report for usability problem P02 ID Description Affected attribute Severity level Artifact evaluated Problem source Occurrences Recommendations
P02 There some operations that does not support the cancellation by the user Operability / Controllability / Cancel support Critical: [0.6 < UOC ≤ 1] Navigational Access Diagrams (NAD1, NAD2, NAD3) Navigational Access Diagrams (NAD1, NAD2, NAD3) 11 Services without Target Link to return. For each Service, provide a Target Link called “Cancel”: - From the associated Navigation Class to the previous navigation step when the Service Link is a Source Link - From the Service node to the previous navigation step of the associated Navigation Class when the Service Link is a Target Link.
PIM Evaluation: APDs. The following operationalized measures were applied to each Abstract Presentation Diagram. Proportion of links without meaningful names (PLM): this measure was applied to all the Abstract Presentation Diagrams which contain links (APD0, APD1, APD2, APD3):
PLM(APD0) = 0/7 = 0, since of all the existing link names (Enter, return, Tasks, Reports, contacts, whats new, and exit), all of them provide a meaningful name. PLM(APD1) = 4/15 = 0.26,since of all the existing link names (New folder, All tasks, Pending tasks, New comment, Upload file, 3 x New, aIe, etc.), only the three “new” and the “aIe” links are not meaningful. The “new” links are not meaningful since they do not clearly represent the actual action which is to accept/confirm/commit the creation of a new element; whereas the “aIe” link is not meaningful since it does not clearly represent the actual action, which is to modify an existing task. 175
Instantiation of the Web Usability Evaluation Process
PLM(APD2) = 1/5 = 0.2, since of all the existing link names (View all contacts, 2 x Search, and2 x New), only the last “new” link belonging to the form is not meaningful. The “new” link is not meaningful since it does not represent the actual action, which is to accept/confirm/commit the creation of a new contact. PLM(APD3) = 2/9 = 0.22, since of all the existing link names (user_name, 2 x search, View today report, report title, title and autor,aIe,and New) only the last “new” belonging to the form, and the “aIe” links are not meaningful. The “new” link is not meaningful since it does not clearly represent the actual action which is to accept/confirm/commit the creation of a new daily report, whereas the “aIe” link is not meaningful since it does not clearly represent the actual action, which is to modify an existing report.
This signifies that a low usability problem was detected since the value obtained is in the threshold [0 < PLM ≤ 0.3]. Table 6.7 presents the usability report associated with this usability problem (P03). Users may therefore encounter difficulties in predicting the target of these links. Table 6.7. Usability report for usability problem P03 ID Description Affected attribute Severity level Artifact evaluated Problem source Occurrences Recommendations
P03 There are some links that are not meaningful for the end-user Learnability / Predictability / Meaningful links Low: [0 < PLM ≤ 0.3] Abstract Presentation Diagram (APD0, APD1, APD2 and APD3) Navigational Access Diagram 7 Links: 5x new and 2x aIe. Rename the alias property of these links in their corresponding NAD: Replace the name “new” by “OK”, and the name “aIe” by “Edit” or “Modify”
Proportion of non-meaningful messages (PNM): this measure was applied to all the Abstract Presentation Diagrams which contain a Collection aimed at showing a message (APD0, APD1, APD2, APD3): 176
PNM(APD0) = 0/1 = 0, since the message “Login or password incorrect” is concise and clear. PNM(APD1) = 0/1 = 0, since the message “The selected folder does not have any task associated to it by the moment” is concise and clear. PNM(APD2) = 0/1 = 0, since the message “No results have been found” is concise and clear.
6.1 Instantiation of WUEP in the OO-H method
PNM(APD3) = 0/1 = 0, since the message “No results have been found” is concise and clear.
This signifies that no usability problem was detected since the values obtained are in the threshold [PNM = 0]. The messages are therefore useful to help users in learning about the employment of the Web application. Color Contrast (CC): this measure was applied to each element from all the Abstract Presentation Diagrams by considering the values of their ForeColor and BackgroundColor properties. These properties have been checked, although this information is not shown in the figures owing to issues of readability. Since the list of elements is too extensive, we show the calculation for the Telephones and emails label from the APD2.
CC(Label: Telephones and emails) = 332, since the RGB values for the ForeColor are (33, 85, 189) and those for the BackgroundColor are (192, 192, 255). Therefore, |33-192|+|85-192|+|189-255|=332.
This signifies that a low usability problem was detected since the value obtained is in the threshold [300 < CC ≤ 400]. Table 6.8 presents the usability report associated with this usability problem (P04). Users may therefore encounter difficulties related to the legibility of some elements in the user interface. Table 6.8. Usability report for usability problem P04 ID Description Affected attribute Severity level Artifact evaluated Problem source Occurrences Recommendations
P04 There are some labels whose color contrast is not suitable for a proper legibility Appropriateness Recognizability / Optical legibility / Text recognizability Medium: [300 < CC ≤ 400] Abstract Presentation Diagram APD2 Abstract Presentation Diagram APD2 2 labels: Telephones and emails and address. Modify the ForeColor property of both labels by decreasing the Green Value.
Proportion of images without alternative text (PIA): this measure was applied to all the Abstract Presentation Diagrams by considering the text property associated with the images inserted in their abstract pages. These properties have been checked, although this information is not shown in the figures owing to issues of readability. It is important to note that this property receives the image filename as default. All the images are therefore provided with an alternative text: 177
Instantiation of the Web Usability Evaluation Process
PIA(APD0) = 0/2 = 0, images: key icon, exclamation icon PIA(APD1) = 0/13 = 0, images: 3x portfolio icon, 8x folder icon, exclamation icon, and zip icon. PIA(APD2) = 0/4 = 0, images: 2x contact card icon, avatar image, exclamation icon. PIA(APD3) = 0/4 = 0, images: user icon, report icon, exclamation icon, and arrow icon.
This signifies that no usability problem was detected since the values obtained are in the threshold [PIA = 0]. The alternative texts offered therefore improve the accessibility of the Web application by providing screen readers that interpret the images for blind people or by including this text as a description when the images are temporarily unavailable. Understandability of data inputs (UDI): this measure was applied to all the Abstract Presentation Diagrams containing data input forms (APD0, APD1, APD2, and APD3):
UDI(APD0) = 0/2 = 0, since all the inputs (user and password) are easy to understand. UDI(APD1) = 2/9 = 0.22, since of all the existing inputs, only the inputs Reassign and File are not easy to understand. The reassign input does not provide any additional descriptive label, whereas the File input is in conflict with its next input: File name. UDI(APD2) = 1/18 = 0.05,since of all the existing inputs, only in the case of the Type input is it not easy to understand the type of contact that is referred to. UDI(APD3) = 1/5 = 0.2, since of all the existing inputs, only the database_report input is in conflict with its previous input: Daily report.
This signifies that a low usability problem was detected since the values obtained are in the threshold [0 < UDI ≤ 0.3]. Table 6.9 presents the usability report associated with this usability problem (P05). Users may therefore encounter difficulties in understanding which inputs are required in order to carry out their task.
178
6.1 Instantiation of WUEP in the OO-H method Table 6.9. Usability report for usability problem P05 ID Description Affected attribute Severity level Artifact evaluated Problem source Occurrences Recommendations
P05 There are some forms with data inputs that are difficult to understand. Appropriateness recognizability / Workload reduction / Action minimization Low: [0 < UDI ≤ 0.3] Abstract Presentation Diagram (APD0, APD1, APD2 and APD3) Abstract Presentation Diagram (APD0, APD1, APD2 and APD3) 4 Data inputs: Reassign, File, type, and database_report Modify the labels associated to this inputs in order to provide another one more meaningful.
Proportion of validation mechanisms for input data (PVM): this measure was applied to all the Abstract Presentation Diagrams containing data input forms which require a pre-validation mechanism (APD1, APD2, and APD3):
PVM(APD1) = 0/4 = 0, since all the existing form fields which require a pre-validation mechanism provide one. A list-box is provided for the priority and assigned user fields, and a calendar widget is provided for the begin date, and start date fields). PVM(APD2) = 0/1 = 0, since the single form field which requires a pre-validation mechanism provides one. A list-box is provided for the initial field. PVM(APD3) = 2/2 = 1,since none of the existing form fields which require a pre-validation provide any mechanism. No calendar widget is provided for the from and to fields.
This signifies that a critical usability problem was detected since the values obtained are in the threshold [0.6 more details (1st Normal Link) > Combination details > More products > Product summary > Details (2nd Normal Link) > Product Details > more images (3rd Normal Link) > Product. This signifies that no usability problem was detected, since the value obtained is in the threshold [1 ≤ DN ≤ 4]. The customer is therefore able to reach any content in an acceptable number of navigation steps. Breadth of the inter-navigation (BiN): Upon applying the formula of this measure for the first level of navigation, we obtain the value ‘4’, since there are two pages which are marked as Landmarks but are not included in any area (Homepage and Stores), and two Areas (Products, and Offers) which are also marked as Landmarks. Upon applying the formula of this measure for the second level of navigation , we obtain the value ‘3’, since it is the maximum value between that provided by the Area Products which has 3 pages marked as Landmarks (By category, By price, and Product search) and the Area Offers which has no pages marked as Landmarks. This signifies that no usability problem was detected, since both of the values obtained are in the threshold [1 ≤ BiN ≤ 9]. The customer does not therefore get lost in the content owing to the fact there is an acceptable number of options to navigate at the same time. Paginated Content (PC): Upon applying the formula of this measure, we obtain the value 7/8=0.875 since of a total of 8 Units (2 MultiDataUnits and 6 IndexUnits), there are only 7 Units which are not connected to a ScrollUnit (1 MultiDataUnits: Enlarged images, and 6 IndexUnits: All Stores, Categories, All Products, Products found, Combination of products, and Combinations found). This signifies that a critical usability problem was detected since the value obtained is in the threshold [0.6 < PC ≤ 1]. Table 6.18 presents the usability report associated with this usability problem (UP001). The customer therefore perceives difficulties with the readability of the content owing to the fact that too much information may be presented at the same time and several scrolling actions may be needed.
198
6.2 Instantiation of WUEP in the WebML method
Table 6.18. Usability report for usability problem UP001 ID Description Affected attribute Severity level Artifact evaluated Problem source Occurrences Recommendations
UP001 There is too much information presented at the same time and several scrolling actions may be needed. Appropriateness recognizability / Readability / Pagination support Critical [0.6 < PC=0.875 ≤ 1] Hypertext Model HM1 Hypertext Model HM1 1 MultiDataUnits: Enlarged images, and 6 IndexUnits: All Stores, Categories, All Products, Products found, Combination of products, and Combinations found. Connect the affected MultiDataUnits and IndexUnits to an ScrollUnit in order to support pagination content.
Links with the same targets (LST): Upon applying the formula of this measure, we obtain the value 1/2=0.5 since of a total of 2 Units which are reached by several Normal Links (DataUnits: Product details and Combination Details), there is only 1 unit (Product details) whose incoming Normal Links have different names from each other (show, more, details, back, go). This signifies that a medium usability problem was detected since the value obtained is in the threshold [0.3 < LST ≤ 0.6]. Table 6.19 presents the usability report associated with this usability problem (UP002). The customer may therefore be misled owing to the consistency in the behavior of links. Table 6.19. Usability report for usability problem UP002 ID Description Affected attribute Severity level Artifact evaluated Problem source Occurrences Recommendations
UP002 There is no consistency in the behavior of some links since different names are provided to links with the same target. Operability / Consistency / Constant behavior of links Medium: [0.3 < LST=0.5 ≤ 0.6] Hypertext Model HM1 Hypertext Model HM1 1 DataUnit: Product Details. Rename the incoming Normal Links of the affected DataUnits with a same name (e.g., “more details”) in order to provide better consistency.
According to the evaluation plan, the following measures are applied in HM2: Proportion of actions with error messages associated (PAE). Upon applying the formula of this measure, we obtain the value 3/3=1, since of a 199
Instantiation of the Web Usability Evaluation Process total of 3 Operation Units (Create Store, Modify Store, and Delete Store), none of them has its KO link connected to a MultiMessageUnit. This signifies that a critical usability problem was detected since the value obtained is in the threshold [0.6 < PAE ≤ 1]. Table 6.20 presents the usability report associated with this usability problem (UP003). The administrator does not therefore receive any guidance about which errors have appeared when performing operations with the Web application. Table 6.20. Usability report for usability problem UP003 ID Description Affected attribute Severity level Artifact evaluated Problem source Occurrences Recommendations
UP003 There are no messages in order to identify which types of errors have been occurred during performing operations Appropriateness recognizability / User guidance / Message availability Critical: [0.6 < PAE=1 ≤ 1]: Hypertext Model HM2 Hypertext Model HM2 3 Operation Units: Create Store, Modify Store, and Delete Store. Connect a MultiMessageUnit to the KO link of each Operation Unit.
Proportion of links without meaningful names (PLM): Upon applying the formula of this measure, we obtain the value 2/8=0.25 since of a total of 8 Normal Links (logout, modify, apply, cancel, accept, expand, drop, and new), there are only 2 Normal Links (expand, and drop) whose names are not meaningful, since these names are closer to a programmer jargon rather than the language of a final end-user (The administrator is not required to have programming skills). This signifies that a medium usability problem was detected since the value obtained is in the threshold [0.3 < PLM ≤ 0.6]. Table 6.21 presents the usability report associated with this usability problem (UP004). The administrator may therefore encounter difficulties in predicting the target of these links. Table 6.21. Usability report for usability problem UP004 ID Description Affected attribute Severity level Artifact evaluated Problem source Occurrences Recommendations
200
UP004 There are some links that are not meaningful for the end-user Learnability / Predictability / Meaningful links Low: [0 < PLM=0.25 ≤ 0.3] Hypertext Model HM2 Hypertext Model HM2 2 Normal Links: expand and drop. Rename these Normal Links in order to provide a more predictable name. For instance, drop replaced by remove, and expand replaced by details.
6.2 Instantiation of WUEP in the WebML method
User operation cancellability (UOC): Upon applying the formula of this measure, we obtain the value 2/3=0.66 since of a total of 3 Operation Units (Create Store, Modify Store, and Delete Store), only two OperationUnits (Create Store, and Delete Store) are not reached by a unit which has a return link to its predecessor. This signifies that a critical usability problem was detected since the value obtained is in the threshold [0.6 < UOC ≤ 1]. Table 6.22 presents the usability report associated with this usability problem (UP005). The administrator may therefore encounter difficulties in controlling the functionalities of the Web application since some operations cannot be cancelled prior their execution. Table 6.22. Usability report for usability problem UP005 ID Description Affected attribute Severity level Artifact evaluated Problem source Occurrences Recommendations
UP005 There some operations that does not support the cancellation by the user Operability / Controllability / Cancel support Critical: [0.6 < UOC=0.66 ≤ 1] Hypertext Model HM2 Hypertext Model HM2 2 Operation Units: Create Store, and Delete Store. With regard the OperationUnit Create Store, adding a new Normal Link cancel from the EntryUnit New Store to the Page All Stores. With regard the OperationUnit Delete Store, adding a intermediate EntryUnit confirmation between the IndexUnit All stores and the OperationUnit itself. The new EntryUnit confirmation would have a new Normal Link cancel from itself to the Page All Stores.
The five usability problems detected are collected in the platform-independent usability report since they were obtained during the evaluation of platformindependent models (i.e., WebML Hypertext models). 6.2.4.5 Analysis of changes With regard to the analysis of changes stage of WUEP, since the five usability problems previously detected have a common source (i.e., Hypertext Models), they are merged in an improvement report in design. This is owing to the fact that the Hypertext models are the artifact created during the design stage of the model-driven Web development process. The changes proposed by this report are analyzed in terms of the resources needed by the Web developers and are later corrected. Figure 6.23 shows the corrected Hypertext Models as the output of this stage. By considering the traceability between the Hypertext 201
Instantiation of the Web Usability Evaluation Process Model and the final Web application, the corrections proposed in the Hypertext Models will obtain a more usable Web application by construction.
Figure 6.23. Changes in both Hypertext Models: HM1 and HM2
202
6.3 Lessons learned from cases studies
6.3 Lessons learned from cases studies The instantiation of WUEP in two different model-driven Web development methods (i.e., OO-H and WebML) provided several experiences from which it was possible to learn certain lessons. Firstly, it shows the feasibility of evaluating the usability of a Web application at several stages of a model-driven Web development process when intermediate artifacts (models) are provided that specify the Web application at different levels of abstraction. The integration of WUEP into different modeldriven Web development processes therefore addresses one of the most important needs that were found by the systematic mapping study: usability should be taken into account throughout the entire Web development process, especially in early phases in order to predict usability problems that the majority of usability evaluation methods would detect when the Web application is almost complete or deployed. Thus, the usability of Web applications is obtained by construction, and not by the maintenance of the final source code. Secondly, although only a limited set of usability attributes were evaluated in two Web applications developed by different model-driven Web development processes, the Web Usability Model provided by WUEP offers an extensive catalog that covers the Web usability concept in a broad manner. However, the completeness of the evaluation depends on the stages performed by the evaluation designer since it will be conditioned by the selection of usability attributes according to the evaluation context: type of Web application, context of user, Web development method, etc. Thirdly, WUEP provides a detailed evaluation methodology that specifies which steps need to be carried out in each phase of the evaluation. One of the most important features of WUEP is the fact that it is a generic evaluation process which can be instantiated in different model-driven Web development methods, since the operationalization of measures permits a mapping between the generic definition of the measure and the modeling primitives of the particular method. The operationalization of measures at different abstraction levels consequently allows WUEP to be instantiated not only in a model-driven Web development method, but in other traditional development processes, by operationalizing metrics only in final user interfaces. However, usability reports will only provide feedback to the implementation stage since traceability between artifacts is not well-defined. Thanks to the application of operationalized measures and the traceability among the models that define the Web application, it is not only possible to 203
Instantiation of the Web Usability Evaluation Process provide a list of usability problems based on a measure’s rating levels, but it is also possible to provide guidance concerning the origin of the usability problem and to offer recommendations (even automatically in some cases) to facilitate its prevention and/or correction. This therefore coves another issue found in the systematic mapping study: the lack of usability evaluation methods to provide explicit feedback to Web developers. Furthermore, we observed the existence of measures whose automation may be made possible by means of constraint languages such as OCL (e.g., navigational breadth and navigational depth), or even by means of XML parsers for measures related to the presentation modeling primitives that are defined in XML templates (e.g., color contrast and misfit elements). Although one of the aims of applying measures was to reduce the subjectivity inherent to existing usability inspection methods, not all the measures can be calculated automatically, especially those that require interpretation by the evaluator (e.g., meaningful links or meaningful messages). Another issue detected was that the usefulness of WUEP is not only in the usability evaluation, but also in generating a reusable knowledge since the measure operationalization is a reusable asset in the evaluation of different Web applications that have been developed using the same model-driven Web development method. Finally, we also observed that some usability attributes are automatically supported by the Web development method (e.g., the consistency in the order of links or the alternative text support in the OO-H method). This highlights the usefulness of WUEP in discovering limitations in the expressiveness of platform independent models or transformation rules belonging to that particular development method (i.e., models could incorporate modeling primitives to ensure certain usability attributes during modeling stages). For instance, including a modeling primitive in order to group various labels in an abstract presentation model to ensure the information grouping cohesiveness (see attribute 1.2.1), or including code generation rules to provide the Web application with the capacity to support internal search (see attribute 1.6.1) or support the controls for a text magnifier (see attribute 5.1).
6.4 Conclusions This chapter has presented the instantiation of WUEP in two different modeldriven Web development process: OO-H and WebML. The aim was to show the feasibility of integrating usability evaluations at several stages of these Web development processes. 204
6.4 Conclusions We conducted two case studies: the usability evaluation of the TaskManager Web application developed by using OO-H, and the usability evaluation of the ACME store developed by using WebML. In both studies, we performed the same steps proposed in WUEP in order to detect usability problems. The experience obtained during these instantiations allowed us to learn various lessons. As positive aspects we can point out that:
It is possible to detect several usability problems during the early stages of a model-driven Web development process, thus allowing usability to be considered throughout the entire Web development process. Traceability among models allows us to detect usability problems and to offer recommendations in order to correct them. The operationalization of metrics allows WUEP to be applied not only in different model-driven Web development processes but also in traditional Web development processes. It is possible to discover limitations of the expressiveness of platformindependent models and the transformation rules in order to support usability attributes.
However, we also detected aspects that need to be improved:
The manual application of measures may, in some cases, be a tedious task. This can be alleviated by developing a tool to support not only the measure calculations, but also the management of usability evaluations plans. Although the aim of WUEP is also to reduce the subjectivity inherent to existing usability inspection methods, some measures have a certain degree of subjectivity. This can be alleviated by providing more guidelines in order to reduce the variation of the values obtained. Although usability evaluations do not need the operationalization of all the measures and these operationalized measures can be reused in further evaluations, we detected that the operationalization of measures is the most complex task of the evaluation design. This can be alleviated by anticipating a repository of already operationalized measures.
The following chapter is devoted to empirically validating our proposal when WUEP was applied in both model-driven Web development methods.
205
PART V Empirical Validation
Chapter 7 7 Empirical validation of the Web Usability Evaluation Process This chapter presents the empirical validation of the Web Usability Evaluation Process as logical consequence after providing the definition of WUEP (theoretical contribution) and its employment when it is instantiate in modeldriven Web development process (practical contribution). This chapter is structured as follows: Section 7.1 provides a background about empirical validations of usability inspection methods. Section 7.2 presents the Heuristic Evaluation method as a method to compare our proposal. Section 7.3 presents a family of experiments with WUEP instantiated in the OO-H method, which was performed in order to assess the actual and perceived performance of WUEP in practice. Section 7.4 presents the results of two controlled experiments with WUEP instantiated in the WebML method, which was also performed in order to assess the actual and perceived performance of WUEP.
209
Empirical validation of the Web Usability Evaluation Process
7.1 Empirical validations of usability inspection methods Since the late 1980s, usability inspection methods have emerged as a costeffective alternative to empirical methods for identifying usability problems (Cockton et al. 2003). In this context, several inspection methods (e.g., Heuristic Evaluation, Cognitive Walkthrough) were proposed by usability experts from the Human-Computer Interaction (HCI) field. Since the term “Web Engineering” was first published in 1997 (Gellersen et al. 1997), these existing HCI methods have been adapted and improved in order to be applied to Web applications, and other new usability evaluation methods specifically crafted for the Web domain have also appeared. In this section, we discuss related works that report on empirical validations and comparisons of usability inspection methods for Web applications. 7.1.1 Empirical Studies for Traditional Web Development Several empirical studies with which to validate the performance of usability inspection methods have been reported. These studies can be classified in two types according to their aim: a) empirical studies that were intended to perform comparative studies involving well-known usability inspection methods in order to guide researchers and practitioners, and b) empirical studies that were intended to empirically validate a specific usability inspection method which had been specifically proposed for the Web domain. The following representative examples of comparative studies involving wellknown usability inspection methods should be highlighted:
210
Hvannberg et al. (2007) reported an experiment in which two usability inspection methods were compared: Heuristic Evaluation and Gerhardt-Powals Principles. A within-subjects experimental design was applied to evaluate the usability of a Web portal. The study found that there were no significant differences between both methods as regards their effectiveness and efficiency in the specified context. Koutsabasis et al. (2007) reported a case study in which the effectiveness of four usability evaluation methods was compared. Participants were divided into 9 groups, of which 3 and 2 groups of participants applied the Heuristic Evaluation and Cognitive Walkthrough inspection methods, respectively, and 3 and 1 groups of participants applied two empirical methods: Think-aloud protocol and Co-discovery Learning, respectively. The Co-discovery Learning method was found to be slightly more effective than the others.
7.1 Empirical validations of usability inspection methods
Ssemugabi and De Villiers (2007) reported a case study whose aim was to investigate the extent to which Heuristic Evaluation identifies usability problems in a Web-based learning application by comparing the results with those of Survey Evaluations among end-users. The Heuristic Evaluation performed by four expert evaluators proved to be an appropriate and effective usability evaluation method for e-learning applications. Tan and Bishu (2009) reported an experiment in which Heuristic Evaluation was compared to User Testing. Although Heuristic Evaluation was able to identify more usability problems, there were no significant conclusions regarding the effectiveness and efficiency of both methods since they aimed to evaluate different aspects of the Web application.
Most of the aforementioned empirical studies presented comparisons between usability inspection methods and empirical methods. It is important to highlight that these kinds of comparisons are useful for practitioners in that they provide guidance in the selection of proper usability evaluation methods in a specific context. However, we argue that usability inspection methods should be compared to other usability inspection methods since empirical methods tend to evaluate usability aspects discovered during user interaction rather than usability aspects discovered in Web artifacts. The following representative examples of empirical validations of a specific usability inspection method which had been specifically proposed for the Web domain should be highlighted:
Costabile and Matera (2001) presented the empirical validation of the Systematic Usability Evaluation (SUE) method which employed operational guidelines called Abstract Tasks. Two experiments involving 26 and 20 novice evaluators, respectively, were conducted. The first experiment confirmed that the SUE method enhanced the effectiveness and efficiency of the usability evaluation, along with the evaluators’ satisfaction. The second experiment aimed to predict the number of evaluators needed to achieve a certain percentage of usability problems detected. Chattratichart and Brodie (2004) presented the empirical validation of the Heuristic Evaluation Plus method (HE-Plus), which is an extended version of the Heuristic Evaluation (HE) (Nielsen 1994). The experiment consisted of two groups containing five participants each, which were randomly assigned to the two methods. The results showed that HE-Plus was more effective than HE. 211
Empirical validation of the Web Usability Evaluation Process
Hornbæk and Frøkjær (2004) presented the empirical validation of the Metaphor of Human-Thinking method (MOT). The experiment compared the proposed method with the Cognitive Walkthrough method. Evaluators applied both methods in a different order. The results showed that the participants were more effective in the detection of usability problems when using MOT. In addition, it achieved a broader coverage in the type of usability problems detected. Blackmon et al. (2005) presented the empirical validation of the Cognitive Walkthrough for the Web method (CWW). The experiment showed that CWW was more effective than the Cognitive Walkthrough method on which it is based, and it also considered CWW to be an effective inspection method with which to repair usability problems related to unfamiliar and confusable links. Conte et al. (2009) presented the empirical validation of the Web Design Perspectives method (WDP), which defines a set of heuristics by considering four different perspectives of a Web application: conceptual, structural, navigation and presentation. Two experiments that pursued different goals were performed in order to refine the approach. The results of the first experiment showed that WDP was a feasible method with which to detect usability problems, whereas the second experiment showed that WPD was more effective when it was compared to the Nielsen’s Heuristic Evaluation. Malak and Sahraoui (2010) presented the definition and empirical validation of a probabilistic approach for building Web quality models in order to manage uncertainty and subjectivity, which are inherent to quality evaluation. This approach was instantiated to evaluate the navigability of Web applications, which is considered to be a relevant sub-characteristic of usability (Leavit and Shneiderman 2006). The results of an experiment conducted showed that the scores given by the proposed model are strongly correlated with navigability as perceived by the user.
Although the aforementioned empirical studies present the empirical validation of usability inspection methods, the majority of them tend to present isolated empirical studies with no replications in order to support a meta-analysis aimed at aggregating empirical evidences from individual studies. This fact was also evidenced in a systematic review on the effectiveness of Web usability evaluation methods performed in Chapter 2. Also despite there are some empirical studies such as the ones by Hornbæk (2006) and Hornbæk and Law (2007), in which a meta-analysis of usability measures is presented, these 212
7.1 Empirical validations of usability inspection methods studies are aimed at evaluating the usability of a user interface (i.e., usability experienced by interacting with a software product) rather than the usability of the evaluation method itself (i.e., usability experienced by an usability evaluator during the employment of the evaluation method). Nevertheless, these studies evidence the importance of understanding the relation between usability metrics in order to select the right metrics for usability studies. In addition, most of the empirical studies comparing usability inspection methods only consider objective variables related to the methods employment (mainly their effectiveness). Although objective dependent variables such as effectiveness and efficiency are relevant, subjective dependent variables related to the evaluator’s perceptions should also be considered since they likewise contribute to the acceptance of the usability inspection method in practice. 7.1.2 Empirical Studies for Model-driven Web Development Studies such as that of Juristo et al. (2007) claim that usability evaluations should also be performed during the early stages of the Web development process in order to improve the user experience and decrease the maintenance costs. We argue that model-driven Web development processes provide an appropriate context in which to conduct early usability evaluations, since models which are applied at all stages can be evaluated throughout the entire Web development process. Despite the fact that several model-driven Web development processes have been proposed since the late 2000s, and they are still evolving (Valderas and Pelechano 2011), few works address usability evaluations in model-driven Web development (as previously presented in Chapter 4). There are consequently few studies that present empirical studies in this context. Some examples are Abrahão et al. (2007) and Panach et al. (2008). Abrahão et al. (2007) present an empirical study which evaluates the user interfaces that were generated automatically by a model-driven development tool. This study applies two usability evaluation methods: an inspection method called Action Analysis (Olson and Olson 1990) and an empirical method called User Testing. The aim was to compare what types of usability problems are detected in the user interfaces and what their implications are for transformations rules and platform-independent models. However, the usability evaluation methods employed were not adapted to be applied in Web artifacts and no dependent variables were defined in order to compare the performance of both methods. Panach et al. (2008) extended the usability model proposed in Abrahão and Insfran (2006), which decomposes usability into measurable attributes that are applied to software products obtained as result of a model-driven development 213
Empirical validation of the Web Usability Evaluation Process process. The aim was to provide metrics with which to evaluate the understandability of Web applications (i.e., a usability sub-characteristic) and to aggregate the values obtained in order to provide attribute indexes. These indexes were compared to the perception of these same attributes by end-users. However, the empirical validation was based on correlations between metric calculation and attribute perception. Moreover, it did not consider any performance measure of method usage. As indicated by Hornbæk [2010], for assessing the quality of usability evaluation methods, not only the counting of usability problems detected should be considered but also the evaluators’ observations and satisfaction with the methods under evaluation. 7.1.3 Discussion The analysis of the aforementioned studies has allowed us to detect some limitations in the empirical validation of usability inspection methods such as: 1) the low number of empirical studies, particularly in the context of modeldriven Web development; 2) the lack of frameworks and standard criteria for the comparison of usability evaluation methods; and 3) the fact that the majority of empirical validations tend to be isolated and not replicated. The first limitation is in line with the results of our systematic mapping study, which revealed that only 44% of Web usability studies have reported empirical validations of the proposed and/or employed usability evaluation methods (see Chapter 2). This study showed that experiments were one of the most frequently employed types of empirical methods used for validation purposes since they provide a high level of control and are useful for comparing usability evaluation methods in a more rigorous manner. However, the majority of these experiments involved usability inspection methods that are oriented towards traditional Web development processes, and usability evaluations therefore principally took place in the later stages of the Web development process. The second limitation is in line with studies such as that of Gray and Salzman (1998) in which it is claimed that most of the experiments based on comparisons of usability evaluation methods do not clearly identify which aspects of these methods are being compared. This issue was also detected by Hartson (2003), in which several studies were analyzed in order to determine which measures had been used in the validation of usability evaluation methods. The majority of these studies evaluated the effectiveness of usability evaluation methods using the thoroughness metric (i.e., the ratio between the number of real usability problems found and the number of total real usability problems). This study also claimed that the majority of these comparative 214
7.2 Methods involved in our empirical validation studies did not provide the descriptive statistics needed to perform a metaanalysis of the empirical findings extracted from different sources. The third limitation is in line with studies that have been performed in the Software Engineering field, such as that of Sjøberg et al. (2005). This work claims that only 20 out of 113 controlled experiments are replications. A replication is the repetition of an experiment to confirm findings or to ensure accuracy. There are two types of replications: close replications also known as strict replications (i.e., replications that attempt to keep almost all the known experimental conditions much the same or at least very similar) and differentiated replications (i.e., replications that introduce variations in essential aspects of the experimental conditions, such as executions of replications with different kinds of participants) (Lindsay and Ehrenberg 1993). Both types of replications are necessary to achieve greater validity in the results obtained through empirical studies. Dealing with experimental replications has been addressed by the concept of the family of experiments. Although many empirical studies of this type have been applied in the Software Engineering field (e.g., Cruz-Lemus et al. 2011; Abrahão et al. 2011), few families of experiment have been reported in the Web Engineering field (e.g., Abrahão and Poels 2009). Another issue also appears which is specific to the Web Engineering field: the majority of empirical studies cannot be considered to be methodologically rigorous regarding their preparation (e.g., research questions, experiment design) and analysis (e.g., appropriate measurements, rationale of claims). This statement was drawn from a systematic review presented by Mendes (2005) which was performed to determine the rigor of claims of Web Engineering research. A set of empirical papers were classified according to some criteria such as whether they were designed correctly, they were based on a toy or real situation, etc.. This review demonstrated that only 5% should be considered as rigorous. It also found that numerous Web Engineering papers used incorrect terminology (e.g., they used the term experiment rather than experience report or the term case study rather than proof of concept).
7.2 Methods involved in our empirical validation The methods evaluated through the family of experiments were two inspection methods: our proposal (WUEP) and the Heuristic Evaluation (HE) proposed by Nielsen (1994). The entire description of WUEP was presented in Chapter 5, whereas an overview of the Heuristic Evaluation is presented as follows. The Heuristic Evaluation (HE) method requires a group of evaluators to examine Web artifacts (commonly user interfaces) in compliance with 215
Empirical validation of the Web Usability Evaluation Process commonly-accepted usability principles called heuristics. HE proposes ten heuristics that are intended to cover the best practices in the design of any user interface. (e.g., minimize the user workload, error prevention, recognition rather than recall). In order to facilitate both the method application and the method comparison, we have structured the method in the same main stages provided by WUEP. Figure 7.1 shows an overview of these stages in which three roles are also involved: evaluation designer, evaluation executor and Web developer. The evaluation designer performs the first three stages: 1) Establishing the requirements of the evaluation; 2) Specification of the evaluation; and 3) Design of the evaluation. The evaluator performs the fourth stage: 4) Execution of the evaluation, and the Web developer performs the last stage: 5) Analysis of changes. A brief description of each stage is provided as follows: 1. In the establishment of the evaluation requirements stage, the scope of the evaluation is defined by: a) establishing the purpose of the evaluation; b) specifying the evaluation profiles (type of Web application, Web development method employed, context of use); and c) selecting the Web artifacts to be evaluated. 2. In the specification of the evaluation stage, the ten heuristics are described in detail by providing guidelines about which elements from the selected artifacts can be affected by each heuristic. 3. In the design of the evaluation stage, the template for usability reports is defined (e.g., structured reports or verbalized finding), and the evaluation plan is elaborated (e.g., number of evaluators, mechanisms to aggregate results, evaluation restrictions). 4. In the execution of the evaluation stage, the evaluator applies the heuristics to the selected artifacts (when its expressiveness allows the heuristic to be applicable) in order to detect usability problems. 5. In the analysis of changes stage, all the usability problems detected are analyzed in order to propose changes with which to correct the affected artifacts.
216
7.2 Methods involved in our empirical validation
Figure 7.1. Overview of the Heuristic Evaluation process
The rationale for selecting HE as the method used to compare our proposal is based on the following statements:
WUEP should be compared with other inspection method since these methods allow us to evaluate Web artifacts that are produced during the early stages of the Web development process. Empirical methods which involve the participation of real users and are often used after development to assess a design are therefore discarded (e.g., User Testing or End-user Questionnaires). In this work, we are thus interested in comparing WUEP against other method that can be applied to obtain formative evaluations (i.e., evaluations carried out during development to improve a design). HE is one of the best-known inspection methods. This allows us to gather more accuracy information about its employment (Hollingsed and Novick 2007). HE is one of the most widely-used evaluation methods in industry. For instance, half of the ten Web intranets that won a 2005 competition used this method (Nielsen 2005). HE covers a broader range of usability aspects than other inspection methods such as, for instance, Cognitive Walkthroughs, whose usability definition is more focused on ease of navigation. HE has provided useful results when used to conduct Web usability evaluations (Sutcliffe 2002; Allen et al. 2006; Ssemugabi and De Villiers 2007). HE has often been used for comparison with other inspection methods (Costabile and Matera 2001; Chattratichart and Brodie 2004; Conte et al. 2009). 217
Empirical validation of the Web Usability Evaluation Process
No usability evaluation method has been previously defined to be applied in model-driven Web development processes. Since there is currently no standard inspection method for conducting Web usability evaluations, we cannot evaluate WUEP against a control method.
7.3 Assessing the actual and perceived performance of WUEP in practice: a family of experiments with OO-H An increasing understanding exists that empirical studies are needed to create, improve, or assess processes, methods, and tools for software development (Basili et al. 1986; Basili 1996; Fenton 1993), maintenance (Colosimo et al. 2009; Dzidek et al. 2008), and quality evaluation (Bolchini and Garzotto 2007). An empirical study is generally an act or operation by which to discover something that is unknown, or to test hypotheses (Basili 1993). Research strategies include controlled experiments, qualitative studies, surveys, and archival analyses (Juristo and Moreno 2001; Wohlin et al. 2000). However, replications of these studies are necessary if their results are to achieve greater validity (Shull et al. 2008; Kitchenham 2008). In this respect, the “family of experiments” as an empirical research methodology has arisen with the aim of extracting significant conclusions from multiple similar experiments that pursue the same goal. 7.3.1 The family of experiments In this section, we present the family of experiments that we performed to empirically validate WUEP. This empirical study is also intended to contribute to Software Engineering research through proposing a well-defined framework that can be reused by other researchers in the empirical validation of their usability evaluation methods. The research methodology adopted is an extension of the five-steps proposed by Ciolkowski et al. (2002), in which the fifth step, “Family data analysis”, has been replaced with “Family data analysis and meta-analysis”, and it was guided by the experimental process of Wohlin et al. (2000). 7.3.1.1 Step 1: Experiment Preparation The experiment was prepared by carrying out the following steps: 1) the establishment of the goal of the family of experiments; 2) the selection of variables; 3) the formulation of hypotheses; and 4) the experimental design, which all the individual experiments have in common. These issues are described in the following subsections. 218
7.3 Assessing the actual and perceived performance of WUEP in practice: a family of experiments with OO-H 1. Goal of the family of experiments. According to the Goal-QuestionMetric (GQM) paradigm (Basili and Rombach 1988), the goal of our family of experiments is to analyze the Web Usability Evaluation Process (WUEP) in order to evaluate it with regard to its effectiveness, efficiency, perceived ease of use, and perceived satisfaction in comparison to the Heuristic Evaluation (HE) from the viewpoint of a set of usability inspectors. This experimental goal will also allow us to show the feasibility of our approach when it is applied to Web artifacts from a model-driven Web development process, in addition to detecting issues that can be improved in future versions of WUEP. 2. Independent and Dependent Variables. There are two independent variables in the family of experiments:
The evaluation method, with nominal values: WUEP and HE. The experimental objects (collection of Web artifacts) to which both methods are applied, with nominal values: O1 and O2. A detailed description of these experimental objects is provided in Section 7.3.1.2.
There are two objective dependent variables, which were selected by considering works such as Hartson et al. (2003) and Gray and Salzman (1998):
Effectiveness, which is calculated as the ratio between the number of usability problems detected and the total number of existing (known) usability problems. We consider one usability problem as one defect that can be found in different artifacts independently of its severity level and its total number of occurrences. Efficiency, which is calculated as the ratio between the number of usability problems detected and the total time spent on the inspection process.
The measurement of these variables involves several issues. Since the experimental objects have been extracted from a real Web application, it is not possible to anticipate all the existing problems in the artifacts to be evaluated. For this reason, a control group (formed of two independent evaluators who are experts in usability evaluations and one of the authors of this paper) was created in order to provide a baseline of usability problems by applying an Expert Evaluation as ad-hoc inspection method based on their own expertise. Since this baseline may be biased by the evaluator’s expertise, we only considered this baseline as an initial set of usability problems which could evolve by adding the new usability problems detected by the participants. For this reason, this control group was also responsible to determine whether the usability problems reported by the participants in each experiment were false positives (no real usability problems), whether the usability problem has already 219
Empirical validation of the Web Usability Evaluation Process been detected by a participant in the whole experimental object (replicated problems), or whether there are new usability problems that need to be added to the baseline (increasing the total number of existing usability problems). Disagreements among control group members were resolved by consensus. There are also two subjective dependent variables, which were based on constructs from the Technology Acceptance Model (TAM) (Davis 1989) since TAM is one of the most widely applied theoretical model to study user acceptance and usage behavior of emerging information technologies, and it has received extensive empirical support through validations and replications (Venkatesh 2000):
Perceived Ease of Use, which refers to the degree to which evaluators believe that learning and using a particular evaluation method will be effort-free. Perceived Satisfaction of Use, which refers to the degree to which evaluators believe that the employment of a particular evaluation method can help them to achieve specific abilities and professional goals.
Both variables are measured using a set of 8 closed-questions: 5 questions with which to measure Perceived Ease of Use (PEU), and 3 questions with which to measure Perceived Satisfaction of Use (PSU). The closed-questions were formulated by using a 5-point Likert scale, using the opposing statement question format. In other words, each question contains two opposite statements which represent the maximum and minimum possible values (5 and 1), in which the value 3 is considered to be a neutral perception. Each subjective dependent variable was quantified by calculating the arithmetical mean of its closed-question values. Table 7.1 presents the questions associated with each subjective dependent variable. Table 7.1. Closed-questions to evaluate both subjective dependent variables Questions PEU1
Positive statement (5 points) The application procedure of the method is simple and easy to follow.
PEU2
I have found the evaluation method easy to learn. In general terms, the evaluation method is easy to use. The proposed metrics/heuristics are clear and easy to understand. It was easy to apply the evaluation method to the Web artifacts.
PEU3 PEU4 PEU5
220
Negative Statement (1 point) The application procedure of the method is complex and difficult to follow. I have found the evaluation method difficult to learn. In general terms, the evaluation method is difficult to use. The proposed metrics/heuristics are confusing and difficult to understand. It was difficult to apply the evaluation method to the Web artifacts.
7.3 Assessing the actual and perceived performance of WUEP in practice: a family of experiments with OO-H Questions PSU1
PSU2
PSU3
Positive statement (5 points) In general terms, I believe the evaluation method provides an effective manner with which to detect usability problems. The employment of the evaluation method would improve my performance in Web usability evaluations. I believe that it would be easy to be skillful in the use of the evaluation method.
Negative Statement (1 point) In general terms, I believe the evaluation method provides an ineffective manner with which to detect usability problems. The employment of the evaluation method would not improve my performance in Web usability evaluations. I believe that it would be difficult to be skillful in the use of the evaluation method.
It is important to note that both objective and subjective variables are related to the employment of Web usability evaluation methods, not the usability evaluation of a Web application by involving end-users. 3. Hypotheses. We formulated the following null hypotheses, which are onesided since we expected WUEP to be superior to HE for each dependent variable. Each null hypothesis and its alternative hypothesis are presented as follows:
H10: There is no significant difference between the effectiveness of WUEP and HE. H1a: WUEP is significantly more effective than HE. H20: There is no significant difference between the efficiency of WUEP and HE. H2a: WUEP is significantly more efficient than HE. H30: There is no significant difference between the perceived ease of use of WUEP and HE. H3a: WUEP is perceived to be significantly easier to use than HE. H40: There is no significant difference between the perceived satisfaction of employing WUEP and HE. H4a: WUEP is perceived to be significantly more satisfactory to use than HE.
4. Experimental Design. The experiment was planned as a balanced withinsubject design with a confounding effect, signifying that the same number of participants used both methods in a different order and with different experimental objects. Table 7.2 shows the schema of the experimental design 221
Empirical validation of the Web Usability Evaluation Process which has been used in all the individual experiments. Although this experimental design was intended to minimize the impact of learning effects on the results, since none of the participants repeated any of the methods in the same experimental object, other factors were also present that needed to be controlled since they may have influenced the results. These factors were:
Complexity of experimental objects, since the comprehension of the modeling primitives from Web artifacts may have affected the application of both inspection methods. We attempted to alleviate the influence of this factor by selecting representative Web artifacts that were considered suitable, in both size and complexity, for application in the time available for the execution of the experiment, and also by providing a complete description of the Web artifacts to be evaluated (graphical and textual). Order of experimental objects and methods, since this may have caused learning effects, thus biasing results. We attempted to check the influence of this factor by applying proper statistical tests. Table 7.2. Experimental design schema
1st Session 2nd Session
G1(n subjects) WUEP applied in O1 HE applied in O2
Groups (Sample size: 4n subjects) G2 (n subjects) G3(n subjects) WUEP applied HE applied in in O2 O1 HE applied in WUEP applied O1 in O2
G4 (n subjects) HE applied in O2 WUEP applied in O1
7.3.1.2 Step 2: Context Definition The context was determined by a) the Web application to be evaluated; b) the usability evaluation methods to be applied; and c) the subject selection. These are described in the following subsections. a) Web Application Evaluated. We contacted a Web development company located in Alicante (Spain) in order to obtain Web artifacts from a real Web application. This Web application was developed through the use of a modeldriven Web development method called the Object-Oriented Hypermedia (OO-H) (Gómez et al. 2000) which is supported by the VisualWade tool . OO-H provides the semantics and notation needed to develop Web applications. The platform-independent models (PIMs) that represent the different concerns of a Web application are: a class model, a navigational model, and a presentation model. The Class Model is UML-based and specifies the content requirements; the navigational model is composed of a set of Navigational Access Diagrams (NADs) that specify the functional 222
7.3 Assessing the actual and perceived performance of WUEP in practice: a family of experiments with OO-H requirements in terms of navigational needs and users’ actions; and the presentation model is composed of a set of Abstract Presentation Diagrams (APDs), whose initial version is obtained by merging the Class Model and NADs, which are then refined in order to represent the visual properties of the final UI. The platform-specific models (PSMs) are embedded in a model compiler, which automatically obtains the source code (CM) from the Web application by taking all the previously mentioned platform-independent models as input. The type of the provided Web application was an intranet for task management to be used in the context of a software development company. More information of this Web application can be found in Section 6.1.3, since it is the same Web application which we employed to perform the instantiation of WUEP in OO-H. Two different functional features (Task management and Report management) were selected for the composition of the experimental objects (O1 and O2), as Table 7.3 shows in detail. We selected these functional features because they are relevant to the Web users. These functional features are also similar in complexity, and their related Web artifacts are also similar in size. Each experimental object contains three Web artifacts: a Navigational Access Diagram (NAD), an Abstract Presentation Diagram (APD) model, and a Final User Interface (FUI). Table 7.3. Experimental objects Experimental Object O1
User
Use Cases
Project Manager
Functional Feature Task Management
O2
Software Programmer
Report Management
Create daily reports, Access to partner reports, etc.
Create/Modify/ Delete tasks, Categorize tasks, etc.
Web Artifacts to be evaluated 1 Navigational Access Diagram (NAD1) 1 Abstract Presentation Diagram (APD1) 1 Final User Interface (FUI1) 1 Navigational Access Diagram (NAD2) 1 Abstract Presentation Diagram (APD2) 1 Final User Interface (FUI2)
b) Inspection Methods Evaluated. Since the context of our family of experiments was from the viewpoint of a set of usability inspectors, we evaluated the execution stages of both methods (WUEP and HE), or in other 223
Empirical validation of the Web Usability Evaluation Process words, the evaluators’ application of both methods. Two of the authors therefore performed the evaluation designer role in both methods in order to design an evaluation plan. In critical activities such as the selection of usability attributes in WUEP, we required the help of two external Web usability experts. The outcomes of the stages performed by the evaluation designers are described as follows. With regard to the establishment of the evaluation requirements stage, the first three activities (i.e., purpose of the evaluation, evaluation profiles, and selection of Web artifacts) were the same for both methods. In the case of the HE, all 10 heuristics were selected. In the case of the WUEP, a set of 20 usability attributes were selected as candidates from the Web Usability Model through the consensus reached by the two evaluator designers and the two Web usability experts. The attributes were selected by considering the evaluation profiles (i.e., which of them would be more relevant to the type of Web application and the context in which it is going to be used). Only 12 out of 20 attributes were randomly selected in order to maintain a balance in the number of metrics and heuristics to be applied. With regard to the specification of the evaluation stage, the 10 heuristics from the HE were described in detail by providing guidelines concerning which elements can be considered in the Web artifacts to be evaluated. Examples of these heuristics can be found in Appendix C.1. In the case of the WUEP, 13 metrics associated with the 12 selected attributes were obtained from the Web Usability Model, and then associated with the artifact in which they could be applied. Since metrics can be applied at different abstraction levels, the highest level of application was selected. Once the metrics had been associated with the artifacts, these metrics were operationalized in order to provide a calculation formula for artifacts from the OO-H method and to establish rating levels for them. Examples of these operationalized metrics can be found in Chapter 6 and in Appendix C.1. With regard to the design of the evaluation stage, the same evaluation plan (i.e., the experiment design), along with the same template with which to report usability problems, were defined for both methods. The templates employed for both inspection methods can be found in Appendix C.4. c) Subject selection. Although expert evaluators are able to detect more usability problems than novice evaluators (Hertzum and Jacobsen 2001), we focus on this latter evaluator profile since the intention is to provide a Web usability evaluation method which enables inexperienced evaluators to perform their own usability evaluations. Therefore, the following groups of subjects were identified in order to facilitate the generalization of results: 224
7.3 Assessing the actual and perceived performance of WUEP in practice: a family of experiments with OO-H
Master’s students, all of whom had previously obtained a degree in Computer Science. At the moment of each experiment, they were attending a “Quality of Web Information Systems” course on the Masters in Software Engineering course at the Universitat Politècnica de València. It has been shown that, under certain conditions, there is no great difference between this type of students and professionals (Basili et al. 1999; Höst et al. 2000), and they could therefore be considered as the next generation of professionals (Kitchenham et al. 2002). We therefore believe that their ability to understand Web artifacts obtained with model-driven Web development processes, and to apply usability evaluation methods to them, can be comparable to that of typical novice practitioners. With regard to their participation, all the Master’s students were given one point in their final grades, regardless of their performances. PhD students, all of whom had previously obtained a degree in Computer Science and whose research activities are performed in the Software Engineering field. At the moment of each experiment, they were participants in the PhD Doctorate Program in Computer Science at the Universitat Politècnica de València. The participation of these PhD students in the experiments was voluntary.
We did not establish a classification of participants, since neither the Master’s nor the PhD students had any previous experience in conducting usability evaluation studies. The assignation of the participants to the experimental groups was therefore random. Regarding the number of evaluators required for conducting usability studies, some previous studies (Hwang and Salvendy 2010) claim that 10±2 evaluators are needed to perform a usability evaluation to find around 80% of usability problems. However, recent studies such as Schmettow (2012) refute the idea of an existing magic number of inspectors for usability evaluations in order to detect a certain percentage of usability problems. For this reason, we did not establish any number of evaluators per experiment, but we tried to enroll the maximum possible participants in each individual experiment in order to detect a representative number of usability problems. 7.3.1.3 Step 3: Experimental Tasks and Materials The material was composed of the documents needed to support the experimental tasks and the training material. The documents used to support the experimental tasks were:
225
Empirical validation of the Web Usability Evaluation Process
Four kinds of data gathering documents in order to cover the four possible combinations (WUEP-O1, WUEP-O2, HE-O1, and HE-O2). Each document contained: the set of Web artifacts from the experimental object with a description of their modeling primitives; and the description of the tasks to be performed in these artifacts (an example of these tasks for both usability inspection methods can be found in Appendix C). Although only three artifacts were evaluated (NAD, APD, and FUI), we also included a Class Diagram in order to provide a better understanding of the Web application’s structure and content. Two appendixes containing a detailed explanation of each evaluation method (WUEP and HE) appear at the end of this paper. Two questionnaires (one for each method), which contained the closed-questions presented in Section 7.3.1.1 with which to evaluate the two subjective dependent variables (i.e., Perceived ease of use and Perceived satisfaction). Various questions belonging to the same dependent variable (i.e., construct group) were randomized to prevent systemic response bias. In addition, in order to ensure the balance of items in the questionnaire, half of the questions on the left-hand side were written as negative sentences to avoid monotonous responses (Hu and Chau 1999). We also added two open-questions in order to obtain feedback on how to improve the ease of use and the employment of both methods. These open-questions were formulated as follows: o Q1: What suggestions would you make in order to improve the method’s ease of use? o Q2: What suggestions would you make in order to make the metrics/heuristics more useful in the context of Web usability evaluations?
The training materials included: i) a set of slides containing an introduction to the Object-Oriented Hypermedia method in order to present the modeling primitives of Web artifacts; (ii) a set of slides describing the WUEP method, with examples of metric application and the procedure to be followed in the experiments; and (iii) a set of slides describing the HE method with examples of heuristic application and the procedure to be followed in the experiments. All the documents were created in Spanish, since this was the participants’ native language. All the material (including the experimental tasks and the training slides) is available for download at http://www.dsic.upv.es/ ~afernandez/ thesis/ instrumentation.html. 226
7.3 Assessing the actual and perceived performance of WUEP in practice: a family of experiments with OO-H 7.3.1.4 Step 4: Individual Experiments Figure 7.2 summarizes the family of experiments by representing each individual experiment as a rectangle. This figure shows the order in which the experiments were executed (e.g., 1st experiment), the kind of participants involved and their number, the name associated with each experiment (e.g., EXP), and the kind of replication (e.g., internal replication). It is important to note that the number of participants is according to the final accepted samples, since we discarded incomplete samples, in addition to random samples when it was necessary to maintain the balanced within-subject design (i.e., the same number of participants per group). The second and third experiments (REP1 and REP2) were differentiated replications of the original experiment (i.e., EXP) since they were performed in different settings. This means that we have made some controlled modifications in the experiment design (e.g., profile of participants, experiment schedule). In order to confirm the results obtained in REP1 we replicate this experiment (REP2) under the same conditions (strict replication), changing only the subjects (Basili et al. 1999). Strict replications are needed to increase confidence in the conclusion validity of the experiment.
Figure 7.2. Overview of the family of experiments
7.3.1.5 Step 5: Family Data Analysis and Meta-Analysis The results of each individual experiment and the family of experiments were collected and analyzed. With regard to the analysis of each individual experiment, we used boxplots and statistical tests to analyze the data collected. In particular, we tested the normality of the data distribution by applying the Shapiro-Wilk test. The results of the normality test allowed us to select the proper significance test in order to test our hypotheses. When data was assumed to be normally distributed (p-value ≥ 0.05), we applied the parametric one-tailed t-test for 227
Empirical validation of the Web Usability Evaluation Process independent samples (Juristo and Moreno 2001). However, when data could not be assumed to be normally distributed (p-value < 0.05), we applied the non-parametric Mann-Whitney test (Conover 1998). In order to test the influence of Order of Method and Order of Experimental Objects (both independent variables), we used a method similar to that proposed by Briand et al. (2005)]. We used the Diff function: Diffx = observationx(A) - observationx(B)
(1)
where x denotes a particular subject, and A,B are the two possible nominal values of an independent variable. We created Diff variables from each dependent variable (e.g., Effec_Diff(WUEP) represents the difference in effectiveness of the subjects who used WUEP first and HE second. On the other hand, Effec_Diff(HE) represents the difference in effectiveness of the subjects who used HE first and WUEP second. The aim was to verify that there were no significant differences between Diff functions since that would signify that there was no influence in the order of the independent variables. We also applied the Shapiro-Wilk test to prove the normality of the Diff functions. Table 7.4 presents the hypotheses related to the Diff functions, which are two-sided since we did not make any assumption about whether one specific order would be more influential than another. We verified these hypotheses by applying the parametric two-tailed t-test for independent samples or the non-parametric Mann-Whitney test depending on the results of the normality test. Table 7.4. Hypotheses for the influence in the order of independent variables Dependent variables Effectiveness
Efficiency
Perceived Ease of Use Perceived Satisfaction of Use
228
Order of Methods
Order of Experimental Objects
HM10: Effec_Diff(WUEP) = Effec_Diff(HE) HM1a: Effec_Diff(WUEP) ≠ Effec_Diff(HE) HM20: Effic_Diff(WUEP) = Effic_Diff(HE) HM2a: Effic_Diff(WUEP) ≠ Effic_Diff(HE) HM30: PEU_Diff(WUEP) = PEU_Diff(HE) HM3a: PEU_Diff(WUEP) ≠ PEU_Diff(HE) HM40: PSU_Diff(WUEP) = Effec_Diff(HE) HM4a: PSU_Diff(WUEP) ≠ Effec_Diff(HE)
HO10: Effec_Diff(O1) = Effec_Diff(O2) HO1a: Effec_Diff(O1) ≠ Effec_Diff(O2) HO20: Effic_Diff(O1) = Effic_Diff(O2) HO2a: Effic_Diff(O1) ≠ Effic_Diff(O2) HO30: PEU_Diff(O1) = PEU_Diff(O2) HO3a: PEU_Diff(O1) ≠ PEU_Diff(O2) HO40: PSU_Diff(O1) = PSU_Diff(O2) HO4a: PSU_Diff(O1) ≠ PSU_Diff(O2)
7.3 Assessing the actual and perceived performance of WUEP in practice: a family of experiments with OO-H These statistical tests have been chosen because they are very robust and sensitive, and have been used in experiments similar to ours in the past, e.g., (Ricca et al. 2010; Briand et al. 2005; Conte et al. 2009). As usual, in all the tests we decided to accept a probability of 5% of committing a Type-I-Error (Wohlin et al. 2000), i.e., of rejecting the null hypothesis when it is actually true. We also performed a meta-analysis in order to aggregate the results, since the experimental conditions were very similar for each experiment. This analysis, which is detailed in Section 7.3.4.2, enabled us to extract more general conclusions with regard to each individual experiment. 7.3.2 Design of individual experiments In this section, we describe the main characteristics of each of the three individual experiments that constitute our family of experiments. In order to avoid useless redundancies, we discuss some clarifications of the original experiment related to the information presented in the previous section, and we only discuss the differences in the replications with regard to the original experiment. 7.3.2.1 The Original Experiment (EXP) Planning. This section details the experimental plan by describing the context, the variables, hypotheses, experiment design, and instrumentation. The context of the experiment: we used both of the experimental objects described in Section 7.3.1.2 (O1 and O2), we evaluated the execution stages by providing an evaluation design as described in Section 7.3.1.2 (10 heuristics to be applied with the HE method and 13 metrics to be applied with the WUEP method), and we selected 12 PhD students as participants whose profile is described in Section 7.3.1.2 . The variables: we selected all the independent and dependent variables described in Section 7.3.1.1. The hypotheses: we tested all the hypotheses related to each dependent variable (Section 7.3.1.1) and all the hypotheses related to the influence of the order of methods and order of experimental objects (Section 7.3.1.5). The experimental design: we used the balanced within-subject design with a confounding effect, presented in Section 7.3.1.1. Three participants were randomly assigned to each of the four groups, since there was no difference in their experience in Web usability evaluations.
229
Empirical validation of the Web Usability Evaluation Process The instrumentation: we used the documents presented in Section 7.3.1.3 to support the experimental tasks (4 data gathering documents, 2 appendices and 2 questionnaires) and the training material (3 slide sets). Operation. This section details the experimental operation by describing the preparation, the execution, the data recording, and the data validation. With regard to the preparation of the experiment, the experiment was planned to be conducted in two days owing to the participants’ availability and the optimization of resources. Table 7.5 shows the planning for both days. The subjects were given a training session before each of the inspection methods was applied, in which they were also informed about the procedure to follow in the execution of the experiment. We established a time slot of 90 minutes as an approximation for each method application. However, we allowed the participants to continue the experiment even though these 90 minutes had passed in order to avoid a possible ceiling effect (Sjøberg et al. 2003). Table 7.5. Planning for the Original Experiment (EXP) 1st Day Id. Group Training (15+20 minutes) 1st Session (90 minutes) Training (20 minutes) 1st Session (90 minutes)
G3 (3 subjects)
2nd Day
G4 G1 (3 subjects) (3 subjects) OO-H Introduction
Training with HE
G2 (3 subjects)
Training with WUEP
HE in O1 HE in O2 WUEP in O1 WUEP in O2 Questionnaire for HE Questionnaire for WUEP Break (180 minutes) Training with WUEP WUEP in O1 WUEP in O2 Questionnaire for HE
Training with HE HE in O2 HE in O1 Questionnaire for WUEP
With regard to the execution of the experiment, the experiment took place in a single room and no interaction between participants was allowed. We logged all the interventions that were necessary to clarify questions concerning the completion of the experimental tasks, along with possible improvements that could be made to the experiment material. Finally, with regard to the data validation, we ensured that all the participants had completed all the requested data, and it was not therefore necessary to discard any samples. 7.3.2.2 The Second Experiment (REP1) This second experiment (first replication) was different in three respects as regards the original experiment. These differences are described as follows: 230
7.3 Assessing the actual and perceived performance of WUEP in practice: a family of experiments with OO-H
Subject selection. The participants were initially 38 Master’s students. The profile of these subjects is described in Section 4.2.3, and all of them attended the “Quality of Web Information Systems” course which took place from April 2010 to July 2010. This course was selected because the necessary preparation and training, and the experimental task itself, fitted the scope of this course well. We took a “convenience sample” (i.e., all the students available in the class). We created two groups of 10 participants, and two groups of 9 participants, despite the fact that it would later be necessary to discard samples in order to maintain a balanced design. Metrics selection. Since only 12 out of 20 usability attributes were randomly selected from the Web Usability Model in the original experiment, we made minimal variations in order to enable new attributes to be evaluated as long as the evaluation design was not altered. In particular, we replaced one usability attribute with another, and we also replaced a metric from an existing attribute with another metric. We therefore maintained the same number of metrics to be applied, which were 13. Questionnaire. Table 7.6 presents the two new closed-questions that were added in order to evaluate the Perceived Satisfaction of Use. The questionnaire therefore contained a total of 10 closed-questions. Table 7.6. New closed-questions added to the questionnaire
Questions PSU4 PSU5
Positive statement (5 points) I believe the evaluation method helps to improve my skills in Web usability evaluation. I am satisfied with the use of the evaluation method, to the point that I would recommend its use in the evaluation of Web applications
Negative Statement (1 point) I do not believe the evaluation method helps to improve my skills in Web usability evaluation. I am not satisfied with the use of the evaluation method, to the point that I would not recommend its use in the evaluation of Web applications
With regard to the experiment preparation, the experiment was planned to be conducted over three days owing to the course timetable and the optimization of resources. Table 7.7 shows the planning for these days. On the first day, the participants were given the complete training and they were also informed of the procedure to follow in the execution of the experiment. They were told that their answers would be treated anonymously, and were also informed that their grade for the course would not be affected by their performance in the experiment. On the second and third days, the participants were given an overview of the complete training before applying the evaluation method, since all the groups were located in the same session. As in the previous experiment, 231
Empirical validation of the Web Usability Evaluation Process we established a time slot of 90 minutes without a time limit for each method application. Table 7.7. Planning for the Second Experiment (REP1) G1 (9 subjects) 1st Day (60 minutes)
2nd Day (30 + 90 minutes)
3rd Day (30 + 90 minutes)
Groups G2 G3 (10 subjects) (10 subjects) OO-H Introduction Training with HE Training with WUEP
G4 (9 subjects)
OO-H Introduction Training with WUEP Training with HE WUEP in O1 WUEP in O2 HE in O1 HE in O2 Questionnaire for WUEP Questionnaire for HE OO-H Introduction Training with HE Training with WUEP HE in O2 HE in O1 WUEP in O2 WUEP in O1 Questionnaire for HE Questionnaire for WUEP
As in the original experiment, the experiment also took place in a single room and no interaction between participants was allowed. With regard to the data validation, we checked that all the participants had completed all the requested data. However, a total of 6 samples were discarded: 4 owing to incomplete data, and 2 of which were randomly discarded to maintain the same number of samples per group. The experiment eventually considered the results of only 32 evaluators (8 samples per group). 7.3.2.3 The Third Experiment (REP2) This third experiment (second replication) was a strict replication of REP1. The difference with regard to REP1 was the subject selection. The participants were initially 35 Master’s students (Section 7.3.1.2), all of whom attended the “Quality of Web Information Systems” course which took place from April 2011 to July 2011. We created three groups of 9 participants, and one group of 8 participants, despite the fact that it would later be necessary to discard samples in order to maintain a balanced design. With regard to experiment preparation and execution, there were no differences with regard to REP1 since the same three day planning was followed. With regard to the data validation, we checked that all the participants had completed all the requested data. However, a total of 15 232
7.3 Assessing the actual and perceived performance of WUEP in practice: a family of experiments with OO-H samples were discarded: 9 owing to incomplete data, and 6 of which were randomly discarded to maintain the same number of samples per group. The experiment eventually considered the results of only 20 evaluators (5 samples per group). 7.3.3 Results After the execution of each experiment, the control group analyzed all the usability problems detected by the subjects. If a usability problem was not in the initial list, this group determined whether it could be considered as a real usability problem or a false positive. Replicated problems were considered only once. Discrepancies in this analysis were solved by consensus. The control group determined a total of 13 and 14 usability problems in the experimental objects O1 and O2, respectively. In this section, we discuss the results of each individual experiment by quantitatively analyzing the results for each dependent variable and testing all the formulated hypotheses. We also analyze the influence of the order of methods and experimental objects. All the results were obtained by using the SPSS v16 statistical tool with a statistical significance level of α = 0.05. A qualitative analysis based on the feedback obtained from the open-questions in the questionnaire will also be provided. 7.3.3.1 Quantitative analysis Table 7.8 summarizes the overall results of the usability evaluations performed in each experiment. The cells in bold type indicate the subjects’ best performance in each statistic. The overall results obtained have allowed us to interpret that WUEP has achieved the subjects’ best performance in all the statistics that were analyzed. As observed in these results, WUEP tends to provide a low degree of false positives (detected usability problems which were considered as not real usability problems by the control group) and replicated problems (detected usability problems which have already been detected by a participant in the whole experimental object). The low degree of false positives can be explained by the fact that WUEP aims to minimize the subjectivity of the evaluation by providing a more systematic procedure (metrics) to detect usability problems rather than interpreting whether the usability principles have been supported or not (heuristics). The low degree of replicated problems can be explained by the fact that WUEP provides operationalized metrics which are specifically tailored for each type of artifact of the Web development process, reducing in this way the subjectivity associated to generic rules that relies on the experience of the evaluator. 233
Empirical validation of the Web Usability Evaluation Process Table 7.8. Overall Results of the Usability Evaluations Statistics Number of problems per subject False positives per subject Replicated problems per subject Duration (min) Effectiveness (%) Efficiency (Prob. / min) Perceived Ease of Use Perceived Satisfaction of Use
Method HE WUEP HE WUEP HE WUEP HE WUEP
EXP (N=12) Mean SD 4.25 1.40 7.00 2.21 2.08 2.15 0.00 0.00 1.41 0.79 0.00 0.00 61.83 14.43 44.16 13.53
REP1 (N=32) Mean SD 3.81 1.06 6.88 1.64 2.28 1.57 0.66 0.60 1.72 1.65 0.00 0.00 61.28 19.33 53.56 13.81
REP2 (N=20) Mean SD 3.30 1.22 7.05 1.47 2.50 1.76 0.40 0.60 2.25 1.48 0.10 0.31 63.50 10.89 53.50 15.17
HE WUEP HE WUEP HE WUEP HE WUEP
31.63 51.83 0.07 0.17 3.23 4.25 3.36 4.52
30.53 54.91 0.07 0.14 3.44 4.16 3.56 4.18
26.28 56.41 0.05 0.14 3.03 3.73 3.32 3.82
10.89 16.09 0.02 0.06 1.01 0.57 0.84 0.36
08.63 12.49 0.03 0.05 0.70 0.61 0.64 0.47
09.13 11.45 0.02 0.06 0.89 0.56 0.84 0.49
The analysis of each dependent variable (Effectiveness, Efficiency, Perceived Ease of Use, and Perceived Satisfaction of Use) and the hypotheses testing is detailed in the following subsections. Effectiveness. Figure 7.3 presents the boxplots containing the distribution of the Effectiveness variable per subject and per method for each of the individual experiments. These box plots show that WUEP was relatively more effective than HE when inspecting the usability of the experimental objects. Although we found the WUEP scores to be more scattered than those of HE (specifically in EXP and REP1), the median value for WUEP (between 50% and 60% of usability problems detected) was much higher than that for HE (between 20% and 40%). This may represent some variability in the participants’ performance when detecting usability problems. However, the middle 50 percent of WUEP scores is above the third quartile of HE in all the individual experiments.
234
7.3 Assessing the actual and perceived performance of WUEP in practice: a family of experiments with OO-H
Figure 7.3. Boxplots for the Effectiveness variable
In order to determine whether or not these results were significant, we applied the Mann-Whitney non-parametric test to verify H1 in EXP, since Effectiveness(WUEP) for EXP was not normally distributed (p-value = 0.029), and the one-tailed t-test for independent samples to verify this in REP1 and REP2, since both Effectiveness(WUEP) and Effectiveness(HE) were normally distributed. The p-values obtained for these tests were: 0.001 for EXP, 0.000 for REP1, and 0.000 for REP2. These results therefore support the rejection of the null hypothesis H10 for each individual experiment (p-value < 0.05), and the acceptance of its alternative hypothesis, meaning that the effectiveness of WUEP is significantly greater than the effectiveness of HE. Efficiency. Figure 7.4 presents the boxplots containing the distribution of the Efficiency variable per subject and per method for each individual experiment. These box plots show that WUEP was relatively more efficient than HE when considering the usability of the experimental objects. As in the effectiveness results, the median value for WUEP (around 0.12 usability problems detected per minute) was much higher than that for HE (between 0.05 and 0.07). In fact, the middle 50 percent of the WUEP scores is also above the third quartile in all the individual experiments. However, we found the WUEP scores to be more scattered than those of HE in all the individual experiments. This might have been caused by differences in the duration of the evaluation in each method employment, since HE achieved a more constant and higher value than WUEP.
235
Empirical validation of the Web Usability Evaluation Process
Figure 7.4. Boxplots for the Efficiency variable
In order to determine whether or not these results were significant, we applied the Mann-Whitney non-parametric test to verify H2 in EXP, since Efficiency(HE) for EXP was not normally distributed (p-value = 0.045), and the one-tailed t-test for independent samples to verify this in REP1 and REP2, since both Efficiency(WUEP) and Efficiency(HE) were normally distributed. The p-values obtained for these tests were: 0.000 for EXP, 0.000 for REP1, and 0.000 for REP2. These results therefore support the rejection of the null hypothesis H20 for each individual experiment (p-value < 0.05), and the acceptance of its alternative hypothesis, meaning that the efficiency of WUEP is significantly greater than the efficiency of HE. Perceived Ease of Use. Figure 7.5 presents the boxplots showing the distribution of the Perceived Ease of Use (PEU) variable per subject and per method for each individual experiment. These boxplots show that the participants perceived WUEP to be relatively easier to use than HE. The median value for WUEP (between 3.8 and 4.4 points in the 5-point Likert scale) was slightly higher than that for HE (between 3 and 3.2 points). However, we found the HE scores to be more scattered than those of WUEP in all the individual experiments. This may represent controversial perceptions among participants.
236
7.3 Assessing the actual and perceived performance of WUEP in practice: a family of experiments with OO-H
Figure 7.5. Boxplots for the Perceived Ease of Use variable
In order to determine whether or not these results were significant, we applied the one-tailed t-test for independent samples to verify H3 in each individual experiment, since both PEU(WUEP) and PEU(HE) were normally distributed. The p-values obtained for these tests were: 0.003 for EXP, 0.000 for REP1, and 0.002 for REP2. These results therefore support the rejection of the null hypothesis H30 for each individual experiment (p-value < 0.05), and the acceptance of its alternative hypothesis, meaning that WUEP is perceived as easier to use than HE. Perceived Satisfaction of Use. Figure 7.6 presents the boxplots showing the distribution of the Perceived Satisfaction of Use (PSU) variable per subject and method for each individual experiment. These boxplots show that the participants were more satisfied with WUEP than HE. The median value for WUEP (between 3.8 and 4.4 points in the 5-point Likert scale) was slightly higher than that for HE (around 3.5 points). However, we also found that the HE scores were more scattered than those for WUEP in all the individual experiments, particularly in EXP.
237
Empirical validation of the Web Usability Evaluation Process
Figure 7.6. Boxplots for the Perceived Satisfaction of Use variable
In order to determine whether or not these results were significant, we applied the one-tailed t-test for independent samples to verify H4 in EXP and REP1, since both PSU(WUEP) and PSU(HE) were normally distributed, and the Mann-Whitney non-parametric test to verify this in REP2, since PSU (HE) for REP2 was not normally distributed (p-value = 0.012). The p-values obtained for these tests were: 0.000 for EXP, 0.000 for REP1, and 0.025for REP2. These results therefore support the rejection of the null hypothesis H40 in each individual experiment (p-value < 0.05), and the acceptance of its alternative hypothesis, meaning that the subjects were more satisfied with the use of WUEP as compared to HE. 7.3.3.2 Influence of Order of Experimental Objects and Methods We then applied the Shapiro-Wilk test to the Diff functions (Section 4.5), and this allowed us to determine that most of these functions were normally distributed (p-value ≥ 0.05). We also applied the two-tailed t-test for independent samples and the Mann-Whitney test (depending of the data distribution) in order to verify all the hypotheses related to the influence of order of method application (i.e., HM1, HM2, HM3, and HM4), and the influence of order of experimental object employment (i.e., HO1, HO2, HO3, and HO4). Table 7.9 shows that all the p-values obtained were ≥ 0.05. We can therefore conclude that there was no effect with regard to the order of method application and experimental object employment for any dependent variable.
238
7.3 Assessing the actual and perceived performance of WUEP in practice: a family of experiments with OO-H Table 7.9. p-values for the influence of order of the independent variables Order of Methods
Experimental Objects
Dependent variable Effectiveness Efficiency Perceived Ease of Use Perceived Satisfaction of Use
EXP No (0.161) No (0.846) No (0.871) No (0.339)
Effectiveness No (0.394) Efficiency No (0.910) Perceived Ease of Use No (0.908) Perceived Satisfaction of Use No (0.514) 1Result obtained with the Mann-Whitney non-parametric test
REP1 No (0.166) No (0.769) No (0.672) No (0.160)1
REP2 No (0.275) No (0.536) No (0.350) No (0.579)1
No (0.642)1 No (0.882) No (0.734) No (0.270)1
No (0.664) No (0.709) No (0.454) No (0.419)
7.3.3.3 Qualitative Analysis This analysis revealed several important issues which should be considered if WUEP is to be improved. With regard to the first open-question “What suggestions would you make in order to improve the method’s ease of use?”, the participants suggested that WUEP might be more useful if the evaluation process were automated or computer-aided (particularly the calculation of certain metrics). With regard to the second open-question: “What suggestions would you make in order to make the metrics more useful in the context of Web usability evaluations?”, the participants detected that providing more examples of how to apply the metrics might improve the application of the method. In addition, they suggested that a more detailed description of the operationalized metric might be useful since it was not always easy to identify elements of the Web artifacts involved in the metric calculation. In the case of HE, and with regard to the first open-question, the participants recommended a previous classification of heuristics in order to determine which ones might be applicable to each kind of Web artifact obtained from a Model-driven Web development process, since this method has been commonly applied to the inspection of final user interfaces. With regard to the second open-question, the participants agreed that the heuristics need to be redefined to be more useful since their descriptions are too generic, thus leading inexperienced evaluators to obtain different interpretations. 7.3.4 Family data analysis This section provides a summary of the results obtained. We first present an analysis of the results in the context of the family of experiments, followed by the results of a meta-analysis that aggregates the empirical findings obtained in the individual experiments. 239
Empirical validation of the Web Usability Evaluation Process 7.3.4.1 Summary of Results We performed a global analysis of the results to determine whether the general goal of our family of experiments had been achieved. We also studied all the results to search for possible differences. A summary of the experiments and their results is provided in Table 7.10. Three experiments were performed, in which data gathered from 64 subjects was used to test the formulated hypotheses. The main result of the family of experiments indicates that all the alternative hypotheses (H1a, H2a, H3a, and H4a) were supported in all the experiments. This outcome shows that WUEP was more effective and efficient than HE in the detection of usability problems in artifacts obtained using a specific model-driven Web development process (OO-H). In addition, the evaluators were more satisfied when they applied WUEP, and found it easier to use than HE. Table 7.10. Summary of the results of the family of experiments Experiment EXP REP1 REP2
Type of subjects PhD Students Master’s Students Master’s Students
Num. of subjects 12 32 20
Hypotheses accepted H1a, H2a, H3a, and H4a H1a, H2a, H3a, and H4a H1a, H2a, H3a, and H4a
Influence of method order No
Influence of object order No
No
No
No
No
With regard to the Effectiveness variable, we detected that WUEP was able to detect at least 50% of the total existing usability problems in each experiment, whereas HE accounted for at least 30% of the defects. It is important to note that only one set of metrics was selected in the evaluation design stage of WUEP, whereas in HE all ten heuristics were considered. This may represent promising results as regards the range of usability aspects that are considered in WUEP owing to the employment of its Web usability model. However, these results show that the ratio of usability problems detected are low for both methods, and could be improved by considering more usability attributes in WUEP and by refining the heuristic descriptions in HE. With regard to the Efficiency variable, we detected that those participants who used WUEP were able to detect one usability problem approximately every 7 minutes (between 0.14 and 0.17 usability problems per minute), whereas those participants who used HE detected one usability problem approximately every 14 minutes (between 0.05 and 0.07 usability problems per minute). This could 240
7.3 Assessing the actual and perceived performance of WUEP in practice: a family of experiments with OO-H have been owing to the fact that HE evaluators are required to spend more time on the interpretation of each heuristic in each Web artifact. With regard to the Perceived Ease of Use variable, we detected that WUEP achieved a mean score of 4.25, 4.16 and 3.73 points in the 5-point Likert scale, whereas HE achieved a mean score of 3.23, 3.44 and 3.03 points. This may indicate that metrics are perceived as easier to apply than heuristics. However, it is important to highlight that both scores are good results for both methods since all of them were above the neutral value established at 3 points. With regard to the Perceived Satisfaction of Use variable, we found that WUEP achieved a mean score of 4.32, 4.18 and 3.82 points in the 5-point Likert scale, whereas HE achieved a mean score of 3.36, 3.56 and 3.32 points. This may represent that metrics are perceived as a useful procedure by which to evaluate Web artifacts. These scores are also good results for both methods since all of them were above the neutral value established at 3 points. We also detected slight differences between both types of participants, since the PhD students achieved better results than the Master’s students. This could have been owing to the former’s level of experience in model-driven engineering. With regard to the influence of other factors, statistical tests allowed us to conclude that there was no influence with regard to the order of method application and experimental object employment for any dependent variable. This strengthens the validity of our experimental design and also minimizes the possible learning effect when both methods are employed. In summary, the results support the hypothesis that WUEP would achieve better results than HE in the specified context. According to the previously discussed results, we can conclude that WUEP can be considered as a promising approach with which to perform usability evaluations of Web artifacts obtained from a model-driven Web development process. 7.3.4.2 Meta-Analysis Although there are several statistical methods with which to aggregate and to interpret the results obtained from interrelated experiments (Glass et al. 1981; Hedges and Olkin 1985; Rosenthal 1986; Sutton et al. 2001), we used metaanalysis because it allowed us to extract more general conclusions. Meta-analysis is a set of statistical techniques for combining the different effect sizes of the experiments to obtain a global effect of a factor. In particular, the estimation of effect sizes can be used after comparing studies to evaluate the average impact across studies of an independent variable on the dependent variable. Since measures may come from different settings and may be non241
Empirical validation of the Web Usability Evaluation Process homogeneous, a standardized measure must be obtained for each experiment: these measures must be combined to estimate the global effect size of a factor. In our study, we considered that the usability inspection method was the main factor in the family of the experiments. The meta-analysis was conducted by using the Meta-Analysis v2 tool (Biostat 2006). We employed the mean value obtained using the WUEP method minus the mean value achieved when using the HE method to calculate the effect sizes for all the dependent variables (i.e., Effectiveness, Efficiency, Perceived Ease of Use, Perceived Satisfaction of Use) for each of the individual experiments, and these values were then used to obtain the Hedges’ g metric (Hedges and Olkin 1985; Kampenes et al. 2007), which was used as a standardized measure. This measure expresses the magnitude of the effect of the method employed. In order to obtain the overall conclusion, we calculated the Z-score based on the mean and standard deviation of the Hedges’ g statistics of the experiments. More specifically, we used correlation coefficients, which provided the effect sizes that had a normal distribution (zi) once they had been transformed by the Fisher transformation (Fisher 1915). The global effect size was obtained by using the Hedges’ g metric, whose weights were proportional to the experiment’s size:
Z
i wi zi (2) i wi
Where wi = 1/(ni-3) and ni is the sample size of the i-th experiment. The higher the value of Hedges’ g, the higher the corresponding correlation coefficient is. Table 7.11 summarizes the results of the meta-analysis: for each experiment, it reports the effect size, the values of the Hedges’ g metric, and its significance. For studies in Software Engineering, the effect size is rated as small (0 to 0.37), medium (0.38 to 1), or large (above 1) (Kampenes et al. 2007) depending on the standardized difference between the two means m1 and m2. For example, an effect size of 0.5 indicates that m1 = m2 + (0.5 * d), where d is the standard deviation (i.e., a positive value signifies that WUEP achieved better results than HE in the dependent variable defined).
242
7.3 Assessing the actual and perceived performance of WUEP in practice: a family of experiments with OO-H Table 7.11. Hedges’ metric values for all the dependent variables Dependent variable Effectiveness
Efficiency
Perceived Ease of Use
Perceived Satisfaction of Use
Experiment EXP REP1 REP2 Global Effect Size EXP REP1 REP2 Global Effect Size EXP REP1 REP2 Global Effect Size EXP REP1 REP2 Global Effect Size
Effect Size (Hedges’ g) Large (1.022) Large (1.146) Large (1.697)
Significance (p-value) Yes (p = 0.003) Yes (p < 0.001) Yes (p < 0.001)
Large (1.243)
Yes (p < 0.001)
Large (2.261) Large (1.146) Large (1.443)
Yes (p < 0.001) Yes (p < 0.001) Yes (p < 0.001)
Large (1.352)
Yes (p < 0.001)
Medium (0.904) Medium (0.811) Medium (0.682)
Yes (p = 0.006) Yes (p < 0.001) Yes (p = 0.005)
Medium (0.785)
Yes (p < 0.001)
Large (1.294) Medium (0.825) Medium (0.451)
Yes (p < 0.001) Yes (p < 0.001) Yes (p = 0.046)
Medium (0.747)
Yes (p < 0.001)
For the reader’s convenience, we show the meta-analysis results in diagram form by using a forest plot (or blobbogram). Figure 7.7 shows the four diagrams as provided by the tool used. On the left-hand side, the experiments are reported in chronological order from the top downwards. On the righthand side, the effect of the Hedges’ g metric is plotted for each experiment by a square whose dimensions are proportional to the weight of the experiment in the meta-analysis. The estimations for studies with a large sample size are more accurate, signifying that they make a greater contribution to the overall effect. The square size is proportional to the number of participants and the experiment effect size, and the square position with regard to the ‘x’ axis indicates the Hedges’ g value. The confidence intervals of each experiment are represented by the horizontal lines. Here we have considered a confidence interval of 95% for each experiment. The confidence interval [-1, 0] indicates a negative correlation, whereas the confidence interval [0, 1] indicates a positive correlation. The overall conclusion is represented by a diamond in the last row of the figure. In particular, the summary measure is the center line of the diamond, while the associated confidence interval is the lateral tips of the diamond. 243
Empirical validation of the Web Usability Evaluation Process
Figure 7.7. Meta-analysis for all the dependent variables
The effect size obtained was large for the objective dependent variables (i.e., Effectiveness and Efficiency) and medium for the subjective dependent variables (i.e., Perceived Ease of Use and Perceived Satisfaction of Use). This was probably a result of the number of experiments used in the data metaanalysis. Despite the fact that the first experiment contributed to the overall results of the meta-analysis to a lesser extent, these results present a significant positive effect, and we can thus reject the null hypotheses which were formulated for each dependent variable (i.e., “there are no significant differences between WUEP and HE”). The meta-analysis therefore strengthens all the alternative hypotheses, providing promising results as regards WUEP’s performance.
7.4 Assessing the usefulness of WUEP: a controlled experiment with WebML A controlled experiment was carried out in order to empirically validate the application of WUEP in practice. The controlled experiment was performed by considering the guidelines proposed in Wohlin et al. (2000). The following stages took place: 1) Experiment planning; 2) Experiment operation; and 3) Result analysis. These stages are explained in the following sub-sections. 7.4.1 Experiment Planning The experiment was planned by carrying out the following steps: 1) establishment of the goal of the experiment; 2) definition of the context, 2) 244
7.4 Assessing the usefulness of WUEP: a controlled experiment with WebML selection of variables; 3) formulation of hypotheses; 4) experimental design; and 5) instrumentation employed. These steps are described in the following subsections. 7.4.1.1 Experiment Goal According to the Goal-Question-Metric (GQM) paradigm (Basili and Rombach 1988), the goal of the experiment is: to analyze the WUEP operationalization for the WebML development process, for the purpose of evaluating it with regard to its effectiveness, efficiency, perceived ease of use, and the evaluators’ perceived satisfaction of it in comparison to HE from the viewpoint of a set of novice usability evaluators. This experimental goal will also allow us to show the feasibility of our approach when it is applied to Web artifacts from a concrete model-driven Web development process (WebML), in addition to detecting issues that can be further improved in future versions of WUEP. 7.4.1.2 Context Definition The context was determined by a) the Web applications to be evaluated; b) the usability evaluation methods to be evaluated; and c) the subject selection. These are described in the following subsections. A) Web applications to be evaluated. Two Web applications were evaluated: a Web Calendar for meeting appointment management, and a Web Store for book e-commerce. They were developed through the use of the Web Modeling Language (WebML) (Ceri et al. 2000) by the WebRatio Company located in Milano (Italy). As mentioned in Section 4.1, this model-driven Web development method is full supported by the WebRatio Tool Personal Edition. Two different functional features of the Web Calendar application (Appointment management and User comments support) were selected for the composition of the experimental object O1, whereas two different functional features of the Web Store application (Book search and Book shopping) were selected for the composition of the experimental object O2, as shown in Table 7.12. Each experimental object contains two Web artifacts: a Hypertext model (HM) and a Final User Interface (FUI). We selected these functional features in each experimental object composition since they are relevant to the end-users and they allow us to compose two experimental objects whose attached Web artifacts are similar in both size and complexity.
245
Empirical validation of the Web Usability Evaluation Process Table 7.12. Experimental objects Experimental
Web
Functional
Web Artifacts to be evaluated
Object
application
Features
O1
Web Calendar
- Appointment
1 Hypertext Model (HM1)
management - User
1 Final User Interface (FUI1)
comments support O2
Web Store
- Book search
1 Hypertext Model (HM2)
- Book shopping
1 Final User Interface (FUI2)
B) Usability evaluation methods to be evaluated. The methods evaluated through the controlled experiment were two inspection methods: our proposal (WUEP) and the Heuristic Evaluation (HE) proposed by Nielsen (1994). The Heuristic Evaluation (HE) method requires a group of evaluators to examine Web artifacts in compliance with commonly-accepted usability principles called heuristics. HE proposes ten heuristics that are intended to cover the best practices in the design of any user interface. (e.g., minimize the user workload, error prevention, recognition rather than recall). In order to facilitate both the method application and the method comparison, we have structured the HE method in the same main stages provided by WUEP as was mentioned in Section 7.2. Since the context of this controlled experiment was from the viewpoint of a set of usability inspectors, we evaluated the execution stages of both methods (WUEP and HE), or in other words, the evaluators’ application of both methods. Two of the authors therefore performed the role of evaluation designer in both methods in order to design an evaluation plan. In critical activities such as the selection of usability attributes in WUEP, we required the help of two external Web usability experts. The outcomes of the stages performed by the evaluation designers are described as follows. With regard to the establishment of the evaluation requirements stage, the first three activities (i.e., purpose of the evaluation, evaluation profiles, and selection of Web artifacts) were the same for both methods. In the case of the HE, all 10 heuristics were selected. In the case of the WUEP, a set of 20 usability attributes were selected as candidates from the Web Usability Model through the consensus reached by the two evaluator designers and the two usability experts. The attributes were selected by considering the evaluation profiles (i.e., which of them would be more relevant to the type of Web application and the context in which it is going to be used). Only 12 out of 20 attributes were 246
7.4 Assessing the usefulness of WUEP: a controlled experiment with WebML randomly selected in order to maintain a balance between the number of measures and heuristics to be applied. With regard to the specification of the evaluation stage, the 10 heuristics from the HE were described in detail by providing guidelines concerning which elements can be considered in the Web artifacts to be evaluated. Examples of these heuristics can be found in Appendix C.1. In the case of the WUEP, 12 measures associated with the 12 selected attributes were obtained from the Web Usability Model, and then associated with the artifact in which they could be applied. More specifically, 6 measures were associated with the Hypertext Model and the other 6 were associated with the Final UI. Once the measures had been associated with the artifacts, they were operationalized in order to provide a calculation formula for these Web artifacts and to establish rating levels for them. With regard to the design of the evaluation stage, the same evaluation plan (i.e., the experiment design), along with the same template with which to report usability problems, were defined for both methods. The templates employed for both inspection methods can be found in Appendix C.4. C) Subjects selection. The subjects were 30 fifth-year Computer Science students from the Universitat Politècnica de València, who were enrolled on an Advanced Software Technologies course from September 2011 to January 2012. We took a “convenience sample” (i.e., all the students available in the class) (Turner et al. 2008). We followed the same rationale as that used in the family of experiments with OO-H (see Section 7.3.1.2). We did not establish a classification of participants, since none of the students had any previous experience in conducting usability evaluation studies. The assignation of the participants to the experimental groups was therefore random. 7.4.1.3 Variables Selection The selected variables are the same as those that were selected in the family of experiments with OO-H (See Section 7.3.1.3):
Independent variables: a) Usability inspection method; and b) Experimental object. Dependent variables: a) Effectiveness, b) Efficiency, c)Perceived Ease of Use, and d) Perceived Satisfaction of Use
247
Empirical validation of the Web Usability Evaluation Process 7.4.1.4
Hypotheses
We formulated the same null hypotheses as those formulated in the family of experiments with OO-H. Each null hypothesis and its alternative hypothesis are presented as follows:
H10: There is no significant difference between the effectiveness of WUEP and HE. H1a: WUEP is significantly more effective than HE. H20: There is no significant difference between the efficiency of WUEP and HE. H2a: WUEP is significantly more efficient than HE. H30: There is no significant difference between the perceived ease of use of WUEP and HE. H3a: WUEP is perceived to be significantly easier to use than HE. H40: There is no significant difference between the perceived satisfaction of applying WUEP and HE. H4a: WUEP is perceived to be significantly more satisfactory to use than HE
7.4.1.5 Experiment Design The experiment was also planned as a balanced within-subject design with a confounding effect, signifying that the same number of participants used both methods in a different order and with different experimental objects. The same schema was employed in the family of experiments with OO-H (see Table 7.2). 7.4.1.6
Instrumentation
The material was composed of the documents needed to support the experimental tasks and the training material. The documents used to support the experimental tasks were:
248
Four kinds of data gathering documents in order to cover the four possible combinations (WUEP-O1, WUEP-O2, HE-O1, and HE-O2). Each document contained: the set of Web artifacts from the experimental object with a description of their modeling primitives; and the description of the tasks to be performed in these artifacts (an example of these tasks for both usability inspection methods can be
7.4 Assessing the usefulness of WUEP: a controlled experiment with WebML
found in Appendix C). Although only two artifacts were evaluated (i.e., Hypertext Model and Final User Interface), we also included a Data Model in order to provide a better understanding of the Web application’s structure and content. Two appendixes containing a detailed explanation of each evaluation method (WUEP and HE). Two questionnaires (one for each method), which contained the closed-questions presented in a previous Section with which to evaluate the two subjective dependent variables (i.e., Perceived ease of use and Perceived satisfaction). Various questions belonging to the same dependent variable (i.e., construct group) were randomized to prevent systemic response bias. In addition, in order to ensure the balance of items in the questionnaire, half of the questions on the left-hand side were written as negative sentences to avoid monotonous responses (Hu and Chau 1999). We also added two open-questions in order to obtain feedback on how to improve the ease of use and the employment of both methods. These open-questions were formulated as follows: o Q1: What suggestions would you make in order to improve the method’s ease of use? o Q2: What suggestions would you make in order to make the measures/heuristics more useful in the context of Web usability evaluations?
The training materials included: i) a set of slides containing an introduction to the WebML method in order to present the modeling primitives of Web artifacts; (ii) a set of slides describing the WUEP method, with examples of measure application and the procedure to be followed in the experiments; and (iii) a set of slides describing the HE method with examples of heuristic application and the procedure to be followed in the experiments. All the documents were created in Spanish, since this was the participants’ native language. All the material (including the experimental tasks and the training slides) is available for download at http://www.dsic.upv.es/ ~afernandez/ thesis/ instrumentation.html. 7.4.2 Experiment Operation This section details the experiment operation by describing the preparation, the execution, and the data validation.
249
Empirical validation of the Web Usability Evaluation Process With regard to the experiment preparation, the experiment was planned to be conducted over three days owing to the course timetable and the optimization of resources. Table 7.13 shows the planning for these days. On the first day, the participants were given the complete training and they were also informed of the procedure to follow in the execution of the experiment. They were told that their answers would be treated anonymously, and were also informed that their grade for the course would not be affected by their performance in the experiment. On the second and third days, the participants were given an overview of the complete training before applying the evaluation method, since all the groups were located in the same session. We established a time slot of 90 minutes as an approximation for each method application. However, we allowed the participants to continue the experiment even though these 90 minutes had passed in order to avoid a possible ceiling effect (Sjøberg et al. 2003). Table 7.13. Planning for the controlled experiment Groups G1 (8 subjects) 1st Day (120 minutes) 2nd Day (30 + 90 minutes) 3rd Day (30 + 90 minutes)
G2 (7 subjects)
G3 (8 subjects)
G4 (7 subjects)
WebML Introduction, Training with HE and WUEP WebML Introduction, Training with WUEP and HE WUEP in O1
WUEP in O2
Questionnaire for WUEP
HE in O1
HE in O2
Questionnaire for HE
WebML Introduction, Training with HE and WUEP HE in O2
HE in O1
Questionnaire for HE
WUEP in O2
WUEP in O1
Questionnaire for WUEP
With regard to the execution of the experiment, the experiment took place in a single room and no interaction between participants was allowed. We logged all the interventions that were necessary to clarify questions concerning the completion of the experimental tasks, along with possible improvements that could be made to the experiment material. With regard to the data validation, we checked that all the participants had completed all the requested data. However, a total of 6 samples were discarded: 4 owing to incomplete data, and 2 of which were randomly discarded to maintain the same number of samples per group. The experiment eventually considered the results of only 24 evaluators (6 samples per group). 250
7.4 Assessing the usefulness of WUEP: a controlled experiment with WebML 7.4.3 Result Analysis After the execution of the experiment, the control group analyzed all the usability problems detected by the subjects. If a usability problem was not in the initial list, this group determined whether it could be considered as a real usability problem or a false positive. Replicated problems were considered only once and discrepancies in this analysis were solved by consensus. The control group determined a total of 9 and 11 usability problems in the experimental objects O1 and O2, respectively. In this section, we discuss the results of the experiment by quantitatively analyzing the results for each dependent variable and testing all the formulated hypotheses. We also analyze the influence of the order of both independent variables (i.e., method and experimental object). All the results were obtained by using the SPSS v16 statistical tool with a statistical significance level of α = 0.05. Finally, a qualitative analysis based on the feedback obtained from the open-questions in the questionnaire is also provided. 7.4.3.1 Quantitative Analysis Table 7.14 summarizes the overall results of the usability evaluations performed in each experiment. The cells in bold type indicate the subjects’ best performance in each statistic. The overall results obtained have allowed us to interpret that WUEP has achieved the subjects’ best performance in all the statistics that were analyzed. As observed in these results, WUEP tends to provide a low degree of false positives and replicated problems. The low degree of false positives can be explained by the fact that WUEP aims to minimize the subjectivity of the evaluation by providing a more systematic procedure (measures) to detect usability problems rather than interpreting whether the usability principles have been supported or not (heuristics). The low degree of replicated problems can be explained by the fact that WUEP provides operationalized measures that have been previously classified to be applied in one type of artifact.
251
Empirical validation of the Web Usability Evaluation Process Table 7.14. Overall results of the usability evaluations Method Statistics Number of problems per subject False positives per subject Replicated problems per subject Duration (min) Effectiveness (%) Efficiency (Prob. / min) Perceived Ease of Use (1-5) Perceived Satisfaction of Use (1-5)
WUEP
HE
Mean
6.50
3.29
Std. Dev.
1.14
1.08
Mean
0.54
1.38
Std. Dev.
0.66
1.24
Mean
0.00
0.88
Std. Dev.
0.00
0.80
Mean
80.88
70.13
Std. Dev.
18.46
13.52
Mean
65.32
33.04
Std. Dev.
11.54
10.85
Mean
0.08
0.05
Std. Dev.
0.02
0.02
Mean
3.80
3.38
Std. Dev.
0.72
0.73
Mean
3.92
3.63
Std. Dev.
0.75
0.67
Since the sample size is smaller than 50, we applied the Shapiro-Wilk test to verify whether the data was normally distributed. Our aim was to select which tests are needed in order to verify our hypotheses. Table 7.15 shows the results of the normality test, in which “*” signifies that this variable is not normally distributed in this usability inspection method. Table 7.15. Shapiro-Wilk Normality test results HE WUEP
Effec.
Effic.
PEU
PSU
0.219
0.722
0.414
0.281
0.021 * (< 0.05)
0.296
0.072
0.053
The analyses of each dependent variable: a) Effectiveness, b) Efficiency, c) Perceived Ease of Use, and d) Perceived Satisfaction of Use; and their hypotheses testing are detailed as follows. 252
7.4 Assessing the usefulness of WUEP: a controlled experiment with WebML A) Effectiveness. Figure 7.8(a) presents the boxplot containing the distribution of the Effectiveness variable per subject and per method. This boxplot shows that WUEP was relatively more effective than HE when inspecting the experimental objects. Although we found some variability since the WUEP scores were more scattered than those of HE, the median value for WUEP (63.64% of the existing usability problems) was much higher than that for HE (33.33% of the existing usability problems). In addition, the middle 50 percent of WUEP scores was above the third quartile of HE. In order to determine whether or not these results were significant, we applied the Mann-Whitney non-parametric test to verify H1, since Effectiveness (WUEP) was not normally distributed, in other words, after obtaining a p-value = 0.021 (< 0.05) from the Shapiro-Wilk normality test. The one-tailed p-value obtained for the Mann-Whitney test was 0.000. This result therefore supports the rejection of the null hypothesis H10 (p-value < 0.05), and the acceptance of its alternative hypothesis, meaning that the effectiveness of WUEP was significantly greater than the effectiveness of HE.
Figure 7.8. Boxplots for the dependent variables
B) Efficiency. Figure 7.8(b) presents the boxplot containing the distribution of the Efficiency variable per subject and per method. This boxplot show that WUEP was relatively more efficient than HE when inspecting the experimental objects. Although we also found more variability within the WUEP scores than those of HE, the median value for WUEP (0.08 problems detected per minute) was higher than that for HE (0.05 problems detected per minute). As also obtained in the effectiveness results, the middle 50 percent of WUEP scores was above the third quartile of HE.
253
Empirical validation of the Web Usability Evaluation Process In order to determine whether or not these results were significant, we applied the one-tailed t-test for independent samples to verify H2, since both Efficiency (WUEP) and Efficiency (HE) were normally distributed. The onetailed p-value obtained for the t-test was 0.000. This result therefore supports the rejection of the null hypothesis H20 (p-value < 0.05), and the acceptance of its alternative hypothesis, meaning that the efficiency of WUEP was significantly greater than the efficiency of HE. C) Perceived Ease of Use. Figure 7.8(c) presents the boxplot showing the distribution of the Perceived Ease of Use (PEU) variable per subject and per method. This boxplot shows that the participants perceived WUEP to be relatively easier to use than HE. The median value for WUEP (4 points in the 5-point Likert scale) was slightly higher than that for HE (3.4 points in the 5point Likert scale). However, we found the HE scores to be more scattered than those of WUEP. This may represent controversial perceptions among participants. In order to determine whether or not these results were significant, we applied the one-tailed t-test for independent samples to verify H3, since both PEU (WUEP) and PEU (HE) were normally distributed. The one-tailed p-value obtained for the t-test was: 0.026. These results therefore support the rejection of the null hypothesis H30 (p-value < 0.05), and the acceptance of its alternative hypothesis, meaning that WUEP was perceived as easier to use than HE. D) Perceived Satisfaction of Use. Figure 7.8(d) presents the boxplot showing the distribution of the Perceived Satisfaction of Use (PSU) variable per subject and method. This boxplot shows that the participants were more satisfied with WUEP than HE. The median value for WUEP (points in the 5point Likert scale) was also slightly higher than that for HE (points in the 5point Likert scale). Although we also found that the HE scores were more scattered than those for WUEP, the middle 50 percent of both WUEP and HE scores were above 3 points in the 5-point Likert scale. In order to determine whether or not these results were significant, we applied the one-tailed t-test for independent samples to verify H4, since both PSU (WUEP) and PSU (HE) were normally distributed. The one-tailed p-value obtained for the t-test was 0.086. These results therefore support the acceptance of the null hypothesis H40 (p-value > 0.05), meaning that there was no significant difference between the participants’ perceived satisfaction when employing WUEP and HE.
254
7.4 Assessing the usefulness of WUEP: a controlled experiment with WebML 7.4.3.2 Influence of Order of Independent Variables In order to test whether the order of our independent variables (i.e., Method and Experimental Objects) had influenced our results, we also applied the Diff function (see Section 7.3.1.5) and the Shapiro-Wilk test to prove the normality of these functions.The hypotheses related to the Diff functions were the same as those that were formulated in the family of experiments with OO-H (see Table 7.4), which are two-sided since we did not make any assumption about whether one specific order would be more influential than another We verified these hypotheses by applying the parametric two-tailed t-test for independent samples in all the cases except the Effic_Diff(Method) distribution in which we applied the Mann-Whitney non-parametric test, since Effic_Diff (HE) was not normally distributed. Table 7.16 shows the p-values obtained in each significance test. This table shows that all the p-values obtained were > 0.05. We can conclude that there was no effect with regard to the order of methods and experimental objects for any dependent variable. Table 7.16. p-values obtained for the Influence of order of both independent variables Order of
Dependent variable
p-values
Influence?
Methods
Effectiveness
0.095
No (HM10 accepted)
Efficiency
0.291
No (HM20 accepted)
Perceived Ease of Use
0.173
No (HM30 accepted)
Perceived Satisfaction of Use
0.560
No (HM40 accepted)
Experimental
Effectiveness
0.989
No (HO10 accepted)
Objects
Efficiency
0.932
No (HO20 accepted)
Perceived Ease of Use
0.709
No (HO30 accepted)
Perceived Satisfaction of Use
0.560
No (HO40 accepted)
7.4.3.3 Qualitative Analysis This analysis revealed several important issues which should be considered if WUEP is to be improved. With regard to the first open-question “What suggestions would you make in order to improve the method’s ease of use?”, the participants suggested that WUEP might be more useful if the evaluation process were automated or computer-aided (particularly the calculation of certain measures). With regard to the second open-question: “What suggestions would you make in order to make the measures more useful in the context of Web usability evaluations?”, the participants detected that providing more examples of how to apply the measures might improve its the application. 255
Empirical validation of the Web Usability Evaluation Process In addition, they suggested that a more detailed description of the operationalized measure might be useful since it was not always easy to identify elements of the Web artifacts involved in the measure calculation. In the case of HE, and with regard to the first open-question, the participants recommended a previous classification of heuristics in order to determine which of them might be applicable to each kind of Web artifact obtained from a Model-driven Web development process, since this method has been commonly applied to the inspection of final user interfaces. With regard to the second open-question, the participants agreed that the heuristics need to be redefined to be more useful since their descriptions are too generic, thus leading inexperienced evaluators to obtain different interpretations.
7.5 Threats to validity We must consider certain issues which may have threatened the validity of both empirical research studies: the family of experiments with OO-H and the controlled experiment with WebML: 7.5.1 Internal Validity The threats to internal validity are relevant in those studies that attempt to establish a causal relationship. In our case, the main threats to the internal validity were: learning effect, usability experts’ experience, subjects’ experience, information exchange among participants, and understandability of the documents. The learning effect was alleviated by ensuring that each participant applied each method to different experimental objects, and all the possible order combinations were considered. We also assessed the effect of order of method and order of experimental object by using statistical tests. Usability experts’ experience may be an influential factor in building the baseline of usability problems detected. We attempted to alleviate this threat by involving these experts in the evolution of this baseline according to the new usability problems detected by the participants. Subjects’ experience was not an influential factor since none of the participants had any experience in usability evaluations. We confirmed this fact by asking the participants about their experience with usability evaluation methods. This fact was the rationale for providing the training sessions in both methods in each experiment since we intended to balance the subject’s knowledge on the Web usability evaluation method according to the novice evaluator profile. 256
7.5 Threats to validity However, the training sessions may have affected the performance of the family of experiments, since the participants received the complete training immediately before the experimental tasks in the original experiment (EXP), whereas in the replications (REP1 and REP2) the participants received the complete training on the previous day. In order to alleviate this issue, we included a training slot before the experimental tasks in REP1 and REP2 in order to remind the participants of the employment of both inspection methods. With regard the controlled experiment with WebML, we followed the same schema proposed in REP1 and REP2. In order to minimize information exchange among participants, they were monitored by the experiment conductors to avoid communication biases while performing the tasks. However, this might have affected the results since the experiment took place over more than one day, and it is difficult to be certain whether the participants exchanged any information with each other. In order to alleviate this situation, at least to some extent, the participants were asked to return all the material at the end of each task. Moreover, since the participants from the replications REP1 and REP2 were from the same Master’s course but from different academic years, we ensured that no participants who were enrolled in REP1 were also enrolled in REP2. We also ensured that no participants who were enrolled in the WebML experiment were also enrolled in the family of experiments with OO-H. Finally, understandability of the material was alleviated by clearing up all the misunderstandings that appeared in each experimental session. 7.5.2 External validity This refers to the approximate truth of conclusions involving generalizations within different contexts. In our case, the main threats to the external validity were the representativeness of the results and the size and complexity of the tasks. The representativeness of the results might be affected by the evaluation design, the severity of the problems detected, and the participant context selected. The evaluation design might have made an impact on the results owing to the selection of Web artifacts (experimental objects) and usability attributes to be evaluated during the design stage of WUEP. With regard to the selection of Web artifacts, we attempted to alleviate this by considering a set of artifacts with the same size and complexity, and which also contained representative artifacts of a Model-driven Web development process (i.e., navigational model, presentation model and final user interface). With regard to the selection of usability attributes, we attempted to alleviate this threat by 257
Empirical validation of the Web Usability Evaluation Process considering a set of relevant usability attributes by involving Web usability experts in this decision. In order to alleviate these issues, we intend to evaluate more Web applications, and to carry out surveys to provide a predefined set of usability attributes to be evaluated in different Web application families (e.g., intranets, social networks, virtual marts) which will be useful as guidance for evaluator designers. In addition, WUEP has been operationalized to be used in the context of two specific model-driven Web development methods (i.e., OO-H and WebML). Consequently, our results can only be generalized to Web applications that follow a model-driven Web development process that is based on these both methods. Nevertheless, both can be considered as representative methods of the whole set of model-driven Web development methods (Moreno and Vallecillo 2008). In order to perform differentiated replications by considering other model-driven Web development methods, we would need to perform some adaptations in the stages pertaining to the design evaluator role proposed in WUEP. With regard to the establishment of the evaluation requirements stage, the adaptations needed would be:
Update the evaluation profile since the model-driven Web development method used to integrate WUEP has changed. In addition, other aspects such as the type of Web application to be evaluated and its context of use would also change to reflect the characteristics of the Web application to be evaluated. Update the selection of Web artifacts (models) as a consequence of the new evaluation profile. Update the selection of usability attributes from the Web Usability Model if the type of Web application has changed in order to consider other usability attributes that are relevant to this specific type of Web application.
With regard to the specification of the evaluation stage, the adaptations needed would be:
258
Update the selection of metrics as a consequence of the new usability attributes selected. Operationalize the selected metrics to be applied to the new Web artifacts (models) selected. This operationalization consists of establishing a mapping between the generic definition of the metric and the modeling primitives of the new Web artifacts considered, which will require a previous analysis of the expressiveness of the modeling primitives. This task could be supported by using the equivalence of
7.5 Threats to validity the modeling primitives of the OO-H and WebML method with regard to other model-driven Web development methods (e.g., UWE, NDT) described in Cachero et al. (2007). It is important to note that metrics which were operationalized to be applied in the final user interface can be reused without any adaptation. The severity of the usability problems detected may have affected the representativeness of the results since we did not provide different weights for each usability problem according to its severity. Each usability problem was counted as being equal to the others in order to calculate the effectiveness and efficiency variables. We made this decision since considering the problem’s severity could have led to a high degree of subjectivity in the final results. Despite the fact that all the experiments were performed in an academic context (PhD and Master’s students), the participants’ performance could be considered representative according to single-experienced evaluators (i.e., evaluators who have experience in the Web domain, but not in usability evaluations). The kinds of students involved will soon be integrated into the industry’s market. As further work, we intend to conduct more experiments involving double-experienced evaluators (i.e., evaluators who have experience in both the Web domain and in usability evaluations) in order to assess how the experience level will impact on the results obtained. In addition, since only internal replications were conducted, more external replications need to be conducted by other experimental conductors in other settings to confirm these results. In order to address the aforementioned limitations, these external replications will involve participants from different contexts and also from different levels of experience in Web usability evaluations. The size and complexity of the tasks might have also affected the external validity. We decided to use relatively small tasks that would be applied in few representative Web artifacts since a controlled experiment requires participants to complete the assigned tasks in a limited amount of time. 7.5.3 Construct validity The construct validity may have been influenced by the measures that were applied in the quantitative analysis and the reliability of the questionnaire. We intended to alleviate the first threat by evaluating the dependent variables that are commonly employed in experiments in which usability inspection methods are involved. In particular, we employed the Effectiveness and Efficiency measures as suggested by Hartson et al. (2003) for formative evaluations (i.e., usability evaluations during the Web development process). These measures have also been employed in similar empirical studies (Conte et al. 2009). In 259
Empirical validation of the Web Usability Evaluation Process addition, the subjective measures employed were Perceived Ease of Use and Perceived Satisfaction of Use, based on the Technology Acceptance Model (TAM) (Davis 1989), a well-known and thoroughly validated model for the evaluation of information technologies. The reliability of the questionnaires was tested by applying the Cronbach’s testshows the Cronbach’s alpha obtained for each set of closed-questions intended to measure both subjective dependent variables (see Perceived Ease of Use and Perceived Satisfaction of Use in Table 7.17). All the values obtained were higher than the acceptable minimum threshold (α ≥ 0.70) (Maxwell 2002). Table 7.17. Cronbach’s alphas for the reliability of questionnaires Dependent variable Perceived Ease of Use Perceived Satisfaction of Use Family of experiments with OO-H EXP Acceptable (0.909) REP1 Acceptable (0.762) REP2 Acceptable (0.842)
Acceptable (0.802) Acceptable (0.780) Acceptable (0.785)
Experiment with WebML
Acceptable (0.782)
Acceptable (0.801)
7.5.4 Conclusion validity The main threats to the conclusion validity were the data collection and the validity of the statistical tests applied. With regard to the data collection, we applied the same procedure in each individual experiment in order to extract the data, and ensured that each dependent variable was calculated by applying the same formula. With regard to the validity of the statistical tests applied, we applied the most common tests that are employed in the empirical software engineering field owing to their robustness and sensitivity (Maxwell 2002).
7.6 Conclusions This chapter has reported the results of the empirical validation whose aim was to evaluate participants’ effectiveness, efficiency, perceived ease of use, and perceived satisfaction of use when using WUEP in comparison to a widelyused industrial inspection method based on heuristics: Heuristic Evaluation (HE). The results of the quantitative analysis showed that WUEP was more effective and efficient than HE in the detection of usability problems in artifacts obtained from two concrete model-driven Web development process (i.e., OO-H and WebML). In the particular case of the OO-H method, these results 260
7.6 Conclusions were supported by a meta-analysis that was performed in order to aggregate empirical findings from each individual experiment. The low ratio of false positives obtained by WUEP suggests that the use of metrics as part of the evaluation process reduces the degree of subjectivity in the evaluation of Web artifacts. The low ratio of replicated problems can be explained by the fact that WUEP provides operationalized metrics which are specifically tailored to each type of artifact in the Web development process, thus reducing the subjectivity associated with generic rules that relies on the evaluator’s experience. In addition, with regard to the evaluators’ perceptions, the participants were more satisfied when they applied WUEP (although this was only statistically significant when it was instantiated in OO-H), and they also found it easier to use than HE. The results of the qualitative analysis also suggest that WUEP could be greatly improved with a tool that automates most of the tasks involved in the method, including the calculation of some metrics and allowing the generation of usability reports. From a research perspective, the family of experiments in OO-H and the controlled experiment in WebML were a valuable means to obtain feedback with which to improve our Web Usability Evaluation Process. To the best of our knowledge, this is the first empirical study to provide evidence of the usefulness of a usability evaluation method for a model-driven Web development process. This empirical study is intended to contribute to Web Engineering research through its proposal of a well-defined framework that can be reused by other researchers in the empirical validation of their Web usability evaluation methods. From a practical perspective, we are aware that our empirical study only provides preliminary results on the usefulness of our Web Usability Evaluation Process in practice. Although the experimental results provided good results as regards the performance of our usability inspection method for Web applications developed using model-driven development, these results need to be interpreted with caution since they are only valid within the context established in this family of experiments. There is a need for more empirical studies with which to test our proposal in other settings. Nevertheless, this empirical validation has value as the first study to test the integration of usability evaluations into model-driven Web development processes.
261
PART VI Conclusions
Chapter 8 8 Conclusions This chapter reviews the research objectives stated and the main findings that can be drawn from this work. We also examine to what extent the research objectives have been met. Finally, we present the contributions of this work to the research community by means of publications, research stays and grants awarded; and the opportunities for further research.
8.1 Conclusions Web applications play an important role in business activities, information exchange, and social networks. The acceptability of Web applications relies on the ease or difficulty that users experience with this kind of systems. Usability is therefore considered to be one of the most important quality factors for Web applications. The challenge of developing more usable Web applications has led to the emergence of usability evaluation methods with which to address Web usability. However, the majority of proposals have certain limitations: a) There is a lack of usability evaluation methods that can be properly integrated into the early stages of Web development processes. b) There is a shortage of usability evaluation methods that have been empirically validated. 265
Conclusions The aim of this PhD thesis is to propose a usability inspection method that can be integrated into different model-driven Web development processes, thus enabling usability evaluations to be made by employing the Web artifacts created during the different stages of the Web development process. The aforementioned aim has been satisfied by dealing with the sub-goals presented in Section 1.4. The intention of the following subsections is to examine to what extent each goal has been achieved. 8.1.1 Goal 1: Analysis of Web usability evaluation methods With regard to this goal, we conducted both a systematic mapping study in order to investigate what usability evaluation methods have been employed to evaluate Web artifacts and a systematic review in order to gather empirical evidence about the effectiveness of Web usability evaluation methods. Our systematic mapping study summarized the existing information regarding usability evaluation methods that have been employed by researchers to evaluate Web artifacts. From an initial set of 2703 papers, a total of 206 research papers were selected for the mapping study. These papers were classified by considering several data extraction criteria: origin of the UEM, underlying usability definition; type of UEM; type of evaluation performed by the UEM; phase(s) and Web artifacts in which it is applied; feedback provided by the UEMs; and type of empirical study used to validate the UEM. Some of the most relevant findings were:
266
Usability evaluation methods have been constantly modified to better support the evaluation of Web artifacts. However, the methods evaluate different usability aspects depending on the underlying definition of the usability concept (ISO/IEC 9241-11, ISO/IEC 91261). This signifies that there is no single method that is suitable for all circumstances and types of Web artifacts. It depends on the purpose of the evaluation and the type of artifact that is evaluated (e.g., abstract user interfaces, log files, final Web user interfaces). Our results suggest that a combination of methods (e.g., inspection and inquiry methods) could provide better results. The majority of the papers reported on evaluations at the implementation phase (e.g., final user interfaces, log analysis). The study also reveals that the evaluations are mainly performed in a single phase of the Web application development. There is a shortage of automated evaluation methods, specifically those that can be applied at early stages (e.g. requirements specifications, navigational models, presentation models).
8.1 Conclusions
The majority of the papers do not present any kind of validation. Among the papers that present empirical validations, several controlled experiments have been reported. More replications are therefore needed to build up a body of knowledge concerning usability evaluation methods for the Web. The majority of the methods reviewed only reported a list of usability problems; they did not provide explicit feedback or suggestions to help designers improve their artifacts. Web usability evaluation is an important topic and interest in it is growing.
Our systematic review analyzed which Web usability evaluation methods have proven to be the most effective. A total of 18 out of 206 empirical studies regarding UEM comparisons were selected. Empirical evidence was extracted from these studies, coded and aggregated in order to discover which UEMs have been proven to be more effective than others. This systematic review provided some implications for research and practice. For researchers, the review identifies two main issues:
There is a clear need for more empirical studies comparing Web usability evaluation methods, not only in number but also in quality. This limitation is in line with the systematic review performed in the Web Engineering field by Mendes (2005), in which it is claimed that the majority of empirical studies cannot be considered to be methodologically rigorous. There is a need for a standard effectiveness measure for the comparison of Web usability evaluation methods. This is in line with studies performed in the Software Engineering field such as those of Gray and Salzman (1998) and Hartson et al. (2003) in which it is claimed that most of the experiments based on comparisons of usability evaluation methods do not clearly identify which aspects of these methods are being compared.
For practitioners, this review shows empirical evidence of UEMs which can be proven to be effective for evaluating the usability of Web applications. However, one important task for practitioners is not only to compare results from different UEMs, but also to collect data concerning the employment of the UEMs which can then be used to assess the usability of the UEM itself. This data may be very useful in detecting deficiencies and in re-designing evaluation methods in order for them to be more effective. 267
Conclusions 8.1.2 Goal 2: Study of standards for software product quality evaluation With regard to this goal, we investigated various models that may be useful in addressing Web usability evaluation, in particular those proposed in processoriented standards (ISO/IEC 9241 and ISO/IEC 13407) and product-oriented standards (ISO/IEC 9126 and ISO/IEC 14598). These ISO/IEC standards were not designed from the same perspective since they propose different definitions of the concept of usability. For instance, the usability model from ISO/IEC 9241-11 and the evaluation process from ISO/IEC 14000 were developed by experts from the field of Human-Computer Interaction, whereas the usability model from ISO/IEC 9126 and the evaluation process from ISO/IEC 14598 were developed by experts from the Software Engineering field. However, these definitions given by experts and researchers are now beginning to be harmonized thanks to the creation of the new standard series: ISO/IEC 25000 SQuaRE standard. SQuaRE states that usability can either be specified or measured as a product quality characteristic in terms of its subcharacteristics, or specified or measured directly by measures that are a subset of quality in use. This is a positive aspect since usability can be considered both in the early stages of development and in specific end-user contexts. We realized that the recommendations in these standards are too generic. They propose usability sub-characteristics which are too abstract to be directly measurable and there are no guidelines as regards the integration of the evaluation process into different development processes. The usability/quality models and evaluation processes proposed in these standards should therefore be extended and/or adapted in order to take into account the specific characteristics of Web applications. After reviewing several Web usability evaluation approaches which employ a usability/quality based on standards, we have identified two issues:
There is a shortage of Web usability evaluation approaches that are able to address Web usability not only when the Web application is implemented, but also at earlier stages of development, such as the analysis and design stages. There is a shortage of Web usability evaluation approaches which are based on the new SQuaRE standard series in order to benefit from the definition of usability which brings together both definitions from the fields of Human-Computer Interaction and Software Engineering.
The main problem would appear to be that most Web development processes do not take advantage of the intermediate artifacts that are produced during early stages of the Web development process (i.e., requirements and design stages). These intermediate artifacts (e.g., navigational models, abstract user 268
8.1 Conclusions interface models, dialog models) are mainly used to guide developers and to document the Web application. Since the traceability between these artifacts and the final Web application are not well-defined, performing evaluations using these artifacts can be difficult. In order to address this issue, usability evaluations should be integrated into the Web development process whose intermediate artifacts can be effectively evaluated. For instance, a suitable context would be model-driven Web development processes in which models (intermediate artifacts) that specify an entire Web application are applied in all the steps of the development process, and the final source code is automatically generated from these models. The evaluation of these models can provide early usability evaluation reports in order to suggest changes that can be directly reflected in the source code. 8.1.3 Goal 3: Analysis of usability evaluation approaches based on model-driven Web development With regard to this goal, we have provided a brief background to existing model-driven Web development methods and have analyzed the existing approaches that address usability evaluation in this paradigm. Several model-driven Web development processes have been analyzed in order to attain a better understanding of their stages and the type of Web artifacts proposed. Basically, a model-driven Web development method provides models as an outcome of each stage of the Web development process.
With regard to the Requirements Elicitation stage, we realized that the Computation-Independent Models (CIMs) are mainly based on business processes with a higher level of abstraction (e.g., use cases). With regard to the Analysis and Design stage, we realized that the Platform-Independent Models (PIMs) are mainly based on the three most-common perspectives of a Web application: content (e.g., class diagrams), navigation (e.g., navigational models), and presentation (e.g., abstract user interfaces). With regard to the Model Transformation stage, we realized that Platform-specific Models (PSMs) can be obtained and edited by the Web developer (e.g., database scripts, concrete user interfaces). This means that the development method follows an elaborationist approach (McNeile 2003). On the other hand, Platform-specific Models (PSMs) can be embedded inside the model compiler in order to provide PIM to CM transformations. This means that the development method follows a translationist approach (McNeile 2003). The latter would appear to be the most common approach. 269
Conclusions
With regard to the Code Generation stage, we realized that Code models (CMs) are obtained as an outcome of the model compiler. Several development methods provide a tool which implements this model compiler and also offer guidance to developers in order to cover as many development stages in the process as possible.
Finally, the existing approaches used to address usability evaluations in modeldriven Web development methods are the first steps in this research line in order to provide early usability evaluations. However, we realized that:
The concept of Web usability is still partially supported in these approaches. There is no generic usability evaluation process that can be integrated into different model-driven Web development processes.
8.1.4 Goal 4: Definition of a Web Usability Model With regard to this goal, we defined a Web Usability Model based on the usability model for generic software products proposed in Abrahão and Insfran (2006). This model has been extended and adapted to Web-oriented products in compliance with the ISO/IEC 25000 SQuaRE standard. The Web Model Usability considers the usability sub-characteristics proposed in the ISO/IEC 25000 SQuaRE standard, (i.e., ISO/IEC 25010 which references both the Software Product Quality Model and the Quality in Use Model). These sub-characteristics were broken down into other sub-characteristics and attributes in order to cover a set of Web usability aspects that would be as broad as possible. This breakdown was realized by considering the ergonomic criteria proposed in Bastien and Scapin (1993) and the usability guidelines for Web development such as those of Lynch and Horton (2002) and Leavit and Shneiderman (2009). These works helped us to identify new sub-characteristics and attributes that can be considered relevant for Web applications. On the other hand, the adaptation of the Web Usability Model according to the ISO/IEC 25000 SQuaRE standard (2005) has highlighted the need to consider the two usability perspectives: usability of a Web application from the perspective of a software product (i.e., usability product), usability of the Web application from the perspective of user interaction in a specific context (i.e., usability in use). These perspectives are aimed at providing the concept of Usability with comprehensive support by encompassing the definitions proposed by both fields: Software Engineering and Human-Computer Interaction.
270
8.1 Conclusions Finally, Web metrics proposed in the existing literature (e.g., Calero et al. 2005) were studied in order to provide a generic definition of each metric that can be operationalized in Web artifacts of different abstraction levels and from different model-driven Web development methods. Each metric was associated with a single attribute with the aim of discovering usability problems based on the values obtained after metric calculation. This also helps to quantify how the attribute attached to these metrics affects the usability level of the Web application. 8.1.5 Goal 5: Definition of a generic Web Usability Evaluation Process With regard to this goal, we have stated the core idea of integrating usability evaluations during several stages of model-driven Web development processes, which is supported by a Web Usability Evaluation Process (WUEP). WUEP provides the concept of usability with broad support since its underlying Web Usability Model has been extended and adapted to the Web domain by considering the new ISO/IEC 25000 series of standards (SQuaRE), along with several usability guidelines. The explicit definition of the WUEP activities and artifacts also provides evaluators with more guidance and offers the possibility of automating (at least to some extent) several activities in the evaluation process by means of a process automation tool. We believe that the inherent features of model-driven Web development processes (e.g., traceability between models by means of model transformations) provide a suitable environment in which to perform usability evaluations. The integration of WUEP into these environments is thus based on the evaluation of artifacts, particularly intermediate artifacts (models), at several abstraction levels from different model-driven Web development processes. The aim of applying metrics was to reduce the subjectivity inherent in existing inspection methods. It is important to note that by applying metrics, the evaluators inspect these artifacts in order to detect problems related to the usability for end-users but not related to the usability of model-driven artifacts themselves. The evaluation of these models (by considering the traceability among them) therefore allows the source of the usability problem to be discovered and facilitates the provision of recommendations to correct these problems during the earlier stages of the Web development process. This signifies that if the usability of an automatically generated user interface can be assessed, the usability of any future user interface produced by model-driven Web development processes could be predicted. In other words, we are referring to a user interface that can, at least to some extent, be usable by construction (Abrahão et al. 2007). Usability can thus be taken into consideration throughout the entire Web development process. This enables 271
Conclusions better quality Web applications to be developed, thereby reducing effort at the maintenance stage. 8.1.6 Goal 6: Instantiation of the Web Usability Evaluation Process With regard to this goal, WUEP was instantiated in two different model-driven Web development processes (OO-H and WebML) in order to show the feasibility of integrating usability evaluations at several stages of these Web development processes. We conducted two case studies: the usability evaluation of the Task Manager Web application developed by using OO-H, and the usability evaluation of the ACME store developed by using WebML. The experience obtained during these instantiations allowed us to learn various lessons. As positive aspects we can point out that:
It is possible to detect several usability problems at early stages of a model-driven Web development process. Usability can thus be considered throughout the entire Web development process. Traceability among models allows us to detect usability problems and to offer recommendations in order to correct them. The operationalization of metrics allows WUEP to be applied not only to different model-driven Web development processes but also to traditional Web development processes. It is possible to discover limitations in the expressiveness of platformindependent models and the transformation rules in order to support usability attributes.
However, we also detected certain aspects that need to be improved:
272
The manual application of measures may be a tedious task in some cases. This can be alleviated by developing a tool to support not only the calculation of the measures, but also the management of usability evaluations plans. Although the aim of WUEP is also to reduce the subjectivity inherent in existing usability inspection methods, some measures have a certain degree of subjectivity. This can be alleviated by providing more guidelines in order to reduce the variation of the values obtained. Despite the fact that usability evaluations do not require the operationalization of all the measures and that these operationalized measures can be reused in further evaluations, it has been detected that the operationalization of measures is the most complex task of the
8.1 Conclusions evaluation design. This can be alleviated by anticipating a repository of measures that have been operationalized beforehand. 8.1.7 Goal 7: Empirical validation of the Web Usability Evaluation Process This chapter has reported the results of the empirical validation aimed at evaluating participants’ effectiveness, efficiency, perceived ease of use, and perceived satisfaction of use when using WUEP in comparison to a widelyused industrial inspection method based on heuristics: Heuristic Evaluation (HE). The results of the quantitative analysis showed that WUEP was more effective and efficient than HE in the detection of usability problems in artifacts obtained from two concrete model-driven Web development processes (i.e., OO-H and WebML). In the particular case of the OO-H method, these results were supported by a meta-analysis that was performed in order to aggregate empirical findings from each individual experiment. The low ratio of false positives obtained by WUEP suggests that the use of metrics as part of the evaluation process reduces the degree of subjectivity in the evaluation of Web artifacts. The low ratio of replicated problems can be explained by the fact that WUEP provides operationalized metrics which are specifically tailored to each type of artifact in the Web development process, thus reducing the subjectivity associated with generic rules that relies on the experience of the evaluator. In addition, with regard to the evaluators’ perceptions, the participants were more satisfied when they applied WUEP (although this was only statistically significant when it was instantiated in OO-H), and they also found it easier to use than HE. The results of the qualitative analysis also suggest that WUEP could be greatly improved with a tool that automates most of the tasks involved in the method, including the calculation of certain metrics and allowing the generation of usability reports. From a research perspective, the family of experiments in OO-H and the controlled experiment in WebML were a valuable means to obtain feedback with which to improve our Web Usability Evaluation Process. To the best of our knowledge, this is the first empirical study to provide evidence of the usefulness of a usability evaluation method for a model-driven Web development process. The intention of these empirical studies is to contribute to Web Engineering research through the proposal of a well-defined framework that can be reused by other researchers in the empirical validation of their Web usability evaluation methods. 273
Conclusions From a practical perspective, we are aware that our empirical studies only provide preliminary results on the usefulness of our Web Usability Evaluation Process in practice. Although the experimental results provided good results as regards the performance of our usability inspection method for Web applications developed using model-driven development, these results need to be interpreted with caution since they are only valid within the context established in this family of experiments. There is a need for more empirical studies with which to test our proposal in other settings. Nevertheless, this empirical validation has value as the first studies with which to test the integration of usability evaluations into model-driven Web development processes.
8.2 Related publications The work related to this PhD thesis was published in two international journals, two book chapters, six international conferences, two international workshops, and one national conference. 8.2.1 Refereed International Indexed Journals (JCR):
Fernandez, A., Insfran, E., Abrahão, S., Usability Evaluation Methods for the Web: A Systematic Mapping Study, Information and Software Technology 53 (2011) 789–817, Impact Factor 1.821 (JCR 2009), ISBN 0950-5849, Elsevier. DOI: 10.1016/j.infsof.2011.02.007. Fernandez, A., Abrahão, S., Insfran, E. Empirical Validation of a Usability Inspection Method for Model-Driven Web Development, Journal of Systems and Software (2012), Impact Factor 1.282 (JCR 2010) ISBN 0164-1212, Elsevier. DOI: 10.1016/j.jss.2012.07.043.
8.2.2 Book Chapters
274
Abrahão, S., Insfran, E., Fernandez, A. Designing Highly Usable Webbased Applications. Computing Handbook Set (3rd Edition), Information Systems and Information Technology (Volume 2), Chapman and Hall/CRC Press, 2012 (to appear). Fernandez, A., Insfran, E., Abrahão, S. A SQUARE-based Web Usability Model for Model-Driven Development Processes. In: Quality of Software Products and Processes, Ra-Ma Publishers, ISBN 97884-7897-961-5, pp. 621-653, 2010 (in Spanish).
8.2 Related publications 8.2.3 Refereed International Conferences
Fernandez, A., Abrahão, S., Insfran, E., Matera, M. Further Analysis on the Validation of a Usability Inspection Method for Model-Driven Web Development. 6th International Symposium on Empirical Software Engineering (ESEM 2012), September 19-20, 2012, Lund, Sweden. Fernandez, A., Abrahão, S., Insfran, E. A Systematic Review on the Effectiveness of Web Usability Evaluation Methods, 16th International Conference on Evaluation & Assessment in Software Engineering (EASE 2012), Ciudad Real, Spain, May 14-15, 2012. Fernandez, A., Montero, E., Insfrán, E., Abrahao, S., Carsí, J.A. Early Usability Evaluation in Model-Driven Video Game Development, 11th International Conference on Software Engineering Research and Practice (SERP 2012), July 16-19, 2012, Las Vegas, USA. Insfrán, E., Cedillo, I., Fernandez, A., Abrahao, S., Matera, M. Evaluating the Usability of Mashups Applications. 8th International Conference on the Quality of Information and Communications Technology (QUATIC 2012), Lisbon, Portugal, 3-6 September 2012, IEEE Computer Society. Fernandez, A., Montero, E., Insfrán, E., Abrahao, S., Carsí, J.A. Integrating Usability Evaluation into Model-Driven Video Game Development, 4th International Conference on Human-Centred Software Engineering (HCSE 2012), October 29-31, 2012, Toulouse, France. Cappiello, C., Matera, M., Picozzi, M., Daniel, F., Fernandez, A. Quality-Aware Mashup Composition: Issues, Techniques and Tools. 8th International Conference on the Quality of Information and Communications Technology (QUATIC 2012), Lisbon, Portugal, 3-6 September 2012, IEEE Computer Society. Fernandez, A., Abrahão, S., Insfran, E. A Web Usability Evaluation Process for Model-Driven Web Development, 23rd International Conference on Advanced Information Systems Engineering (CAiSE 2011), London, United Kingdom, LNCS 6741, pp. 108-122, Springer 2011. Fernandez, A., Abrahão, S., Insfran, E. Towards to the Validation of a Usability Evaluation Method for Model-Driven Web Development, Proceedings of the ACM/IEEE 4th Empirical Software Engineering and Measurement conference (ESEM 2010), September 16-17, 2010 Bolzano-Bozen, Italy, Article no. 54. 275
Conclusions
Fernandez, A., Insfran, E., Abrahão, S. Integrating a Usability Model into a Model-Driven Web Development Process, Proceedings of the 10th International Conference on Web Information Systems Engineering (WISE 2009), Poznan, Poland, LNCS 5802, ISBN 978-3642-04408-3, Springer 2009, pp. 497-510.
8.2.4 Refereed International Workshops
Fernandez, A., Insfran, E., Abrahão, S. Towards a Usability Evaluation Process for Model-Driven Web Development, Proceedings of the 2nd International Workshop on the Interplay between Usability Evaluation and Software Development (I-USED 2009), co-located with INTERACT 2009, Upssala, Sweden, August 24th, 2009, CEURWS.org 2009. Insfran, E., Fernandez, A. A Systematic Review of Usability Evaluation in Web Development. Proceedings of the International Workshop on Web Usability and Accessibility (IWWUA 2008) co-located with the 9th International Conference on Web Information Systems Engineering (WISE 2008), Auckland, New Zealand, Lecture Notes in Computer Science 5176, Springer (2008), pp. 81-91.
8.2.5 Refereed National Conferences
Fernandez, A., Abrahão, S., Insfran, E. Usability in Model-Driven Web: Results from a Controlled Experiment, 15th Spanish Conference on Software Engineering and Databases (JISBD 2010), Valencia, Spain, Sept 2010 (in spanish).
8.2.6 Refereed Ibero-american Conferences
Fernandez, A., Insfran, E., Abrahão, S. Usability Evaluation for Web Applications, Proceedings of the 36th Latin-American Conference on Informatics (CLEI 2010), ISBN: 978-99967-612-0-1, Asunción, Paraguay, October 2010. (In Spanish)
8.2.7 Ongoing papers Fernandez, A., Abrahão, S., Insfran, E., Matera, M. Early Usability Evaluation in Model-driven Web Development: Experiences with WebML. Journal of Systems and Software (2012), Impact Factor 1.282 (JCR 2010) ISBN 0164-1212, Elsevier.
276
8.3 Research stays 8.2.8 Summary and quality of the publications: Table 8.1 summarizes all the publications by highlighting their evidences of quality. Table 8.1. Publications of this PhD Thesis Publications in: International Journals International Conferences
International Workshops Book chapters National Conferences Ibero-american Conferences
Indexed JCR CORE A CORE C CiteseerX Total
Number 2 5 1 3 1 1 2 1 1 17
Venues IST, JSS WISE, CAiSE, EASE, ESEM (x2) SERP QUATIC (x2), HCSE IWWUA I-USED JISBD CLEI
8.3 Research stays
Pre-doctoral research stay at the WebML group, Department of Electronics and Information - Politecnico di Milano, Milan, Italy, hosted by Dra. Maristella Matera, from February to July 2011 (6 months). Granted by the Spanish Ministry of Science and Innovation (under the FPU program). Recently granted: Post-doctoral research stay at the North Caroline State University, hosted by Dr. Munindar P. Singh, and to be held from December 2012 to May 2013 (6 months). Granted by the TEE project (Transatlantic Partnership for Excellence in Engineering), an Erasmus Mundus-Action 2 Project funded by the European Commission.
8.4 Grants awarded
Pre-doctoral grant (2008-2012): Programa de Formación de Personal Universitario (FPU program) funded by the Spanish Ministry of Science and Education. Ref. (AP2007-03731). The journal article: “Fernandez, A., Insfran, E., Abrahão, S., Usability Evaluation Methods for the Web: A Systematic Mapping Study, Information and Software Technology 53 (2011) 789–817” was ranked as one of the most downloaded articles of this journal (15/25) during the year 2011: http://top25.sciencedirect.com/journal/09505849/ 277
Conclusions
8.5 Future research directions This thesis is not the end of research efforts in this area. Many research activities are currently underway, and further research is ongoing in different and complementary directions. The main issues currently being addressed are:
278
The improvement of our approach by: o Developing a tool with the capability of automating a large part of the usability evaluation process o Determining the most relevant usability attributes for different families of Web applications according to Web domain experts in order to provide pre-defined selections of operationalized measures. o Performing analyses of the impact on how the attributes affect (negatively or positively) other attributes of the Web Usability Model. o Instantiating WUEP to more well-known model-driven Web development processes. o Performing more controlled experiments in order to empirically validate our proposal in other experimental settings (e.g., new kinds of participants such as practitioners from industry with different levels of experience). o Analyzing different proposals concerning the inclusion of aggregation mechanisms to merge values from metrics in order to provide scores for usability attributes that will allow different Web applications from the same family to be compared The extension of our approach in order to: o Apply it to the evaluation of the usability of the new generation of Web applications: Mashups, Rich Internet Applications (RIA), Cloud computing and service-oriented Web applications concerning the analysis, design and integration of business parties. This last extension will be supported by the postdoctoral research stay granted at the North Caroline State University. o Apply it to other domains in which usability is also considered to be an important factor, such as video game development. o Include the concept of user experience in order to evaluate aspects beyond usability by considering more specifics user contexts.
Figure Index Figure 1.1. Summary of research design ............................................................................. 10 Figure 1.2. The Systematic Mapping process [source: (Budgen et al. 2008)] ..................... 12 Figure 1.3. The Systematic Literature Review Process ........................................................ 14 Figure 1.4. Overview of the experiment process .................................................................. 16 Figure 2.1. Mapping results obtained from research sub-questions combinations (I) ........ 47 Figure 2.2. Mapping results obtained from research sub-questions combinations (II) ....... 48 Figure 2.3. Number of publications on Web usability by year and source .......................... 49 Figure 2.4. Relative increase means associated to related research fields.......................... 50 Figure 3.1. User-Centered Design process .......................................................................... 69 Figure 3.2. Quality in the life cycle from ISO/IEC 9126...................................................... 71 Figure 3.3. Evaluation process view according to ISO/IEC 14598-1 .................................. 73 Figure 3.4. Software product quality reference model according to SQuaRE ..................... 75 Figure 3.5. Quality models perspectives according to SQuaRE .......................................... 76 Figure 4.1. Chronological overview of model-driven Web development methods ............... 87 Figure 4.2. Overview of a generic Model-driven Web development process ....................... 96 Figure 5.1. Integrating usability evaluations in Model-driven Web development ............. 102 Figure 5.2. Core idea of representing processes in SPEM 2.0 .......................................... 120 Figure 5.3. Key terminology mapped onto Method Content vs. Process in SPEM 2.0 ...... 120 Figure 5.4. Overview of the Web Usability Evaluation Process (WUEP) ......................... 123 Figure 5.5. WUEP stage 1: Establishment of Evaluation Requirements ........................... 125 Figure 5.6. WUEP Stage 2: Specification of the Evaluation ............................................. 127 Figure 5.7. WUEP Stage 3: Design of the Evaluation ....................................................... 129 Figure 5.8. WUEP Stage 4: Execution of the Evaluation .................................................. 130 Figure 5.9. WUEP Stage 5: Analysis of Changes .............................................................. 131 Figure 6.1. Overview of the Object-Oriented Hypermedia process ................................... 137 Figure 6.2. Use Case model for TaskManager .................................................................. 151 Figure 6.3. Class diagram for TaskManager ..................................................................... 152 Figure 6.4. NAD0: First level NAD for TaskManager ....................................................... 154 Figure 6.5. APD0: APD associated with NAD0 ................................................................ 155 Figure 6.6. NAD1: NAD for task management .................................................................. 156 Figure 6.7. APD1: APD associated with NAD1 ................................................................ 158 Figure 6.8. NAD2: NAD for contact management ............................................................. 159 Figure 6.9. APD2: APD associated with NAD2 ................................................................ 160 Figure 6.10. NAD3: NAD for report management ............................................................. 161 Figure 6.11. APD3: APD associated with NAD3 .............................................................. 162 Figure 6.12. Representation of Tlayout template ............................................................... 163 Figure 6.13. FUI0: Final User Interface for login ............................................................ 164 Figure 6.14. FUI1: Final User Interface for task management ......................................... 164 Figure 6.15. FUI2: Final User Interface for contact management .................................... 165 Figure 6.16. FUI3: Final User Interface for report management ..................................... 166 Figure 6.17. FUI0 displayed by different Web browsers ................................................... 184 Figure 6.18. Changes to the Class Model .......................................................................... 185 Figure 6.19. Changes in the Navigational Access Diagrams ............................................ 186 Figure 6.20. Changes in the Abstract Presentation Diagrams .......................................... 187
279
Figure 6.21. HM1: Hypertext Model for the Potential costumer perspective. ...................195 Figure 6.22. HM2: Hypertext Model for the Website administrator perspective ...............196 Figure 6.23. Changes in both Hypertext Models: HM1 and HM2 .....................................202 Figure 7.1. Overview of the Heuristic Evaluation process ................................................217 Figure 7.2. Overview of the family of experiments .............................................................227 Figure 7.3. Boxplots for the Effectiveness variable ............................................................235 Figure 7.4. Boxplots for the Efficiency variable ................................................................236 Figure 7.5. Boxplots for the Perceived Ease of Use variable ............................................237 Figure 7.6. Boxplots for the Perceived Satisfaction of Use variable .................................238 Figure 7.7. Meta-analysis for all the dependent variables .................................................244 Figure 7.8. Boxplots for the dependent variables ..............................................................253
280
Table Index Table 2.1. Research sub-questions ....................................................................................... 27 Table 2.2. Search string applied .......................................................................................... 29 Table 2.3. Results of the conducting stage ........................................................................... 35 Table 2.4. Results of the systematic mapping ....................................................................... 36 Table 2.5. Usability evaluation methods that may be of interest to practitioners ................ 55 Table 2.6. UEMs evaluated in the empirical studies ............................................................ 61 Table 2.7. Effectiveness measures employed ....................................................................... 62 Table 2.8. Evidences extracted and aggregated................................................................... 63 Table 3.1. Stakeholder views of quality in use ..................................................................... 77 Table 5.1. Breakdown of the Appropriateness recognizability sub-characteristic............. 106 Table 5.2. Breakdown of the Learnability sub-characteristic ............................................ 108 Table 5.3. Breakdown of the Operability sub-characteristic ............................................. 109 Table 5.4. Breakdown of the User protection sub-characteristic....................................... 110 Table 5.5. Breakdown of the Accessibility sub-characteristic ........................................... 111 Table 5.6. Breakdown of the User interface aesthetics sub-characteristic ........................ 112 Table 5.7. Breakdown of the Compliance sub-characteristic ............................................ 112 Table 5.8. Breakdown of the Effectiveness in Use sub-characteristic ................................ 113 Table 5.9. Breakdown of the Efficiency in Use sub-characteristic .................................... 114 Table 5.10. Breakdown of the Satisfaction in Use sub-characteristic ................................ 115 Table 5.11. Breakdown of the Compliance in Use sub-characteristic ............................... 116 Table 5.12. Modeling primitives used to model processes in SPEM 2.0. ........................... 121 Table 6.1. NAD modeling primitives in OO-H ................................................................... 138 Table 6.2. Operationalized measures for OO-H ................................................................ 141 Table 6.3. Template used to report usability problems ...................................................... 170 Table 6.4. Usability report for usability problem P01 ....................................................... 172 Table 6.5. Matrix of converted distances for NAD0 ........................................................... 174 Table 6.6. Usability report for usability problem P02 ....................................................... 175 Table 6.7. Usability report for usability problem P03 ....................................................... 176 Table 6.8. Usability report for usability problem P04 ....................................................... 177 Table 6.9. Usability report for usability problem P05 ....................................................... 179 Table 6.10. Usability report for usability problem P06 ..................................................... 180 Table 6.11. Usability report for usability problem P07 ..................................................... 181 Table 6.12. Usability report for usability problem P08 ..................................................... 181 Table 6.13. Usability report for usability problem P09 ..................................................... 182 Table 6.14. Usability report for usability problem P10 ..................................................... 183 Table 6.15. Usability report for usability problem P11 ..................................................... 184 Table 6.16. WebML Hypertext modeling primitives........................................................... 190 Table 6.17. Operationalized measures for WebML ........................................................... 192 Table 6.18. Usability report for usability problem UP001 ................................................ 199 Table 6.19. Usability report for usability problem UP002 ................................................ 199 Table 6.20. Usability report for usability problem UP003 ................................................ 200 Table 6.21. Usability report for usability problem UP004 ................................................ 200 Table 6.22. Usability report for usability problem UP005 ................................................ 201 Table 7.1. Closed-questions to evaluate both subjective dependent variables ................... 220
281
Table 7.2. Experimental design schema .............................................................................222 Table 7.3. Experimental objects .........................................................................................223 Table 7.4. Hypotheses for the influence in the order of independent variables .................228 Table 7.5. Planning for the Original Experiment (EXP) ....................................................230 Table 7.6. New closed-questions added to the questionnaire .............................................231 Table 7.7. Planning for the Second Experiment (REP1) ....................................................232 Table 7.8. Overall Results of the Usability Evaluations.....................................................234 Table 7.9. p-values for the influence of order of the independent variables ......................239 Table 7.10. Summary of the results of the family of experiments .......................................240 Table 7.11. Hedges’ metric values for all the dependent variables ...................................243 Table 7.12. Experimental objects .......................................................................................246 Table 7.13. Planning for the controlled experiment ...........................................................250 Table 7.14. Overall results of the usability evaluations .....................................................252 Table 7.15. Shapiro-Wilk Normality test results ................................................................252 Table 7.16. p-values obtained for the Influence of order of both independent variables ...255 Table 7.17. Cronbach’s alphas for the reliability of questionnaires ..................................260 Table 8.1. Publications of this PhD Thesis ........................................................................277
282
Acronym List APD ASE CDL CIM CM CTP CW CWW EE ESE EYE FUI GPP HCI HE HEP HM INT IEC ISO LBT LSP MDA MDE MDD MDWD MOT NAD NDT OOHDM OO-H OO-Method OOWS PIM PSM QUE RUT SE
Abstract Presentation Diagram Automated Summative Evaluation Co-discovery Learning Computational-Independent Model Code Model Conceptual Tool for Predicting Cognitive Walkthrough Cognitive Walkthrough for the Web Expert Evaluation End-Survey Evaluation Eye-tracking Final User Interface Gerhardt-Powals Principles Human-Computer Interaction Heuristic Evaluation Heuristic Evaluation Plus Hypertext Model Interviews International Electro-technical Commission International Organization for Standardization Lab-Based Testing Logic Scoring Preference Model-Driven Architecture Model-Driven Engineering Model-Driven Development Model-Driven Web Development Metaphor of Human-Thinking Navigational Access Diagram Navigational Development Techniques Object-Oriented Hypermedia Design Method Object-Oriented Hypermedia Object-Oriented Method Object-Oriented Web Solutions Platform-Independent Model Platform-Specific Model Questionnaire Remote Usability Testing Software Engineering 283
SOHDM SQuaRE SUE TAP TUT UEM UI UWE W2000 WebML WIMP WDP WSDM WUEP
284
Scenario-based Object Hypermedia Design Methodology Software product Quality Requirements and Evaluation Systematic Usability Evaluation Think-Aloud Protocol Traditional Usability Testing Usability Evaluation Method User Interface UML-based Web Engineering Web 2000 method Web Modeling Language Window, Icon, Menu, Pointing device Web Design Perspectives Web Site Design Method Web Usability Evaluation Process
PART VII Appendix
Appendix A.
Systematic research methods sources
This appendix is structured as follows. Section A.1 collects the papers included in the systematic mapping study and the selected ones for the systematic review. Section A.2 presents the template form for the quality assessment and data extraction in both systematic studies. Finally, Section A.3 provides more details about the classification performed in the systematic mapping study and about the process performed in the systematic review.
A.1. Primary studies selected The papers included in the systematic mapping study are presented using the following format: [Id Study] Reference [Bibliographic Source]: [S01] Aberg, J. and Shahmehri, N. 2001. “An empirical study of human Web assistants: implications for user support in Web information systems”. Proc. of the SIGCHI Conference on Human Factors in Computing Systems (CHI’01), pp. 404-411. [ACM] [S02] Ahn, J.; Brusilovsky, P.; He, D.; Grady, J. and Li, Q. 2008. “Personalized Web Exploration with Task Models”. Proc. of the 17th international conference on World Wide Web (WWW '08), pp. 1-10. [WWW] [S03] Allen, M.; Currie, L.; Bakken, S.; Patel, V. and Cimino, J. 2006. “Heuristic evaluation of paper-based Web pages: A simplified inspection usability methodology”. Journal of Biomedical Informatics, Volume 39, Issue 4, pp. 412-423. [SD] [S04] Alonso-Rios, D.; Luis-Vazquez, I.; Mosqueira-Rey, E.; Moret-Bonillo, V. and Del Rio, B.B. 2009. "An HTML analyzer for the study of web usability," Proc. of the IEEE International Conference on Systems, Man and Cybernetics (SMC 2009), pp.1224-1229. [IEEEx] [S05] Alshamari, M. and Mayhew, P. 2008. “Task Design: Its Impact on Usability Testing”. Proc. of the Third International Conference on Internet and Web Applications and Services (ICIW '08), pp. 583-589. [IEEEx] [S06] Alva, M.; Martínez, A.; Cueva, J.M; Sagástegui, C. and López, B. 2003. “Comparison of Methods and Existing Tools for the Measurement of Usability in the Web”. Proc. of the 3rd International Conference on Web Engineering (ICWE’03), pp. 386-389.[ICWE] [S07] Al-Wabil, A. and Al-Khalifa, H. 2009. "A framework for integrating usability evaluations methods: The Mawhiba web portal case study". Proc. of the International Conference on the Current Trends in Information Technology (CTIT’09), pp.1-6. [IEEEx] [S08] Anandhan, A.; Dhandapani, S.; Reza, H. and Namasivayam, K. 2006. “Web Usability Testing - CARE Methodology”. Proc. of the Third International Conference on Information Technology: New Generations (ITNG’06), pp.495-500. [IEEEx]
287
[S09] Ardito, C.; Lanzilotti, R.; Buono, P. and Piccinno, A. 2006. “A tool to support usability inspection”. Proc. of the Working Conference on Advanced Visual Interfaces (AVI '06), pp. 278-281. [ACM] [S10] Arroyo, E.; Selker, T. and Wei, W. 2006. “Usability tool for analysis of web designs using mouse tracks”. Proc. of the Conference on Human Factors in Computing Systems, pp. 484-489. [ACM] [S11] Atterer, R. and Schmidt, A. 2005. “Adding Usability to Web Engineering Models and Tools”. Proc. of the 5th International Conference on Web Engineering (ICWE’05), pp. 36-41 [ICWE] [S12] Atterer, R.; Wnuk, M. and Schmidt, A. 2006. “Knowing the user's every move: user activity tracking for website usability evaluation and implicit interaction”. Proc. of the 15th international conference on World Wide Web (WWW’06), pp. 203-212. [WWW] [S13] Atterer, R. and Schmidt, A. 2007. “Tracking the interaction of users with AJAX applications for usability testing”. Proc. of the SIGCHI conference on Human factors in computing systems (CHI’07), pp. 1347-1350. [ACM] [S14] Bachiochi, D.; Berstene, M.; Chouinard, E.; Conlan, N.; Danchak, M.; Furey, T.; Neligon, C. and Way, D. 1997. “Usability studies and designing navigational aids for the World Wide Web”. Computer Networks and ISDN Systems, Vol. 29, Issues 8-13, pp. 1489-1496. [SD] [S15] Badre, A. and Jacobs, A. 1999. “Usability, aesthetics, and efficiency: an evaluation in a multimedia environment”. Proc. of IEEE International Conference on Multimedia Computing and Systems, Vol.1, pp.103-106. [IEEEx] [S16] Bartell, A.L. 2005. “Using content analysis and Web design heuristics to evaluate informational Web sites: an exploratory study”. Proc. of the International Professional Communication Conference (IPCC’05), pp. 771-777. [IEEEx] [S17] Basu, A. 2003. “Context-driven assessment of commercial Web sites”. Proc. of the 36th Annual Hawaii International Conference on System Sciences (HICSS’03), pp. 8-15. [IEEEx] [S18] Batra, S.; Bishu, R.R. 2007. “Web usability and evaluation: issues and concerns”. Proc. of the 2nd international conference on Usability and internationalization (UI-HCII'07), pp. 243-249 [ACM] [S19] Becker, S.A. and Berkemeyer, A. 2002. “Rapid application design and testing of Web usability”. IEEE Multimedia, vol. 9, no. 4, pp. 38-46. [IEEEx] [S20] Becker, S.A. and Mottay, F.E. 2001. “A global perspective on Web site usability”. IEEE Software, vol. 18, no. 1, pp. 54-61. [IEEEx] [S21] Bednarik, R.; Gerdt, P.; Miraftabi, R. and Tukiainen, M. 2004. “Development of the TUP model - evaluating educational software”. Proc. of the IEEE International Conference on Advanced Learning Technologies (ICALT’04), pp. 699-701. [IEEEx] [S22] Bevis, K.J. and Henke, K.A. 2008. “Evaluating usability in an information product”. Proc. of the IEEE International Professional Communication Conference (IPCC’08), pp.1-5. [IEEEx]
288
[S23] Blackmon, M.H.; Polson, P.G.; Kitajima, M. and Lewis, C. 2002. “Cognitive walkthrough for the web”. Proc. of the SIGCHI conference on Human factors in computing systems (CHI’02), pp. 463-470. [ACM] [S24] Blackmon, M.H.; Kitajima, M. and Polson, P.G. 2003. “Repairing usability problems identified by the cognitive walkthrough for the web”. Proc. of the SIGCHI conference on Human factors in computing systems (CHI’03), pp. 497-504. [ACM] [S25] Blackmon, M.H.; Kitajima, M. and Polson, P.G. 2005. “Tool for accurately predicting website navigation problems, non-problems, problem severity, and effectiveness of repairs”. Proc. of the SIGCHI conference on Human factors in computing systems (CHI’05), pp. 31-40. [ACM] [S26] Blake, C.T. and Rapanotti, L. 2004. "Usability evaluation of distributed groupware in distance learning". Proc. of the Fifth International Conference on Information Technology Based Higher Education and Training (ITHET’04), pp. 500-504. [IEEEx] [S27] Bojko, A. 2006. “Using Eye Tracking to Compare Web Page Designs: A Case Study”. Journal of Usability Studies, Vol. 1, Issue 3, pp. 112-120. [JUS] [S28] Bok-Lee, K. and Grice, R.A. 2003. “An adaptive viewing application for the web on personal digital assistants”. Proc. of the 21st annual international conference on Documentation (SIGDOC’03), pp. 125-132. [ACM] [S29] Bolchini, D.; Paolini, P. and Randazzo, G. 2003. “Adding hypermedia requirements to goal-driven analysis”. Proc. of the 11th IEEE International Requirements Engineering Conference, pp. 127-137. [IEEEx] [S30] Bolchini, D. and Garzotto, F. “Quality of Web Usability Evaluation Methods: An Empirical Study on MiLE+”. Proc. of the International Workshop on Web Usability and Accessibility (IWWUA‘07), pp. 481-492. [IWWUA] [S31] Brajnik, G. 2000. “Automatic Web Usability Evaluation: Where Need to be Done?”. Proc. of the 6th Conference on Human Factors and the Web. Available at: http://users.dimi.uniud.it/~giorgio.brajnik/papers/hfweb00.html. [Other] [S32] Brajnik, G.; Cancila, D.; Nicoli, D. and Pignatelli, M. 2005. “Do text transcoders improve usability for disabled users?”. Proc. of the International Cross-Disciplinary Workshop on Web Accessibility (W4A’05), pp. 9-17. [ACM] [S33] Burmeister, O.K. 2000. “Usability testing: revisiting informed consent procedures for testing internet sites”. Proc. of the second Australian Institute conference on Computer ethics, pp. 3-9. [ACM] [S34] Burton, C. and Johnston, L. 1998. “Will World Wide Web user interfaces be usable?”. Proc. of the Computer Human Interaction Conference (OZCHI’98), pp.39-44. [IEEEx] [S35] Burton, M.C. and Walther, J.B. 2001. “A survey of web log data and their application in use-based design”. Proc. of the 34th Annual Hawaii International Conference on System Sciences, pp. 10. [IEEEx] [S36] Cakir, C.B. and Oztaysi, B. 2009. "A model proposal for usability scoring of websites," Proc. of the International Conference on Computers & Industrial Engineering (CIE’09), pp.1418-1422. [IEEEx]
289
[S37] Cao, J.; Crews, J.M.; Nunamaker, J.F., Jr.; Burgoon, J.K. and Lin, M. 2004. “User experience with Agent99 Trainer: a usability study”. Proc. of the 37th Annual Hawaii International Conference on System Sciences, pp. 11. [IEEEx] [S38] Carstens, D.S. and Patterson, P. 2005. “Usability Study of Travel Websites”. Journal of Usability Studies, Vol. 1, Issue 1, pp. 47-61. [JUS] [S39] Chadwick-Dias, A.; McNulty, M. and Tullis, T. 2003. “Web usability and age: how design changes can improve performance”. Proc. of the Conference on Universal Usability (CUU '03), pp. 30-37. [ACM] [S40] Chandrashekar, S.; Stockman, T.; Fels, D. and Benedyk, R. 2006. “Using think aloud protocol with blind users: a case for inclusive usability evaluation methods”. Proc. of the 8th international ACM SIGACCESS conference on Computers and accessibility (Assets '06), pp. 251-252. [ACM] [S41] Chang, W.; Hon, S. and Chu, C. 2003. “A systematic framework for evaluating hyperlink validity in Web environments”. Proc. of the Third International Conference on Quality Software (QSIC’03), pp. 178-185. [IEEEx] [S42] Chatley, R.; Kramer, J.; Magee, J. and Uchitel, S. 2003. “Visual methods for Web application design”. Proc. of the IEEE Symposium on Human Centric Computing Languages and Environments (HCC’03), pp. 242-244. [IEEEx] [S43] Chattratichart, J. and Brodie, J. 2004. “Applying user testing data to UEM performance metrics”: Proc. of the Conference on Human factors in computing systems (CHI '04), pp. 1119-1122. [ACM] [S44] Cheng-ying, M. and Yan-sheng, L. 2004. “Testing and evaluation for Web usability based on extended Markov chain model”. Wuhan University Journal of Natural Sciences, Vol. 9, No. 5, pp. 687-693. [SL] [S45] Chi, E. 2002. “Improving Web Usability Through Visualization”. IEEE Internet Computing Vol. 6, Issue 2, pp. 64–71. [IEEE IC] [S46] Chi, E.; Rosien, A.; Supattanasiri, G.; Williams, A.; Royer, C.; Chow, C.; Robles, E.; Dalal, B.; Chen, J. and Cousins, S. 2003. “The bloodhound project: automating discovery of web usability issues using the InfoScent simulator”. Proc. of the SIGCHI conference on Human factors in computing systems (CHI '03), pp. 505-512. [ACM] [S47] Choros, K. and Muskala, M. 2009. “Block Map Technique for the Usability Evaluation of a Website”. Computational Collective Intelligence. Semantic Web, Social Networks and Multiagent Systems, LNCS 5796, Springer, pp. 743-751. [SL] [S48] Chou, E. 2002. “Redesigning a large and complex website: how to begin, and a method for success”. Proc. of the 30th annual ACM SIGUCCS conference on User services (SIGUCCS '02), pp. 22-28. [ACM] [S49] Chun-Long, M. and Mendes, E. 2005. “Web Usability Measurement: Comparing Logic Scoring Preference to Subjective Assessment”. Proc. of the 5th International Conference on Web Engineering (ICWE’05), pp. 53-62. [ICWE] [S50] Çınar, M.O. 2009. “Eye Tracking Method to Compare the Usability of University Web Sites: A Case Study”. Human Centered Design, LNCS 5619, Springer, pp. 671-678. [SL]
290
[S51] Clark, J.; Van Oorschot, P.C. and Adams, C. 2007. “Usability of anonymous web browsing: an examination of Tor interfaces and deployability”. Proc. of the 3rd symposium on Usable privacy and security (SOUPS '07), pp. 41-51. [ACM] [S52] Clayton, N.; Biddle, R. and Tempero, E. 2000. “A study of usability of Web-based software repositories”. Proc. of the International Conference on Software Methods and Tools (SMT’00), pp.51-58. [IEEEx] [S53] Conte, T.; Massollar, J.; Mendes, E. and Travassos, G.H. 2009. "Web usability inspection technique based on design perspectives". IET Software, Vol.3, No.2, pp.106-123. [IEEEx] [S54] Cooke, L. 2004. “Improving usability through eye tracking research”. Proc. of the International Professional Communication Conference (IPCC’04), pp.195-198. [IEEEx] [S55] Cooke, L. and Cuddihy, E. 2005. “Using eye tracking to address limitations in ThinkAloud Protocol”. Proc. of the International Professional Communication Conference (IPCC’05), pp. 653- 658. [IEEEx] [S56] Corry, M.D.; Frick, T.W. and Hansen, L. 1997. “User-centered design and usability testing of a web site: An illustrative case study”. Educational Technology Research and Development, Vol. 45, No. 4, pp. 65-76. [SL] [S57] Costabile, M.F. and Matera, M. 2001. “Guidelines for hypermedia usability inspection”. IEEE Multimedia, Vol. 8, No. 1, pp.66-69. [IEEEx] [S58] Costagliola, G. and Fuccella, V. 2009. "A visual system for analyzing user behaviour in web tasks". Proc. of the IEEE Symposium on Visual Languages and Human-Centric Computing (VL/HCC’09), pp.101-104. [IEEEx] [S59] Cuddihy, E.; Wei, C.; Barrick, J.; Maust, B.; Bartell, A.L. and Spyridakis, J.H. 2005. “Methods for assessing web design through the internet”. Proc. of the Human factors in computing systems (CHI '05), pp. 1316-1319. [ACM] [S60] Cugini, J. and Scholtz, J. 1999. “VISVIP: 3D visualization of paths through web sites”. Proc. of the International Workshop on Database and Expert Systems Applications, pp.259-263. [IEEEx] [S61] Cunliffe,D. 2000. “Developing Usable Web Sites - A Review and Model”. Internet Research Journal, Vol. 10, Issue 4, pp. 295-307. [IR] [S62] De Angeli, A.; Sutcliffe, A. and Hartmann, J. 2006. “Interaction, usability and aesthetics: what influences users' preferences?”. Proc. of the 6th Conference on Designing Interactive systems (DIS '06), pp. 271 – 280. [ACM] [S63] De Kock, E.; Van Biljon, J. and Pretorius, M. 2009. “Usability evaluation methods: mind the gaps”. Proc. of the Annual Research Conference of the South African Institute of Computer Scientists and Information Technologists (SAICSIT '09), pp. 122-131. [ACM] [S64] De Marsico, M. and Levialdi, S. 2004. “Evaluating web sites: exploiting user's expectations”. International Journal of Human-Computer Studies, Vol. 60, Issue 3, pp. 381-416. [SD]
291
[S65] De Wet, L.; Blignaut, P. and Burger, A. 2002. “Comprehension and usability variances among multicultural web users in South Africa”. Proc. of the SIGCHI Conference on Human factors in computing systems (CHI '02), pp. 526-527. [ACM] [S66] Douglas, I. 2006. “Collaborative International Usability Testing: Moving from Document-based Reporting to Information Object Sharing”. Proc. of the International Conference on Global Software Engineering (ICGSE '06), pp.114-118. [IEEEx] [S67] Duan, J. and Zhang, N. 2007. “Research on Visualization Techniques for Web Usability Analysis”. Proc. of the Eighth ACIS International Conference on Software Engineering, Artificial Intelligence, Networking, and Parallel/Distributed Computing (SNPD’07), Vol. 2, pp. 788-791. [IEEEx] [S68] El Helou, S.; Gillet, D.; Salzmann, C. and Yu, C.M. 2009. “A Study of the Acceptability of a Web 2.0 Application by Higher-Education Students Undertaking Collaborative Laboratory Activities”. Proc. of the Second International Conference on Advances in Computer-Human Interactions (ACHI '09), pp.117-125. [IEEEx] [S69] Filgueiras, L.; Martins, S.; Tambascia, C. and Duarte, R. 2009. "Recoverability Walkthrough: An Alternative to Evaluate Digital Inclusion Interfaces," Proc. of the Latin American Web Congress (LE-WEB'09), pp. 71-76. [IEEEx] [S70] Fisher, J. and Burstein, F. 2008. “Usability + usefulness = trust: an exploratory study of Australian health web sites”. Internet Research Journal, Vol. 18, No. 5, pp. 477-498. [IR] [S71] Fraternali, P. and Tisi, M. 2008. “Identifying Cultural Markers for Web Application Design Targeted to a Multi-Cultural Audience”. Proc. of the 8th International Conference on Web Engineering (ICWE’08), pp. 231-239. [ICWE] [S72] Fuhrmann, S.; Bosley, J.; Li, B.; Crawford, S.; MacEachren, A.; Downs, R. and Gahegan, M. 2003. “Assessing the usefulness and usability of online learning activities: MapStats for kids”. Proc. of the annual national conference on Digital government research (dg.o '03), pp. 1-4. [ACM] [S73] García, E.; Sicilia, M.A.; González, L.A. and Hilera, J.R. 2003. “A Concept-Based Approach for the Design of Web Usability Evaluation Questionnaires”. Web Engineering, LNCS 2722, Springer, pp. 407-410. [SL] [S74] García, F.; Lozano, M.; Montero, F.; Gallud, J.; González, P. and Lorenzo, C. 2006. “A Controlled Experiment for Measuring the Usability of WebApps Using Patterns”. Enterprise Information Systems VII, Part 5, pp. 257-264. [SL] [S75] Gee, K. 2001. “The ergonomics of hypertext narative: usability testing as a tool for evaluation and redesign”. Journal of Computer Documentation (JCD) , Vol. 25, Issue 1, pp. 3-16. [ACM] [S76] Georgiakakis, P.; Retalis, S.; Psaromiligkos, Y. and Papadimitriou, G. 2007. “Depth Toolkit: A Web-Based Tool for Designing and Executing Usability Evaluations of ESites Based on Design Patterns”. Human-Computer Interaction. Interaction Design and Usability, LNCS 4550, Springer, pp. 453-462. [SL]
292
[S77] Go, K.; Takahashi, T. and Imamiya, A. 2000. “A case study on participatory redesign of web site with scenario-based techniques”. Proc. of the Seventh International Conference on Parallel and Distributed Systems: Workshops (PADSW’00), pp.161-166. [IEEEx] [S78] González, M.P.; Lorés, J. and Granollers, A. 2007. “Assessing Usability Problems in Latin-American Academic Webpages with Cognitive Walkthroughs and Datamining Techniques”. Usability and Internationalization. HCI and Culture, LNCS 4559, Springer, pp. 306-316. [SL] [S79] Grady, H.M. 2000. “Web site design: a case study in usability testing using paper prototypes”. Proc. of Joint IEEE International Professional Communication Conference and 18th Annual Conference on Computer Documentation (IPCC/SIGDOC 2000), pp.39-45. [IEEEx] [S80] Granic, A. and Glavinic, V. 2006. “Evaluation of interaction design in web-based intelligent tutoring systems”. Proc. of the 28th International Conference on Information Technology Interfaces, pp.265-270. [IEEEx] [S81] Granic, A.; Mitrovic, I. and Marangunic, N. 2008. “Usability evaluation of web portals”. Proc. of the 30th International Conference on Information Technology Interfaces (ITI’08), pp.427-432. [IEEEx] [S82] Habuchi, Y.; Kitajima, M. and Takeuchi, H. 2008. “Comparison of eye movements in searching for easy-to-find and hard-to-find information in a hierarchically organized information structure”. Proc. of the symposium on Eye tracking research & applications (ETRA '08), pp. 131-134. [ACM] [S83] Han, M. and Park, P. 2009. “A study of interface design for widgets in web services through usability evaluation”. Proc. of the 2nd International Conference on Interaction Sciences: Information Technology, Culture and Human (ICIS '09), pp. 1013-1018. [ACM] [S84] Harper, S.; Yesilada, Y.; Goble, C. and Stevens, R. 2004. “How much is too much in a hypertext link?: investigating context and preview -- a formative evaluation”. Proc. of the fifteenth ACM conference on Hypertext and hypermedia (HYPERTEXT '04), pp. 116-125. [ACM] [S85] Harrison, T.M.; Zappen, J.P. and Watson, D. 2009. “Children's use of government information systems: design and usability”. Proc. of the 10th Annual International Conference on Digital Government Research: Social Networks: Making Connections between Citizens, Data and Government (dg.o '09), pp. 113-122. [ACM] [S86] Hart, J.; Ridley, C.; Taher, F.; Sas, C. and Dix, A. 2008. “Exploring the facebook experience: a new approach to usability”. Proc. of the 5th Nordic conference on Human-computer interaction: building bridges (NordiCHI '08), pp. 471-474. [ACM] [S87] Hart, D. and Portwood, D.M. 2009. "Usability testing of web sites designed for communities of practice: tests of the IEEE Professional Communication Society (PCS) web site combining specialized heuristic evaluation and task-based user testing". Proc of the IEEE International Professional Communication Conference (IPCC’09), pp.1-17 [IEEEx]
293
[S88] Hattori, G.; Hoashi, K.; Matsumoto, K. and Sugaya, F. 2007. “Robust web page segmentation for mobile terminal using content-distances and page layout information”. Proc. of the 16th international conference on World Wide Web (WWW '07), pp. 361370 [WWW] [S89] Hatzilygeroudis, I.; Koutsojannis, C. and Papachristou, N. 2007. “Evaluation of Usability and Assessment Capabilities of an e-Learning System for Nursing Radiation Protection”. Proc. of the Twentieth IEEE International Symposium on ComputerBased Medical Systems (CBMS '07), pp.301-306. [IEEEx] [S90] Hijon-Neira, R.; Urquiza-Fuentes, J.; Dominguez-Mateos, F. and Velazquez-Iturbide, J.A. 2007. “Assessing the Usability of a Cookies-Based Access Monitoring Tool for a CMS”. Proc. of the Seventh IEEE International Conference on Advanced Learning Technologies (ICALT’07), pp.262-264. [IEEEx] [S91] Hornbæk, K. and Frøkjær, E. 2004. “Two psychology-based usability inspection techniques studied in a diary experiment”. Proc. of the third Nordic conference on Human-computer interaction (NordiCHI '04), pp. 3-12. [ACM] [S92] Hornbæk, K. and Frøkjær, E. 2005. “Comparing usability problems and redesign proposals as input to practical systems development”. Proc. of the SIGCHI conference on Human factors in computing systems (CHI '05), pp. 391-400. [ACM] [S93] Hu, J.; Zhao, J.; Shima, K.; Takemura, Y. and Matsumoto, K. “Comparison of Chinese and Japanese in designing B2C Web pages toward impressional usability” (2001) [IEEEx] [S94] Hu, J.; Zhao, J.; Shima, K.; Takemura, Y. and Matsumoto, K. 2001. "Comparison of Chinese and Japanese in designing B2C Web pages toward impressional usability". Proc. of the Second Asia-Pacific Conference on Quality Software, pp.319-328. [IEEEx] [S95] Hvannberg, E.T.; Law, E. and Lárusdóttir, M. 2007. “Heuristic evaluation: Comparing ways of finding and reporting usability problems”. Interacting with Computers, Vol. 19, Issue 2, pp. 225-240. [SD] [S96] Iahad, N.; Dafoulas, G.A.; Kalaitzakis, E. and Macaulay, L.A. 2004. “Evaluation of online assessment: the role of feedback in learner-centered e-learning”. Proc. of the 37th Annual Hawaii International Conference on System Sciences, pp. 10. [IEEEx] [S97] Ivory, M.Y. and Hearst, M.A. 2001. “The state of the art in automating usability evaluation of user interfaces”. Computing Surveys (CSUR) , Vol. 33, Issue 4, pp. 470516. [ACM] [S98] Ivory, M.Y. and Hearst, M.A. 2002. “Improving Web Site Design”. IEEE Internet Computing, Vol. 6, Issue 2, pp. 56-63. [IEEE IC] [S99] Ivory, M.Y. and Megraw, R. 2005. "Evolution of Web Site Design Patterns". Transactions on Information Systems (TOIS), Vol. 23, Issue 4, pp. 463-497. [ACM] [S100] Jarrett, C.; Quesenbery, W.; Roddis, I.; Allen, S. and Stirling, V. 2009. “Using Measurements from Usability Testing, Search Log Analysis and Web Traffic Analysis to Inform Development of a Complex Web Site Used for Complex Tasks”. Human Centered Design, LNCS 5619, Springer, pp. 729-738. [SL]
294
[S101] Jati, H. and Dominic, D.D. 2009. "Quality Evaluation of E-government Website Using Web Diagnostic Tools: Asian Case". Proc. of the International Conference on Information Management and Engineering (ICIME '09), pp.85-89. [IEEEx] [S102] Jinling, C. and Huan, G. 2007. “Measuring Website Usability of Chinese Enterprise with a Heuristic Procedure”. Proc. of the IEEE International Conference on eBusiness Engineering (ICEBE’07), pp.396-399. [IEEEx] [S103] Johnson, T.; Zhang, J.; Tang, Z.; Johnson, C. and Turley, J. 2004. “Assessing informatics students’ satisfaction with a web-based courseware system”. International Journal of Medical Informatics, Vol. 73, Issue 2, pp. 181-187. [SD] [S104] Johnson, J. and Marshall, C. 2005. “Convergent usability evaluation: a case study from the EIRS project”. Proc. of the SIGCHI Conference on Human factors in computing systems (CHI’05), pp. 1501-1504. [ACM] [S105] Jung, H.; Lee, M.; Lee, S. and Sung, W. 2008. “Development of an Academic Research Information Service through Repeated Usability Evaluations”. Proc. of the First International Conference on Advances in Computer-Human Interaction, pp.195-199. [IEEEx] [S106] Kakasevski, G.; Mihajlov, M.; Arsenovski, S. and Chungurski, S. 2008. “Evaluating usability in learning management system moodle”. Proc of the 30th International Conference on Information Technology Interfaces (ITI’08), pp.613-618. [IEEEx] [S107] Kao, H.Y. 2007. “Usability Testing of AMC Hospital's Website for Home Users: Case Study for On-Site Registration Design”. Proc. of the Third International Conference on Intelligent Information Hiding and Multimedia Signal Processing (IIHMSP’07), pp.619622. [IEEEx] [S108] Karahoca, D.; Karahoca, A.; Güngör, A. 2008. “Assessing effectiveness of the cognitive abilities and individual differences on e-learning portal usability evaluation”. Proc. of the 9th International Conference on Computer Systems and Technologies and Workshop for PhD Students in Computing (CompSysTech '08), article no.57. [ACM] [S109] Katsanos, C.; Tselios, N.K. and Avouris, N.M. 2006. “InfoScent evaluator: a semiautomated tool to evaluate semantic appropriateness of hyperlinks in a web site”. Proc. of the 18th Australia conference on Computer-Human Interaction: Design: Activities, Artefacts and Environments (OZCHI '06), pp. 373-376 [ACM] [S110] Kazienko, P. and Pilarczyk, M. 2006. “Hyperlink assessment based on web usage mining”. Proc. of the seventeenth conference on Hypertext and hypermedia (HYPERTEXT '06), pp. 85-88. [ACM] [S111] Keilson, S.; King, E. and Sapnar, M. 1999. “Learning science by doing science on the Web”. Proc. of the 29th Annual Frontiers in Education Conference (FIE '99), vol.3, pp.13D4/7-13D412. [IEEEx] [S112] Kelders, S.M.; Kerkhof, S.; Van Gemert-Pijnen, J.E.W.; Seydel, E.R.; Markus, F. and Werkman, A. 2009. "Evaluation of an Interactive Web-Based Application to Promote Healthy Behavior in Order to Maintain a Healthy Weight – Preliminary Findings". Proc. of the International Conference on eHealth, Telemedicine, and Social Medicine (eTELEMED '09), pp.275-279. [IEEEx]
295
[S113] Kemp, E. and Setungamudalige, D.T. 2006. “A resource support toolkit (R-IDE): supporting the DECIDE framework”. Proc. of the 7th ACM SIGCHI New Zealand chapter's international conference on Computer-human interaction: design centered HCI (CHINZ '06), pp. 61-66. [ACM] [S114] Kim, E.; Wang, M.; Lau, C. and Kim, Y. 2004. “Application and Evaluation of Personal Health Information Management System”. Proc. of the 26th Annual International Conference of the IEEE Engineering in Medicine and Biology Society (IEMBS '04), vol.2, pp. 3159-3162. [IEEEx] [S115] Kirmani, S. 2008. “Heuristic Evaluation Quality Score (HEQS): Defining Heuristic Expertise”. Journal of Usability Studies, Vol. 4, Issue 1, pp. 49-59. [JUS] [S116] Komarkova, J.; Novak, M.; Bilkova, R.; Visek, O. and Valenta, Z. 2007. “Usability of GeoWeb Sites: Case Study of Czech Regional Authorities Web Sites”. Business Information Systems, LNCS 4439, Springer, pp. 411-423. [SL] [S117] Koutsabasis, P.; Spyrou, T.; Darzentas, J. 2007. “Evaluating usability evaluation methods: criteria, method and a case study”. Proc. of the 12th international conference on Human-computer interaction: interaction design and usability (HCI’07), pp. 569-578. [ACM] [S118] Krahmer, E. and Ummelen, N. 2004. “Thinking about thinking aloud: a comparison of two verbal protocols for usability testing”. IEEE Transactions on Professional Communication, Vol.47, No.2, pp. 105-117. [IEEEx] [S119] Li, C. and Kit, C. 2005. “Web structure mining for usability analysis”. Proc. of the IEEE/WIC/ACM International Conference on Web Intelligence, pp. 309-312. [IEEEx] [S120] Li, Q.; Sun, L. and Duan, J. 2005. “Web page viewing behavior of users: an eye-tracking study”. Proc. of the International Conference on Services Systems and Services Management (ICSSSM'05), vol.1, pp. 244-249. [IEEEx] [S121] Lister, M. 2001. “Usability testing software for the internet”. Proc of the SIGCHI conference on Human factors in computing systems (CHI '01), pp. 17-18. [ACM] [S122] Liu, F. 2008. "Usability evaluation on websites". Proc. of the 9th International Conference on Computer-Aided Industrial Design and Conceptual Design (CAID/CD’08), pp.141-144. [IEEEx] [S123] López, J.M.; Fajardo, I.; Abascal, J. 2007. “Towards remote empirical evaluation of web pages' usability”. Proc. of the 12th international conference on Human-computer interaction: interaction design and usability (HCI'07), pp. 594-603. [ACM] [S124] Massey, A.P.; Khatri, V. and Montoya-Weiss, M.M. 2008. “Online Services, Customer Characteristics and Usability Requirements”. Proc. of the 41st Annual Hawaii International Conference on System Sciences (HICSS’08), pp.33-33. [IEEEx] [S125] Matera, M.; Rizzo, F. and Carughi, G. 2006. “Web Usability: Principles and Evaluation Methods”. Web Engineering, Springer, pp. 143-180. [SL]
296
[S126] Mayuzumi, Y.; Jin, H. and Choh, I. 2003. “Study of finding solutions to problems between environmental information side and user side on Web”. Proc. of the 3rd International Symposium on Environmentally Conscious Design and Inverse Manufacturing (EcoDesign'03), pp. 477- 484. [IEEEx] [S127] Milic-Frayling, N.; Jones, R.; Rodden, K.; Smyth, G.; Blackwell, A. and Sommerer, R. 2004. “Smartback: supporting users in back navigation”. Proc. of the 13th international conference on World Wide Web (WWW '04), pp. 63-71. [WWW] [S128] Millen, D.R. 1999. “Remote usability evaluation: user participation in the design of a Web-based email service”. SIGGROUP Bulletin, Vol. 20, Issue 1, pp. 40-45. [ACM] [S129] Molich, R. and Dumas, J. 2004. “Comparative usability evaluation (CUE-4)”, Behaviour & Information Technology, Vol. 27, No. 3, pp. 263-281. [Other] [S130] Molina, F. and Toval, A. 2009. “Integrating usability requirements that can be evaluated in design time into Model Driven Engineering of Web Information Systems”. Advances in Engineering Software, Vol. 40, Issue 12, pp. 1306-1317. [SD] [S131] Moraga, M.A.; Calero, C. and Piattini, M. 2006. “Ontology driven definition of a usability model for second generation portals”. Proc. of the 1st International Workshop on Methods, Architectures & Technologies for e-Service Engineering (MATeS 2006) in conjunction with The Sixth International Conference on Web Engineering (ICWE 2006). [ICWE] [S132] Moreno, L.; Martínez, P. and Ruiz, B. 2007. “Inclusive Usability Techniques in Requirements Analysis of Accessible Web Applications”. Proc. of the International Workshop on Web Usability and Accessibility (IWWUA‘07), pp. 423-428.[IWWUA] [S133] Morgan, M. and Borns, L. 2004. “360 degrees of usability”. Proc. of the SIGCHI on Human factors in computing systems (CHI '04), pp. 795-809. [ACM] [S134] Nakamichi, N.; Shima, K.; Sakai, M. and Matsumoto, K. 2006. “Detecting low usability web pages using quantitative data of users' behavior”. Proc. of the 28th international conference on Software engineering (ICSE '06), pp. 569-576. [ACM] [S135] Nakamichi, N.; Sakai, M.; Shima, K.; Hu, J. and Matsumoto, K. 2007. “WebTracer: A new web usability evaluation environment using gazing point information”. Electronic Commerce Research and Applications, Vol. 6, Issue 1, pp. 63-73. [SD] [S136] Nielsen, J. and Loranger, H. 2006. “Prioritizing Web Usability”. New Riders Press, 1 edition. [Other] [S137] Nijland, N.; Seydel, E.R.; van Gemert-Pijnen, J.E.W.C.; Brandenburg, B.; Kelders, S.M. and Will, M. 2009. “Evaluation of an Internet-Based Application for Supporting SelfCare of Patients with Diabetes Mellitus Type 2”. Proc. of the International Conference on eHealth, Telemedicine, and Social Medicine (eTELEMED '09), pp.46-51. [IEEEx] [S138] Norman, K.L and Panizzi, E. 2006. “Levels of automation and user participation in usability testing”. Interacting with Computers, Vol. 18, Issue 2, pp. 246-264. [SD] [S139] Obendorf, H.; Weinreich, H. and Hass, T. 2004. “Automatic support for web user studies with SCONE and TEA”. Proc. of the SIGCHI conference on Human factors in computing systems (CHI’04), pp. 1135-1138. [ACM]
297
[S140] Oehler, M. and Biffignandi, S. 2008. “Web Sites Communication Performance: A Methodological Approach”. Proc. of the 19th International Conference on Database and Expert Systems Application (DEXA'08), pp.466-471. [IEEEx] [S141] Olmsted-Hawala, E.L.; Romano, J.C. and Murphy, E.D. 2009. "The use of paperprototyping in a low-fidelity usability study”. Proc. of the IEEE International Professional Communication Conference (IPCC’09), pp.1-11 [IEEEx] [S142] Olsina, L.; Rossi, G.; Garrido, A.; Distante, D. and Canfora, G. 2007. “Incremental Quality Improvement in Web Applications Using Web Model Refactoring”. Proc. of the International Workshop on Web Usability and Accessibility (IWWUA‘07), pp. 411422. [IWWUA] [S143] Orii, Y.; Nozawa, T. and Kondo, T. 2008. “Web-Based Intelligent Photo Browser for Flood of Personal Digital Photographs”. Proc. of the IEEE/WIC/ACM International Conference on Web Intelligence and Intelligent Agent Technology (WI-IAT '08), Vol. 3, pp.127-130. [IEEEx] [S144] Oztekin, A.; Nikov, A. and Zaim, S. 2009. “UWIS: An assessment methodology for usability of web-based information systems”. Journal of Systems and Software, Vol. 82, Issue 12, pp. 2038-2050. [SD] [S145] Paganelli, L. and Paterno, F. 2002. “Automatic reconstruction of the underlying interaction design of web applications”. Proc. of the 14th international conference on Software engineering and knowledge engineering (SEKE’ 02), pp. 439-445. [ACM] [S146] Paganelli, L. and Paterno, F. 2002. “Intelligent analysis of user interactions with web applications”. Proc. of the 7th international conference on Intelligent user interfaces (IUI '02), pp. 111-118. [ACM] [S147] Panach, J.I.; Valverde, F. and Pastor, O. 2007. “Improvement of a Web Engineering Method through Usability Patterns”. Proc. of the International Workshop on Web Usability and Accessibility (IWWUA‘07), pp.441-446. [IWWUA] [S148] Paolini, P. 1999. “Hypermedia, the Web and Usability issues”. Proc. of IEEE International Conference on Multimedia Computing and Systems, Vol.1, pp.111-115. [IEEEx] [S149] Pascual, V. and Dursteler, J.C. 2007. “WET: a prototype of an Exploratory Search System for Web Mining to assess Usability”. Proc. of the 11th International Conference Information Visualization (IV '07), pp.211-215. [IEEEx] [S150] Perlman, G. 2002. “Achieving Universal Usability by Designing for Change”. IEEE Internet Computing, Vol. 6, Issue 2, pp. 46-55. [IEEE IC] [S151] Qi, Y.; Reynolds, C. and Picard, R.W. 2001. “The Bayes Point Machine for computeruser frustration detection via PressureMouse”. Proc. of the 2001 workshop on Perceptive user interfaces (PUI '01), pp. 1-5. [ACM] [S152] Ramli, R. and Jaafar, A. 2008. “e-RUE: A cheap possible solution for usability evaluation”. Proc. of the International Symposium on Information Technology (ITSim’08), Vol.3, pp.1-5. [IEEEx]
298
[S153] Rosenthal, A. 2007. “Redesign solution for civicinfo bc web site”. Proc. of the 25th annual ACM international conference on Design of communication (SIGDOC '07), pp. 269-274. [ACM] [S154] Roy, M.C.; Dewit, O. and Aubert, B.A. 2001. “The impact of interface usability on trust in web retailers”. Internet Research Journal, Vol. 11, No. 5, pp. 388-398. [IR] [S155] Saavedra, V.; Teixeira, L.; Ferreira, C. and Sousa-Santos, B. 2008. “A Preliminary Usability Evaluation of Hemo@Care: A Web-Based Application for Managing Clinical Information in Hemophilia Care”. Human Centered Design, LNCS 5619, Springer, pp. 785-794. [SL] [S156] Salman, Y.B.; Ince, I.F.; Kim, J.Y.; Cheng, H.I. and Yildirim, M.E. 2009. “Participatory design and evaluation of e-learning system for Korean language training”. Proc. of the 2nd International Conference on Interaction Sciences: Information Technology, Culture and Human (ICIS '09), pp. 312-319. [ACM] [S157] Santos, B.S.; Zamfir, F.; Ferreira, C.; Mealha, O. and Nunes, J. 2004. “Visual application for the analysis of Web-based information systems usage: a preliminary usability evaluation”. Proc. of the Eighth International Conference on Information Visualisation (IV’04), pp. 812-818. [IEEEx] [S158] Saward, G.; Hall, T. and Barker, T. 2004. “Assessing usability through perceptions of information scent”. Proc. of the 10th International Symposium on Software Metrics (METRIC’04), pp. 337-346 [IEEEx] [S159] Scholtz, J. 2001. “Adaptation of traditional usability testing methods for remote testing”. Proc. of the 34th Annual Hawaii International Conference on System Sciences, pp. 8. [IEEEx] [S160] Schwerz, A.L.; Morandini, M. and Da Silva, S.R. 2007. “A Task Model Proposal for Web Sites Usability Evaluation for the ErgoMonitor Environment”. Human-Computer Interaction. Interaction Design and Usability, LNCS 4550, Springer, pp. 1188-1197. [SL] [S161] Scotch, M.; Parmanto, B. and Monaco, V. 2007. “Usability Evaluation of the Spatial OLAP Visualization and Analysis Tool (SOVAT)”. Journal of Usability Studies, Vol. 2, Issue 2, pp. 76-95. [JUS] [S162] Seva, R.; Wu, J. and Yi, X. 2006. “Evaluation of Cinema Website”. Proc. of the IEEE International Conference on Systems, Man and Cybernetics (SMC '06), Vol.1, pp.712717. [IEEEx] [S163] Shanshan, Q.; Buhalis, D. and Law, R. 2007. “Evaluation of the Usability of Chinese Destination Management Organisation Websites”. Information and Communication Technologies in Tourism, Vol. 6, pp. 267-278. [SL] [S164] Signore, O. 2005. "A comprehensive model for Web sites quality". Proc. of the Seventh IEEE International Symposium on Web Site Evolution (WSE’05), pp. 30- 36. [IEEEx] [S165] Skov, M.B. and Stage, J. 2005. “Supporting problem identification in usability evaluations”. Proc. of the 17th Australia conference on Computer-Human Interaction (OZCHI '05), pp. 1-9. [ACM]
299
[S166] Spalteholz, L. 2008. “KeySurf: A Character Controlled Browser for People with Physical Disabilities”. Proc. of the 17th international conference on World Wide Web (WWW '08), pp. 31-40. [WWW] [S167] Sperry, R.A. and Fernandez, J.D. 2008. “Usability testing using physiological analysis”. Journal of Computing Sciences in Colleges, Vol. 23, Issue 6, pp. 157-163. [ACM] [S168] Spool, J. and Schroeder, W. 2001. “Testing web sites: five users is nowhere near enough”. Proc. of the SIGCHI conference on Human factors in computing systems (CHI '01), pp. 285-286. [ACM] [S169] Ssemugabi, S. and De Villiers, R. 2007. “A comparative study of two usability evaluation methods using a web-based e-learning application”. Proc. of the annual research conference of the South African institute of computer scientists and information technologists on IT research in developing countries (SAICSIT '07), pp. 132-142. [ACM] [S170] Stary, C. and Eberle, P. 2008. “Building up usability-engineering capability by improving access to automated usability evaluation”. Interacting with Computers, Vol. 20, Issue 2, pp. 199-211. [SD] [S171] Stefano, F.; Borsci, S. and Stamerra, G. 2009. “Web usability evaluation with screen reader users: implementation of the partial concurrent thinking aloud technique”. Cognitive Processing, Springer, Vol. 11, No. 3, pp. 263-272. [SL]. [S172] Stolz, C.; Viermetz, M.; Barth, M. and Wilde, K. 2006. “Searchstrings revealing User Intent - A better Understanding of User Perception”. Proc. of the 6th International Conference on Web Engineering (ICWE’06), pp. 225-232. [ICWE] [S173] Sulaiman, J.; Zulkifli, T.; Ibrahim, K.S.K. and Noor, N.K.M. 2009. "Implementing Usability Attributes In E-learning System Using Hybrid Heuristics". Proc. of the International Conference on Information and Multimedia Technology (ICIMT '09), pp.189-193. [IEEEx] [S174] Sullivan, T. and Matson, R. 2000. “Barriers to use: usability and content accessibility on the Web's most popular sites”. Proc. of the conference on Universal Usability (CUU '00), pp. 139-144. [ACM] [S175] Sutcliffe, A. 2002. “Assessing the reliability of heuristic evaluation for Web site attractiveness and usability”. Proc. of the 35th Annual Hawaii International Conference on System Sciences (HICSS’02), pp. 1838-1847. [IEEEx] [S176] Tan, D. and Bishu, R. 2009. “Web evaluation: heuristic evaluation vs. user testing”. International Journal of Industrial Ergonomics, Vol. 39, pp. 621-627 [Other] [S177] Tao, Y.; Guo, S. 2001. “The design of a web-based training system for simulation analysis”. Proc. of the Winter Simulation Conference, pp. 645-652. [IEEEx] [S178] Taylor, M.; Wade, S. and England, D. 2003. “Informing IT system Web site design through normalization”. Internet Research Journal, Vol. 13, No. 5, pp. 342-355. [IR] [S179] Thimbleby, H. 1997. “Gentler: a tool for systematic web authoring”. International Journal of Human-Computer Studies, Vol. 47, No. 1, pp. 139-168. [IJHCS]
300
[S180] Thompson, K.E.; Rozanski, E.P. and Haake, A.R. 2004. “Here, there, anywhere: remote usability testing that works”. Proc. of the 5th conference on Information technology education (CITC5 '04), pp. 132-137. [ACM] [S181] Thompson, A.J. and Kemp, E.A. 2009. “Web 2.0: extending the framework for heuristic evaluation”. Proc. of the 10th International Conference NZ Chapter of the ACM's Special Interest Group on Human-Computer Interaction (CHINZ '09), pp. 2936. [ACM] [S182] Tirapat, T. and Achalakul, T. 2006. “Usability Assessment for Hyperlink Methods”. Proc. of the International Conference on Hybrid Information Technology (ICHIT '06), Vol. 1, pp.252-256. [IEEEx] [S183] Toleman, M.A. and Toleman, J.M. 1998. “User experiences and a usability inspection of an electronic services environment for students”. Proc. of the Australasian Computer Human Interaction Conference, pp.87-93. [IEEEx] [S184] Tonn-Eichstädt, H. 2006. “Measuring website usability for visually impaired people-a modified GOMS analysis”. Proc. of the 8th international ACM SIGACCESS conference on Computers and accessibility (Assets '06), pp. 55-62. [ACM] [S185] Triacca, L.; Inversini, A. and Bolchini, D. 2005. “Evaluating Web usability with MiLE+”. Proc. of the Seventh IEEE International Symposium on Web Site Evolution (WSE’05), pp. 22- 29. [IEEEx] [S186] Van den Haak, M.J. and De Jong, M.D.T. 2003. “Exploring two methods of usability testing: concurrent versus retrospective Think-Aloud Protocols”. Proc. of the IEEE International Professional Communication Conference (IPCC’03), pp. 3. [IEEEx] [S187] Van Velsen, L.; Van der Geest, T. and Klaassen, R. 2007. “Testing the usability of a personalized system: comparing the use of interviews, questionnaires and ThinkAloud”. Proc. of the IEEE International Professional Communication Conference (IPCC’07), pp.1-8. [IEEEx] [S188] Van Waes, L. 2000. “Thinking aloud as a method for testing the usability of Websites: the influence of task variation on the evaluation of hypertext”. IEEE Transactions on Professional Communication, Vol. 43, No. 3, pp.279-291. [IEEEx] [S189] Vanderdonckt, J.; Beirekdar, A. and Noirhomme-Fraiture, M. 2004. “Automated Evaluation of Web Usability and Accessibility by Guideline Review”. Proc. of the 4th International Conference on Web Engineering (ICWE’04). pp. 28-30.[ICWE] [S190] Vatrapu, R. and Pérez-Quiñones, M.A. 2006. “Culture and Usability Evaluation: The Effects of Culture in Structured Interviews”. Journal of Usability Studies, Vol. 1, Issue 4, pp. 156-170. [JUS] [S191] Wang, S.K. and Yang, C. 2005. “The Interface Design and the Usability Testing of a Fossilization Web-Based Learning Environment”. Journal of Science Education and Technology, Vol. 14, No. 3, pp. 305-313. [SL] [S192] Wang, L.; Bretschneider, S. and Gant, J. 2005. “Evaluating Web-Based E-Government Services with a Citizen-Centric Approach”. Proc. of the 38th Annual Hawaii International Conference on System Sciences (HICSS '05), pp. 129b- 129b. [IEEEx]
301
[S193] Wang, X. and Liu, J. 2007. “Usability Evaluation of B2C Web Site”. Proc. of the International Conference on Wireless Communications, Networking and Mobile Computing (WiCom’07), pp. 3837-3840. [IEEEx] [S194] Weir, C.; Anderson, J. and Jack, M. 2006. “On the role of metaphor and language in design of third party payments in eBanking: Usability and quality”. International Journal of Human-Computer Studies, Vol. 64, Issue 8, pp. 770-784. [SD] [S195] West, R. and Lehman, K. 2006. “Automated summative usability studies: an empirical evaluation”. Proc. of the SIGCHI conference on Human Factors in computing systems (CHI '06), pp. 631-639. [ACM] [S196] Wilkins, R. and Nyamapfene, A. 2009. "Usability driven website design - An equine sports case study". Proc. of the International Conference for Internet Technology and Secured Transactions (ICITST’09), pp.1-6. [IEEEx] [S197] Wilson, R.; Shortreed, J. and Landoni, M. 2004. “A study into the usability of eencyclopaedias”. Proc. of the ACM symposium on Applied computing (SAC '04), pp. 1688-1692. [ACM] [S198] Wood, F.B.; Siegel, E.R.; LaCroix, E.-M.; Lyon, B.J.; Benson, D.A.; Cid, V. and Fariss, S. “A practical approach to e-government Web evaluation”. IT Professional , Vol. 5, No.3, pp. 22-28. [IEEEx] [S199] Xu, L.; Xu, B. and Jiang, J. 2005. “Testing web applications focusing on their specialties”. SIGSOFT Software Engineering Notes, Vol. 30, Issue 1, pp. 10. [ACM] [S200] Xu, L. and Xu, B. 2007. “Applying Agent into Intelligent Web Application Testing”. International Conference on Cyberworlds, (CW '07), pp.61-65 [IEEEx]. [S201] Ytikseltiirk, E. 2004. “Usability evaluation of an online certificate program”. Proc. of the Fifth International Conference on Information Technology Based Higher Education and Training (ITHET’04), pp. 505-509. [IEEEx] [S202] Zaharias, P. 2006. “A usability evaluation method for e-learning: focus on motivation to learn”. Proc. of the SIGCHI Conference on Human factors in computing systems (CHI '06), pp. 1571-1576. [ACM] [S203] Zhang, P.; Small, R.V.; Von Dran, G.M. and Barcellos, S. 1999. “Websites that satisfy users: a theoretical framework for Web user interface design and evaluation”. Proc. of the 32nd Annual Hawaii International Conference on System Sciences (HICSS’99), Vol. Track 2, pp. 8. [IEEEx] [S204] Zhao, L. and Deek, F.P. 2006. “Exploratory inspection: a learning model for improving open source software usability”. Proc. of the SIGCHI Conference on Human factors in computing systems (CHI '06), pp. 1589-1594. [ACM] [S205] Zimmerman, D.; Slater, M. and Kendall, P. 2001. “Risk communication and usability case study: implications for Web site design”. Proc. of the IEEE International Professional Communication Conference (IPCC’01), pp.445-452. [IEEEx] [S206] Zimmerman, D. and Stapel, L. 2006. “Strategies for Integrating Research and Evaluation in Web Site Development”. Proc. of the IEEE International Professional Communication Conference (IPCC’06), pp.225-230. [IEEEx]
302
The papers included in the systematic review are presented using the following format: [Id Study] Reference: [P01] M.H. Blackmon, M. Kitajima, P.G. Polson, “Tool for accurately predicting website navigation problems, non-problems, problem severity, and effectiveness of repairs”. SIGCHI conference on Human factors in computing systems (CHI’05), 2005, pp. 3140. [P02] J. Chattratichart, J. Brodie, “Applying user testing data to UEM performance metrics”. Conference on Human factors in computing systems (CHI '04), 2004, pp. 1119-1122. [P03] M. Chun-Long, E. Mendes, “Web Usability Measurement: Comparing Logic Scoring Preference to Subjective Assessment”. 5th International Conference on Web Engineering (ICWE’05), 2005, pp. 53-62. [P04] T. Conte, J. Massollar, E. Mendes, G.H. Travassos, "Web usability inspection technique based on design perspectives". IET Software, 3 (2), 2009, pp.106-123. [P05] M.F. Costabile, M. Matera, “Guidelines for hypermedia usability inspection”. IEEE Multimedia, 8 (1), 2001, pp.66-69. [P06] E. De Kock, J.Van Biljon, M. Pretorius, “Usability evaluation methods: mind the gaps”. Annual Research Conference of the South African Institute of Computer Scientists and Information Technologists (SAICSIT '09), 2009, pp. 122-131. [P07] K. Hornbæk, E. Frøkjær, “Two psychology-based usability inspection techniques studied in a diary experiment”. 3rd Nordic conference on Human-computer interaction (NordiCHI '04), 2004, pp. 3-12. [P08] K. Hornbæk, E. Frøkjær, "Usability Inspection by Metaphors of Human Thinking Compared to Heuristic Evaluation". International Journal of Human-Computer Interaction, 17 (3), 2004, pp. 357-374. [P09] K. Hornbæk, E. Frøkjær, “Comparing usability problems and redesign proposals as input to practical systems development”. SIGCHI conference on Human factors in computing systems (CHI '05), 2005, pp. 391-400. [P10] E.T. Hvannberg, E. Law, M. Lárusdóttir, “Heuristic evaluation: Comparing ways of finding and reporting usability problems”. Interacting with Computers,19 (2), 2007, pp. 225-240. [P11] P. Koutsabasis, T. Spyrou, J. Darzentas, "Evaluating usability evaluation methods: criteria, method and a case study”. Proc. of the 12th international conference on Human-computer interaction: interaction design and usability (HCI’07), 2007, pp. 569578. [P12] E. Krahmer, N. Ummelen, “Thinking about thinking aloud: a comparison of two verbal protocols for usability testing”. IEEE Transactions on Professional Communication, 47 (2), 2004, pp. 105-117. [P13] M.B. Skov, J. Stage, “Supporting problem identification in usability evaluations”. Proc. of the 17th Australia conference on Computer-Human Interaction (OZCHI '05), 2005, pp. 1-9.
303
[P14] S. Ssemugabi, R. De Villiers, “A comparative study of two usability evaluation methods using a web-based e-learning application”. South African institute of computer scientists and information technologists on IT research (SAICSIT '07), 2007, pp. 132142. [P15] D. Tan, R. Bishu, “Web evaluation: heuristic evaluation vs. user testing”. International Journal of Industrial Ergonomics, Vol. 39, 2009, pp. 621-627. [P16] K.E. Thompson, E.P. Rozanski, A.R. Haake, “Here, there, anywhere: remote usability testing that works”. 5th conference on Information technology education (CITC5 '04), 2004, pp. 132-137. [P17] L. Van Velsen, T. Van der Geest, R. Klaassen, “Testing the usability of a personalized system: comparing the use of interviews, questionnaires and Think-Aloud”. IEEE International Professional Communication Conference (IPCC’07), 2007, pp.1-8. [P18] R. West, K. Lehman, “Automated summative usability studies: an empirical evaluation”. SIGCHI conference on Human Factors in computing systems (CHI '06), 2006, pp. 631-639.
304
A.2. Quality assessment and Data Extraction form: Template for quality assessment and data extraction in the systematic mapping study: Paper ID:
Source:
Evaluator:
Data:
Quality Assessment
(+1)
a) The study presents a detailed description of the UEM employed. b) The study provides guidelines as to how the UEM can be applied. c) The study presents clear results obtained after the application of the UEM. d) The study has been published in a relevant journal or conference e) The study has been cited by other authors
(0)
○
○
○
○
○
○
○
○
○
○
○
○
○
○
○
Data Extraction for Sub-questions
Answers
Q1. Origin of the UEMs employed?
○ New ○ Existing
Q2. Underlying usability definition of UEMs employed?
○ Standard ○ Particular
Q3. Types of UEMs employed?
□ Testing □ Inspection □ Inquiry □ Analytical Modeling □ Simulation
Q4. Type of evaluation performed by UEMs employed? Q5. Phase(s) and Web artifacts in which the UEMs are applied? Q6. Quality of the feedback provided by UEMs? Q7. UEMs have been empirically validated?
(-1)
○ Manual ○ Automated □ Requirements □ Design □ Implementation ○Yes ○ No ○ Survey ○ Case Study ○ Experiment ○ No
Notes:
305
A.3. Mapping of the primary studies: Legend: Q1: a) New; Q2: a) Standard; Q3: a) User testing; Q4: a) Manual; Q5: a) requirements; Q6: a) Yes; Q7: a) Survey; ID S001 S002 S003 S004 S005 S006 S007 S008 S009 S010 S011 S012 S013 S014 S015 S016 S017 S018 S019 S020 S021 S022 S023 S024 S025 S026 S027 S028 S029 S030 S031 S032 S033 S034 S035 S036 S037 S038 S039
306
Q1 a X X X X
b) Existing b) Ad-hoc b) Inspection; b) Automated b) Design; b) No b) Case study;
Q2 b
X X X
a
X X X X X X X X X X X X X X X X X X X X X X X X X X X X
X X X X X X X X X X X X X X X X X X X X X X X X X
b X X X
X X
X X X X
X X X X X X
a
b
e
X X X X X X
X X
c) Experiment; a X X X
X X
X
X X
X X
X
X X X X
X X
X
X
X X X X
X X X
X X X
X
X X X
X X X X
X X
X
X X X
X
X
X
X X X
X X X X X X
Q6 c X X X X X X X X X X X X X X X X X X X X X X X X X X X X
a
Q7 b X X X
X X X X X X
a X
b
X
X X X X X X X X X
score c
X X X X X X X
X
X X X X
X X X
X
X X X X
X X X X
X
X
X X
X
X X
X
X
X X
X X X
X X X
X X X
X X X
X X X
X X
X X
X X
X X X
X X X
d X
X X
X X
X
e) Simul.;
d) No;
X X
X
X X X X
X X
X X X X X
X
X
Q5 b X X
X X X X X
X X
X X X
X X X X X X X
a
X X X X
X
X
b
X
X
X X X
d) A. Modeling;
c) Implementation;
Q4 d X
X X X
Q3 c X
c) Inquiry;
X X X X
3,00 2,67 4,67 2,67 2,67 3,00 1,00 1,00 2,00 2,33 3,00 3,00 2,00 0,33 -2,00 0,33 1,67 3,00 4,00 3,00 -0,67 0,00 5,00 5,00 5,00 -2,67 1,00 0,00 3,33 4,00 2,00 1,00 -3,00 0,00 2,33 1,33 5,00 1,67 0,00
S040 S041 S042 S043 S044 S045 S046 S047 S048 S049 S050 S051 S052 S053 S054 S055 S056 S057 S058 S059 S060 S061 S062 S063 S064 S065 S066 S067 S068 S069 S070 S071 S072 S073 S074 S075 S076 S077 S078 S079 S080 S081 S082 S083 S084 S085 S086 S087 S088 S089 S090 S091 S092 S093 S094 S095 S096 S097
X
X X X X X X X
X X X X X X X X X
X X X
X X X X
X
X X X X X X X X X X
X X X X X X X
X X X X
X
X X X X
X X X X X X
X
X
X X X X X
X X X X X X
X X X X X X X X X X
X X X X X X X X X
X X X X X X X
X
X X X X X
X X X X X
X X X
X X X
X X X X X X
X X X X X X X
X X
X
X
X
X
X X X
X
X X
X
X X X X
X X X X X X X X
X
X
X
X
X X X X X X X X X X X X X X
X
X X
X X X X X X X
X
X X X X X
X X X X X
X X
X
X
X
X
X X
X X X X X X
X X X X X
X
X
X
X X
X
X X X X
X X X X X X
X X X X X X X
X X X
X X X
X
X
X
X X X X
X X X X X
X X X X X
X X X X
X X X X X X X X X
X X X X X X X X
X
X X
X
X
X
X X X X X X X X X X X X X X X X
X
X X
X
X
X
X
X
X X X
X
X
X
X X X X X
X
X X X X X
X X X X X X X X X X X X X X X X X X X X X X X X
X
X X X
X X X X X X X X X X X X X
X X
X X X X X
X
X
X X X X
X X X X X X X X
X X
X X X X X
X
X X
X X
X
X
X X X X
X X X
X X X X
X X X
X
X X X
X X X X
X X X
X X X X X X X
X X X X X X X
X X X X
X X X X X X
X X X X X
-2,33 0,00 -0,67 1,00 0,33 5,00 5,00 -0,33 -2,00 0,00 1,33 0,00 2,00 5,00 0,00 2,67 2,67 5,00 3,00 1,00 1,67 3,00 0,00 2,67 2,33 -1,00 -0,67 -0,33 1,67 2,67 0,00 2,00 -3,00 0,00 1,00 3,00 3,00 1,00 1,67 -0,33 1,67 -1,33 1,33 -0,67 2,00 -0,33 2,00 0,67 -0,33 -4,00 -2,33 4,00 5,00 1,67 0,00 4,33 1,33 5,00
307
S098 S099 S100 S101 S102 S103 S104 S105 S106 S107 S108 S109 S110 S111 S112 S113 S114 S115 S116 S117 S118 S119 S120 S121 S122 S123 S124 S125 S126 S127 S128 S129 S130 S131 S132 S133 S134 S135 S136 S137 S138 S139 S140 S141 S142 S143 S144 S145 S146 S147 S148 S149 S150 S151 S152 S153 S154 S155
308
X
X X X
X X X
X X X X X X X X
X X X X X X X
X
X X X X X
X
X
X X X X X X X X X X X X X X
X X X X X X X X X X X X X X X X
X X X X X X X X X X X
X X X X X X X X
X X X
X
X
X X X X X X
X X
X X X
X X
X X
X X X X X X X X X
X X X X
X X X X
X X X X X X X X
X X X X
X X
X X
X X X X X
X X X X X
X
X X X X X
X
X X
X X
X
X X X
X X
X X
X X X X
X X X X
X X
X X X X
X
X X X
X
X X X
X X
X
X X X
X
X X X X X
X X
X X X
X X X
X X X X
X X
X X X
X X X X X X X X X X X
X X X X
X X X X X
X X X X
X
X
X
X
X
X
X X
X X X X X X X X X X X X
X X X X X X X X X X X
X
X
X X
X
X
X
X X X
X
X X X
X
X X X X
X X X X X
X X
X X X X X
X X X
X X X X X
X X X X X X X X
X
X
X
X X X
X
X
X
X X X X X X X
X
X X
X
X
X X
X X
X
X X X X X X X X X X X X X X X X X X X X X X X X X X X X X X X X
X
X X
X X X
X X
X X X
X X X
X X
X
X X X X
X
X X
X X X X X X X X X X X
X
X
X X X
X
X
X X
X X
X
X X X
X
X
X X X X X X X
X X
X X X X
X X X X X
X X
X X X
X X X X X X
X X X X X
X X X X X
5,00 5,00 -2,00 -2,00 -1,00 -0,33 0,67 1,67 -1,67 -0,67 0,33 1,33 4,00 1,00 1,00 1,67 0,67 2,00 1,67 0,00 5,00 2,67 0,67 2,00 1,00 1,00 1,00 5,00 0,00 3,00 -1,00 1,00 4,00 3,33 1,33 1,00 3,00 4,00 5,00 -3,00 2,33 3,00 2,00 0,00 1,00 -3,00 4,00 2,00 4,00 -1,00 2,00 0,67 -1,00 -1,67 -0,67 -2,33 2,00 -1,00
S156 S157 S158 S159 S160 S161 S162 S163 S164 S165 S166 S167 S168 S169 S170 S171 S172 S173 S174 S175 S176 S177 S178 S179 S180 S181 S182 S183 S184 S185 S186 S187 S188 S189 S190 S191 S192 S193 S194 S195 S196 S197 S198 S199 S200 S201 S202 S203 S204 S205 S206
X X X
X X
X X
X
X
X
X X
X X X X
X X X
X X X X X X X X X
X X X X X
X X X X X X X X X X X X
X X X X X X X X X X X X X X
X
X X X X X X X X
X
X X
X X X X
X
X
X X X X X X X X
X X X
X
X X X
X X X
X X X X X X X X X X X
X
X X X
X X
X X X
X X X X X X X X
X
X X
X X X
X X
X
X X X X
X X X
X
X X X X
X X X
X X X
X
X X X X X X
X
X X X X X X X
X X X X X X
X X X
X X X X X
X X X X X
X
X X X X
X
X X X X
X X X X X X
X X X X X X X X
X X X
X X X X X X X X X X X X
X X
X
X X
X
X
X X
X
X
X X X X X X
X
X X X
X X
X X X X X X X X X
X
X
X X X X X X
X X
X X X X X
X
X X X X X X X X X X X X X X X X X X X X X X X
X
X X
X X
X
X
X
X X
X
X X
X X X
X
X
X
X X X X
X
X X X
X X X
X X X X X X
X X X X X X X
X X
X X X
X X
X X X
X
X X
X
X
X X
X
X X X
X
X X X
X X X X
X X
X X
X
X X X X X X X X X
X X X X X X X X X
X X X X X
-1,67 2,67 1,67 2,00 0,00 0,00 -1,00 1,00 3,00 2,00 0,00 1,00 1,67 3,67 -0,33 3,00 1,67 2,00 0,00 3,67 2,00 -2,00 -0,67 1,33 2,67 2,67 0,67 0,00 2,00 4,00 -2,00 2,00 5,00 4,00 1,00 1,00 1,00 2,00 1,33 3,67 1,33 -1,00 3,00 0,33 -1,33 -0,33 5,00 2,67 2,00 0,33 -2,00
309
Appendix B.
Web Usability Model
This appendix shows the breakdown of both perspectives of our Web Usability Model into sub-characteristics, attributes and measures (Section B1 and B2). In addition, section B3 provides the definition of a subset of generic measures (which were applied in this thesis).
B.1
Usability: Software Product perspective
Sub-characteristic
1.1. Optical legibility
Attribute 1.1.1. Font color/sixe/face suitability 1.1.2. Text recognizability 1.1.3. Disposition 1.2.1. Information grouping cohesiveness
1. Appropriateness recognizability
1.2. Readability 1.2.2. Information Density
1.3. Familiarity
1.2.3. Pagination Support 1.3.1. Data format consistency 1.3.3. Metaphor suitability 1.3.2. Internationalization
Measure Font sizes suitably for each context Color contrast Text cluster count Emphasized body word count Horizontal scrolls count Proportion of actions grouped Semantic association centers Cohesiveness Coupling Number of components Number of sections Word count Number of contents based in Flash Total number of controls Average length of audio clips Average length of video clips Page count Media count Total page allocation Number of images Paginated content Number of different format for the same data type Metaphors properly chosen Number of standardized commands
311
Sub-characteristic
Attribute 1.4.1. Action minimization
1.4. Workload reduction
1.4.2. Selfdescriptiveness 1.4.3. Information complexity 1.5.1. Message Availability
1.5. User guidance
1.5.2. Explicit transaction progress 1.5.3. Explicit user context 1.6.1. Internal search support 1.6.2. Clickability
1.6.3. Interconnectivity
1.6. Navigability
1.6.4. Reachability
1.6.5. Sitemap completeness
2. Learnability
2.1. Predictability
2.1.1. Meaningful links 2.1.2. Meaningful
312
Measure Default value availability Demos availability Understandability of data inputs Description completeness UI elements clearness Structure Page complexity Audio complexity Video complexity Cyclomatic complexity Proportion of actions without error messages associated Number of tasks without tracking info Current state when interacting with the UI Internal search availability Discernible links Compactness Prestige Stratum Total link count Average connected distance Converted Out Distance Converted In Distance Relative Out Centrality Relative In Centrality Breadth of the internavigation Breadth of the intranavigation Depth of the navigation Density of the navigation Number of broken links Number of orphan contents Proportion of functionalities covered in the map Proportion of links without meaningful names Latent Semantic Analysis angle of distinction Proportion of headings
Sub-characteristic
Attribute headings 2.1.3. Meaningful controls 2.1.4. Meaningful multimedia content
2.2. Affordance
2.3. Helpfulness
2.2.1. Determination of possible actions 2.2.2. Determination of promise actions 2.3.1. Quality of messages 2.3.2. Immediate feedback 2.3.3.Online help completeness
2.3.4. Multi-user documentation 3.1.1. Compatibility with browsers and plugins 3.1. Compatibility
3.1.2. Compatibility with operating systems 3.1.3. Compatibility with speed connections 3.1.4. Compatibility with screen resolution
3. Operability 3.2. Data Management
3.2.1. Validity of input data 3.2.2. Data privacy 3.3.1. Edition deferral
3.3. Controllability
3.3.2. Cancel support 3.3.3. Interruption support 3.3.4. Undo support
Measure without meaningful names Proportion of not suitable controls chosen for its function Proportion of nonmeaningful multimedia content Visibility of links and actions Visibility of the most relevant links and actions Proportion of nonmeaningful messages Proportion of actions with no feedback response Proportion of functionalities that have been documented Availability of different languages Proportion of users with all their functionalities documented Behavior differences of UI elements among browsers Number of plugins needed Behavior differences between controls in different operating systems Download time Number of screen resolutions that are supported Proportion of validation mechanisms for input data Proportion of protection mechanisms for input data Availability of post-edition operations User operation cancellability Number of controls that allows to abort an action Number of controls that allows to undo an action
313
Sub-characteristic
Attribute 3.3.5. Redo support
3.4. Capability of adaption
3.3.6. Print format support 3.4.1. Adaptability 3.4.2. Adaptivity 3.5.1. Constant behavior of links/controls
3.5. Consistency
3.5.2. Permanence of links/controls 3.5.3. Order consistency of links/controls 3.5.4. Heading consistency
4. User error protection
4.1. Error prevention 4.2. Error recovery 5.1. Magnifier support. 5.2. Device independency
5. Accessibility
5.3. Alternative text support 5.4. Safety colors 5.5. Degree of fulfillment with the WCA Guidelines 6.1. Color uniformity 6.2. Font color/size/face uniformity
6. User interface aesthetics
6.3. UI position uniformity 6.4. Interface appearance customizability 6.5. Interactivity degree
7. Compliance
314
7.1. Degree of fulfillment with the ISO/IEC 25000 SQuaRE 7.2. Degree of fulfillment with the
Measure Number of controls that allows to redo an action Number of pages that cannot be printed properly Customisability Operation procedure reduction Links with the same targets Proportion of controls without the same behavior Proportion of links/controls that are permanent across the UI Variations in the order of links Headings according to the target of the links Availability of validation mechanisms for avoiding typical errors Availability of recovery mechanisms from an error Availability of magnifier functionality Number of technological devices Proportion of images without alternative text Number of colors prone to epilepsy Ratio of compliance covered Background style Number of different styles for links Misfit UI elements Variation in the composition of the frames Number of aesthetic customization options Rate of information exchanged between user and UI. Ratio of compliance covered Ratio of compliance
Sub-characteristic Attribute “Research-Based Web Design & Usability Guidelines” 7.3. Degree of fulfillment with the “Web Style Guide” 7.4. Degree of fulfillment with the “Microsoft Web Design Guidelines” 7.5. Degree of fulfillment with the “Sun Guide to Web Style” 7.6. Degree of fulfillment with the “IBM Web Design Guidelines”
B.2
Measure covered Ratio of compliance covered Ratio of compliance covered Ratio of compliance covered Ratio of compliance covered
Usability: Quality in use perspective
Sub-characteristic
Attribute 8.1.1. Online help effectiveness
8.1. Helpfulness 8. Effectiveness in use
8.1.3. Need of help 8.2. User task performance 9.1. User tasks efficiency
9. Efficiency in use
8.1.2. Online help completeness
9.2. Cognitive effort
8.2.1. User tasks completion 8.2.2. User tasks accuracy 9.1.1. User tasks time completion 9.1.2. User task load 9.2.1. Subjective mental effort 9.2.2. User interface memorability 9.3.1. System load
9.3. Context limitation
10. Satisfaction in use
10. 1. Cognitive satisfaction 10.2. Emotional satisfaction
9.3.2. Adaptability to user skills 10.1.1. Perceived usefulness 10.1.2. Quality of the results 10.2.1. Perceived appealing
Measure Tutorial readiness Effectiveness of help system Ease of use help system Proportion of functionalities no properly covered in the user assistance Frequency with which users Access to the help Number of completed tasks Number of properly completed tasks Time needed to complete a task User Task Load index Subjective Mental Effort ratio Ease of learning function Ease of learning tasks Memory consumed during use of the Web application Number of user profiles provided Number of incidents in the task Number of features that users find useful Number of features that users expect to find Number of positive user comments
315
Sub-characteristic
10.3. Physical satisfaction
Attribute 10.2.2. Perceived frustration 10.3.1. Healthy risk 10.3.2. Content risk 10.4.1. Error appearance
10.4. Trustiness
10.4.2. Credibility 10.4.3. Economic risk
11. Usability in use compliance
316
11.1. Degree of fulfillment with the ISO/IEC 25000 SQuaRE 11.2. Degree of fulfillment with the ergonomic criteria 11.3. Degree of fulfillment with the SUMI questionnaire 11.4. Degree of fulfillment with the SUS questionnaire 11.5. Degree of fulfillment with the QUIS questionnaire
Measure Number of timeouts in a task Number of positive user reviews Number of negative comments about the content Number of errors between operations Quality of user impressions Number of incidents involving economic loss Ratio of compliance covered Ratio of compliance covered Ratio of compliance covered Ratio of compliance covered Ratio of compliance covered
B.3
Generic Measures
Measure Attribute Generic Description Scale Interpretation Application level
Measure Attribute Generic Description Scale Interpretation Application level
Measure Attribute Generic Description Scale Interpretation Application level
Color contrast (CC) Appropriateness recognizability / Optical legibility / Text recognizability The contrast degree of two different colors (C1 and C2) is determined by the following generic formula: Σ(|C1(i)-C2(i)|) let i={Red Value, Green Value, Blue Value} based on the RGB notation. Integer value greater than or equal to 0 The higher the value, better contrast between both colors - PIM level if the Web development method provides abstract user interface models that include colors as another attribute. - PSM level if the Web development method provides concrete user interface models that include colors as an option. - CM level if the colors are defined in the same pages that represent the end-user interface files or cascading style sheets. Paginated content (PC) Appropriateness recognizability / Readability / Pagination support Considering containers of information that provide an extended list of content information. The metric is calculated as the proportion between the number of these containers that are not divided in different pages and the total number of containers. Ratio between 0 and 1. The higher value the worse readability is achieved in the WebApp due to the fact that too much information is presented at the same time to the user. - PIM/PSM level if the Web development method provides modeling primitives to divide the presentation of content. - CM level if the Web application is intended to provide a great amount of content. Default value availability (DVA) Appropriateness recognizability /Workload reduction / Action minimization Ratio between the input data that has a default value and the total data that are given to provide a default value according to their nature. Ratio between 0 and 1 Values closer to 0 indicate that the user has to manually enter data that could be provided automatically by the Web application, while values closer to 1 indicate that the user saves time on the data entry tasks. - PIM level if the Web development method provides a structural/navigational model that defines the input data properties. - PSM level if the Web development method provides a data model associated with a specific platform that has the default values option. - CM level by analyzing the form fields of the interfaces that appear with a default value assigned.
317
Measure Attribute Generic Description Scale Interpretation Application level
Understandability of data inputs (UDI) Appropriateness recognizability / Workload reduction / Action minimization Ratio between the number of elements that can lead to confusion and the total number of items asked for interaction. Ratio between 0 and 1 Values closer to 1 indicate that the Web application is requesting information which is not understood by the user. - PIM/PSM level if the Web development method provides modeling primitives to define the name of the data input. - CM level by analyzing the labels of the input fields in all the forms provided by the Web application.
Measure Attribute Generic Description Scale Interpretation Application level
Proportion of actions without error messages associated (PAE) Appropriateness recognizability / User guidance / Message availability Ratio between the number of user actions without an error message to provide feedback and the total number of user actions. Ratio between 0 and 1 The higher value, the worse guidance is offered to the user. - PIM/PSM level if the Web development method provides modeling primitives to represent the user operations and their outcomes. - CM level by analyzing the availability of messages associated to the most common user functionalities.
Measure Attribute Generic Description Scale Interpretation Application level
Current state when interacting with the UI (CSI) Appropriateness recognizability /User guidance / Explicit user context Assessment of whether the user interface has mechanisms to present the current state of the user in the Web application. Integer value є {0, 1, 2, 3, 4} The higher the value, the worst orientation provided to the user - PIM/PSM level if the Web development method provides modeling primitives to display the current state of the user. - CM level by analyzing the whole user interface according to the elements aimed at showing the user’s current state.
Measure Attribute Generic Description
Breadth of the inter-navigation (BiN) Appropriateness recognizability / Navigability / Reachability Level of breadth in the user navigation, in other words, the different paths that can be selected by the user in a certain context of the user navigation (i.e., homepage, internal sections, etc.) Integer greater than 0 The higher value the easier is for the user to get lost in the content/feature due to the fact there is too many options to navigate. - PIM/PSM level if the first-level navigation is modeled as a graph where the nodes represent the information accessed and the edges represent the links between this navigational information. - CM level by analyzing the targets of the hyperlinks in the source code from the Web application’s home page.
Scale Interpretation Application level
318
Measure Attribute Generic Description Scale Interpretation Application level
Measure Attribute Generic Description Scale Interpretation Application level
Measure Attribute Generic Description Scale Interpretation Application level
Breadth of the intra-navigation (BaN) Appropriateness recognizability / Navigability / Reachability Number of options or different paths that can be selected by the user in a specific navigation context in order to reach content/actions that belong to this same context. Integer greater than or equal to 0. The higher the value, the more difficult is for users to access to features or actions that are provided in a context. - PIM/PSM level if the second-level navigation is modeled as a graph where the nodes represent the information accessed and the edges represent the links between this navigational information. - CM level by analyzing the targets of the hyperlinks in the source code from the Web application’s sections. Depth of the navigation (DN) Appropriateness recognizability / Navigability / Reachability Level of depth in the user navigation, in other words, the longest navigation path (without loops) which is needed to reach any content or feature from the Web app by the user. Integer greater than 0 The higher value the more difficult is to reach the content or feature by the user. - PIM/PSM level if the navigation is modeled as a graph where the nodes represent the information accessed and the edges represent the links between this navigational information. - CM level by analyzing the targets of the hyperlinks in the Web application’s source code. Proportion of links without meaningful names (PLM) Learnability / Predictability / Meaningful links Ratio between the number of links without a meaningful name and the total number of links Ratio between 0 and 1 The higher value, the worse predictability is provided since users may find difficulties in order to predict the target and results of their actions. - PIM/PSM level if the Web development method provides modeling primitives to define the links and their names. - CM level by analyzing the targets of the hyperlinks in the Web application’s source code.
319
Measure Attribute Generic Description Scale Interpretation Application level
Measure Attribute Generic Description Scale Interpretation Application level
Measure Attribute Generic Description Scale Interpretation Application level
320
Visibility of links and actions (VLA) Learnability /Affordance / Determination of possible actions Ratio between the number of links that are difficult to notice and the total number of links. Ratio between 0 and 1 The higher the value, the harder it is for users to locate the actions to be carried out. - PIM/PSM level if the Web development method provides modeling primitives to define presentation issues such as the visualization of elements in the UI. - CM level by analyzing the disposition of UI elements in the whole Web application. Proportion of non-meaningful messages (PNM) Learnability / Helpfulness / Quality of messages Ratio between the number of messages that do not show concisely and clearly the information intended to be communicated and the total number of messages. There are different types of messages: error messages, warning messages, advice messages and/or upgrade messages. Ratio between 0 and 1 Values closer to 0 indicates that messages have sufficient quality to guide the user during their interaction, while values closer to 1 indicate the opposite. - PIM/PSM level if the Web development method provides modeling primitives to define the content of the error, warning, advise or update messages shown by the Web application. - CM level by analyzing the message’s text displayed in the final Web application Behavior differences of UI elements among browsers (BDE) Operability / Compatibility / Compatibility with browsers and plugins Number of types of items that are not displayed and or behave the same way depending on the browser being used. Integer greater than or equal to 0. The higher the value, the worse compatibility is achieved by the web application. This may limit the user interaction and the goals to be achieved just by the fact of using different browsers. CM level by analyzing the UI elements in different Web browsers (e.g., text typography, design styles, interface controls, etc.
Measure Attribute Generic Description
Scale Interpretation Application level
Measure Attribute Generic Description Scale Interpretation
Application level
Measure Attribute Generic Description Scale Interpretation Application level
Proportion of validation mechanisms for input data (PVM) Operability / Data Management / Validity of input data Ratio between the number of data input fields that do not provide help in order to insert data according to a correct format and the total number of data input fields that may require a validation of the data format. The Input fields with the capability to be validated are: - Data about a restricted set of values (e.g., gender, age) - Data according to a concrete format (e.g., dates, telephone numbers, emails) - Mandatory data that requires a non-null value (e.g., password, etc.) Ratio between 0 and 1. The higher value, the worse data management is provided since users might find errors which can waste their time in accomplishing their tasks. - PIM/PSM level if the Web development method provides modeling primitives to define validation rules associated to the input fields. - CM level by analyzing the input fields from the Web application’s forms. User operation cancellability (UOC) Operability / Controllability / Cancel support Proportion between the number of implemented functions that cannot be cancelled by the user prior to completion and the total number of functions requiring the pre-cancellation capability. Ratio between 0 and 1. The higher value the worse controllability is presented in the WebApp due to the fact that it is necessary to use external operations (browser actions) in order to go back to a previous state if user wants to cancel the current operation. - PIM/PSM level if the Web development method provides modeling primitives to define return path associated to the user operations. - CM level by analyzing the options provided in the forms intended to cover the user operations. Links with the same targets (LST) Operability / Consistency / Constant behavior of links Ratio between the number of states where the incoming links are given different names and the total number of states with incoming links Ratio between 0 and 1. The higher value, the worse consistency in the behavior of links is provided. This may mislead users in the use of the WebApp. - PIM/PSM level if the Web development method provides modeling primitives to define the links and their names. - CM level by analyzing the targets of the hyperlinks in the Web application’s source code.
321
Measure Attribute Generic Description Scale Interpretation Application level
Measure Attribute Generic Description Scale Interpretation Application level
Measure Attribute Generic Description Scale Interpretation
Application level
322
Variations in the order of links (VOL) Operability / Consistency / Order consistency of links and controls Number of times the links within the same section or functionality associated change order. Integer greater than or equal to 0. The higher the value, the worse consistency between the links in the Web application affecting to the controllability of the application - PIM/PSM level if the Web development method provides modeling primitives to define order in which links will be presented in the user interface. - CM level by analyzing the order of the hyperlinks in the Web application’s source code. Headings according to the target of the links (HAT) Operability / Consistency / Heading consistency Number of headings whose name text does not correspond with the name of the link through it was accessed to its content. Integer greater than or equal to 0. The higher the value, the worse consistency exists in the Web application content, affecting its ease of use. - PIM/PSM level if the Web development method provides modeling primitives to define the heading and links by assigning the name property. - CM level by analyzing the headings and the targets of the hyperlinks in the Web application’s source code. Proportion of images without alternative text (PIA) Accessibility / Alternative text support Ratio between the number of images associated with an alternative text and the total number of images. Ratio between 0 and 1 Values closer to 1 contribute to an improvement in the technical accessibility of the Web application, and not only to provide textual information on the images to disabled users, but also the textual information is useful to interpret these images when there are problems with their availability. - PIM/PSM level if the Web development method provides abstract user interface models that allow the insertion of external content (i.e., images) with associated properties. - CM level by checking the source code’s tags aimed at presenting an alternative text associated with those images.
Measure Attribute Generic Description Scale Interpretation Application level
Misfit UI elements (ME) User interface aesthetics / UI position uniformity The number of items that exceed the predefined dimensions in frames that contain them. Integer greater than or equal to 0. The higher is the result, the worst is the user perception about the uniformity and aesthetic of the Web application - PIM/PSM level if the Web development method provides abstract user interface models allowing the definition of size properties for UI elements. - CM level by checking the source code’s tags that define the maximum sizes of the elements
323
Appendix C.
Experiment Material
This appendix presents excerpts from all the different experimental materials. Section C.1 presents an excerpt from both the WUEP and HE appendixes that contain the operationalized metrics and heuristics to be applied, respectively. Section C.2 shows an example of a Web artifact to be evaluated: the Abstract Presentation Diagram (Web artifact APD1) for the Task Management functionality extracted from the Experimental Object 1 (which is included in the data gathering documents: WUEP-O1 and HE-O1). Section C.3 collects the experimental tasks to be carried out when WUEP and HE are applied to APD1 (these tasks are also included in the data gathering documents: WUEPO1 and HE-O1). Section C.4 shows the template which was employed to report usability problems in WUEP and HE. The original materials have been translated into English for the reader’s convenience. The original experimental material and the raw data are available for download at http://www.dsic.upv.es/~afernandez/thesis/instrumentation.html.
C.1
Examples of operationalized metrics and heuristics
C.1.1. Operationalized Metrics. Metric Usability attribute Generic description Scale Interpretation Operationalization
Depth of the Navigation (DN) Appropriateness recognizability / Navigability/ Reachability Level of depth in the user navigation, in other words, the longest navigation path which is needed to reach any content/feature (without loops) from the Web app by the user. Integer greater than 0 The higher the value, the more difficult it is for the user to reach the content/feature. This metric can be calculated for each Navigational Access Diagram (NAD) by considering the number of navigation steps from the longest navigation path. Where: Navigation step: when a Target Link exists between two nodes (any modeling primitive and/or more than one modeling primitives connected by Automated Links and/or Source Links) Longest navigation path: The path with the greatest number of navigation steps, which begins in the first Navigational Class or Collection where the navigation starts, and which ends in the last Navigational Class or Service Link, from which it is not possible to reach another modeling primitive previously visited. The calculation formula is therefore: DN(NAD) = Number of navigation steps from the longest navigation
324
Thresholds
Metric Usability attribute Generic description Scale Interpretation Operationalization
path [1 ≥ DN ≤ 4]: [5 ≤ DN ≤ 7]: [8 ≤ DN ≤ 10]: [DN ≥ 10]:
No usability problem. Low usability problem. Medium Usability Problem. Critical Usability Problem.
Proportion of links without meaningful names (PLM) Learnability / Predictability / Meaningful links Ratio between the number of links without a meaningful name and the total number of links. Ratio between 0 and 1. The higher the value, the worse the predictability that is provided, since the user may experience difficulties in predicting the target and results of his/her actions. This metric can be calculated in all the abstract pages belonging to an Abstract Presentation Diagram (APD) by considering the proportion of non-proper names used by APD links. The calculation formula is therefore: PLM(APD) =
Number of Links without a meaningful name Total number of Links in the APD
Thresholds
[PLM = 0]: No usability problem. [0 < PLM ≤ 0.3]: Low usability problem. [0.3 < PLM ≤ 0.6]: Medium Usability Problem. [0.6 < PLM ≤ 1]: Critical Usability Problem.
Metric Usability attribute Generic description
Headings according to the target of the links (HAT) Ease of use / Consistency / Heading consistency Number of headings whose name is not in accordance with the link name from which the heading was reached. Integer greater than 0. The higher the value, the worse the consistency that exists in the Web application content, thus affecting the ease of use. This metric can be calculated in the final user interface (FUI) by considering the names of the links and the headings of the content reached by these links. The calculation formula is therefore: HAT(FUI) = Number of headings that are not in accordance with the link name which was followed to reach the current content. [HAT = 0]: No usability problem. [1 ≤ HAT ≤ 3]: Low usability problem. [4 ≤ HAT ≤ 6]: Medium Usability Problem. [HAT ≥ 7]: Critical Usability Problem.
Scale Interpretation Operationalization
Thresholds
325
C.1.2. Heuristics Heuristic Description
Match between system and the real world. The system should speak the users' language, with words, phrases and concepts that are familiar to the user, rather than system-oriented terms. Follow real-world conventions, making information appear in a natural and logical order. On the Web, you have to be aware that users will probably come from diverse backgrounds, so figuring out their "language" can be a challenge. An example of a real-world concept that is applied to Web applications may be the icons employed to distinguish between errors, warnings, or advice. Another example would be the shopping cart metaphor. In many Web stores, customers usually click once to select an element (equivalent to taking it off the shelf in a real store), click again to "add to cart" (equivalent to placing the item in their real cart) and then add a third click to confirm their purchase intention (equivalent to approaching the cashier in order to pay for it).
Heuristic Description
User control and freedom Users often choose some functions by mistake and will need a clearly marked "emergency exit" to leave the unwanted state without having to go through an extended dialogue. It is important to provide control operations such as: cancel, undo and redo. Many of the "emergency exits" are provided by the browser, but there is still plenty of room on the site to support user control and freedom. Or, there are many ways authors can take away user control that are built into the Web. A "home" button on every page is a simple way to let users feel in control of the site. Be careful when forcing users into certain fonts, colors, screen widths or browser versions. And watch out for some of those "advanced technologies": user control is not usually added until the technology has matured. One example is animated GIFs. Until browsers let users stop and restart the animations, they can do more harm than good.
Heuristic Description
Recognition rather than recall Minimize the user's memory load by making objects, actions, and options visible. The user should not have to remember information from one part of the dialogue to another. Instructions for use of the system should be visible or easily retrievable whenever appropriate. Good labels and descriptive links are also crucial for recognition. It is best to always maintain links, menus, structures, actions and options visible to allow them to be memorized. For example, if a website has a lot of submenus, you should use a system that allows users to know which section you are at any time. This could be leaving a "trail of crumbs", or the Web application could use a color scheme that makes it possible to differentiate between the sections.
326
C.2 Examples of Web artifacts to be evaluated C.2.1. Abstract Presentation Diagram to be evaluated This figure shows the Abstract Presentation Diagram (APD1) by including its six abstract pages. Detailed information about the content of these abstract pages is provided as follows. Elements marked with ‘(*)’ are attributes from the Navigational classes and their display text in the final Web application will be the values from the attribute: The first abstract page (a) represents the access to the different existing folders: predefined, created, user-specific. It contains: 1 label: “Folder". 1 image: portfolio icon with one tick. 7 links: “New folder”, “All tasks”, “Pending tasks”, “Ended tasks”, “Task out of date”, “folder_name(*)", “user_name(*)”. The second abstract page (b) represents the task list which is filtered by the selected folder. It contains: 3 labels: “Task list”, “folder_name ( )”, “description (*)”, “!”, “Description”, “End date” 2 images: folder icon, portfolio icon. 2 links: “New Task”, “name and status (*)” The third abstract page (c) represents the warning message that appears when the selected folder does not contain any attached task. 1 label: “NOTICE The selected …” 1 image: exclamation icon The fourth abstract page (d) represents the detailed task information in conjunction with the available operations: attribute modification, ended percentage update, and user assignment: 21 labels: “Task detail”, “EN1 (*)”, Task title, Begin date, End Date, etc. 4 links: “aIe”, “parent_folder (*)”, Modify, Reassign. The fifth abstract page (e) represents the creation of a new task. Form fields refer to the attributes from the Task class that was defined in the Class Model: 7 labels: “New Task”, “Task name”, “description”, “priority”, “assigned user”, “begin date”, “End date (deadline)”. 1 link: “New” The sixth abstract page (f) represents the creation of a new folder. Form fields refer to the attributes from the Folder class that was defined in the Class Model. 3 labels: “New Folder”, “Folder name”, “Folder description”. 327
1 link: “OK”
328
C.2.2. Hypertext Model to be evaluated This figure shows an excerpt of the WebCalendar Hypertext Model, in which is represented the event creation, the access to the event details, and the ability to comment about these events. A textual description of this model is provided as follows: The Hypertext Model contains three pages: Calendar (Home), Add Appointment, and Appointment details. On the Calendar page, the navigation can be started from three alternatives: The Browse CalendarUnit allows searching for events by date or position on a calendar date represented by the CalendarUnit Calendar. The Quick Filters DataUnit allows searching all events created (ResetUserFilter), or only those in which the user participates (SelectorUnits: [users] and [appointments]). The Filter by User MultiChoiceIndexUnit allows searching for all events created by those attendees ([users] SelectorUnit) involved in the event ([appointments] SelectorUnit). The results of previous navigations are shown in Calendar CalendarUnit, from which is possible to access the details of the event (Appointment Details page) or to create a new event (Add appointment page). On the Add appointment page, the navigation can be started from Add appointment EntryUnit, which receives the information required thanks to the data provided by the SelectorUnits: [categories], [hours] and [attendees]. Through the Add Normal Link, a new event is created by the Create Appointment OperationUnit. If it is correctly created, the navigation returns to the Calendar page (home). On the Appointment Details page, it is shown the details of the previous selected event thanks to the Comments IndexUnit and Attendees MultiDataUnit. The Add a comment EntryUnit and the Comment OperationUnit enable the creation of a new comment. If this comment was added successfully, the page is refreshed.
329
Add
Close OK
OK OK
Select
OK
Details All appointments My appointments
Filter
New
OK Add
330
The details of the two EntryUnits in this Hypertext Model (Add appointment and Add a comment) are the following:
331
C.3 Examples of experimental tasks C.3.1. Experimental tasks for applying WUEP to APD1 1. Using as support the list of operationalized metrics: a. Select the metrics that can be applied to the APD that is shown in Figure B1. b. Apply each metric in order to obtain its value. c. Classify the value obtained according to the threshold established for each metric. 2. For each detected usability problem (low, medium, critical), fill in the required fields provided by the usability report template, and write the ID of the problem in the last column. Write starting time (hh:mm): ________ Metric Acronym
Metric calculation
Severity level of the usability problem
Usability problem ID
…
…
…
…
Write finishing time (hh:mm): ________ C.3.2. Experimental tasks for applying HE to APD1 1. Using the list of heuristics as support, identify whether the principles that are represented by each heuristic can be applied to the APD that is shown in Figure B1. If not, mark the “Not Applicable” box. 2. For each applicable heuristic, indicate the degree to which the represented principles are supported by the heuristic (YES=Supported; P=Partially supported; NO = Not supported). Justify your decision by indicating some elements from the artifact evaluated. 3. For each heuristic whose usability principles were not supported, fill in the usability problems detected in the usability report template, and write the ID of the problem in the last column. Write starting time (hh:mm): ________ 332
Heuristic ID
Usability principle represented
Justification by elements of the device ID observed usability problem
Usability problem ID
…
…
Not Applicable YES P NO
…
…
Write finishing time (hh:mm): ________
C.4 Examples of templates for reporting usability problems C.4.1. Template for reporting usability problems in WUEP Fields to complete for each usability problem identified: Description: Textual description of the problem identified. Occurrences: Number of times the usability problem is repeated in the same Web artifact evaluated (if applicable). Recommendations: Guidance on how to prevent and/or correct the usability problem detected. ID Description Occurrences Recommendations
P001
ID Description Occurrences Recommendations
P002
ID Description Occurrences Recommendations
P003
… 333
C.4.2. Template for reporting usability problems in HE tasks for applying HE to APD1 Fields to complete for each usability problem identified: Description: Textual description of the problem identified. Occurrences: Number of times the usability problem is repeated in the same Web artifact evaluated (if applicable). Severity level: Classification of the usability problem: critical, medium or low. Recommendations: Guidance on how to prevent and/or correct the usability problem detected. ID Description Severity level Occurrences Recommendations
P001
ID Description Severity level Occurrences Recommendations
P002
ID Description Severity level Occurrences Recommendations
P003
…
334
Low
Low
Low
Medium
Critical
Medium
Critical
Medium
Critical
Bibliography Abrahão, S., Condori-Fernandez, N., Olsina, L., and Pastor, O. (2003). “Defining and Validating Metrics for Navigational Models”. Proceedings of the 9th International Software Metrics Symposium (METRICS'03), IEEE. pp. 200-210. Abrahão, S., and Insfran, E. (2006). “Early Usability Evaluation in ModelDriven Architecture Environments”. Proceedings of the 6th IEEE International Conference on Quality Software (QSIC’06). IEEE Computer Society, 287-294 Abrahão, S., Iborra, E., and Vanderdonckt, J. (2007). “Usability evaluation of user interfaces generated with a model-driven architecture tool”. E. Law, E. Hvannberg, G. Cockton (Eds.), Maturing Usability: Quality in Software, Interaction and Value, Springer–Kluwer International Series in HumanComputer Interaction 10, Springer, pp. 3-32. Abrahão, S., and Poels, G. (2009). “A family of experiments to evaluate a functional size measurement procedure for Web applications”. Journal of Systems and Software, Vol. 82, Issue 2, pp. 253-269. Abrahão, S., Insfrán, E., Carsí, J.A., and Genero, M. (2011). “Evaluating requirements modeling methods based on user perceptions: A family of experiments”. Information Sciences, Vol. 181, Issue 16, pp. 3356-3378. Abran, A., Khelifi, A., Suryn, W., and Seffah, A. (2003). “Consolidating the ISO usability models”. Proceedings of 11th International Software Quality Management Conference (Springer),. Glasgow, Scotland, UK Allen, M., Currie, L., Bakken, S., Patel, V., and Cimino, J. (2006). “Heuristic evaluation of paper-based Web pages: A simplified inspection usability methodology”. Journal of Biomedical Informatics, Vol. 39, Issue 4, pp. 412-423. Alva, M., Martinez, A., Cueva, J.M., Sagástegui, C., and López, B. (2003). “Comparison of methods and existing tools for the measurement of usability in the Web”. Proceedings of the 3rd International Conference on Web Engineering (ICWE’03), Spain, Springer, pp. 386–389. Atterer, R. and Schmidt, A. (2005). ‘‘Adding Usability to Web Engineering Models and Tools’’. Proceedings of the 5th International Conference on Web Engineering (ICWE’05), pp. 36-41. 335
Atzeni, P., Mecca G., and Merialdo, P. (2001). “Data-Intensive Web Sites: Design and Maintenance”. World Wide Web, Vol. 4, pp. 21-47. Baresi, L., Garzotto, F., and Paolini, P. (2000). “From Web Sites to Web Applications: New Issues for Conceptual Modeling”. Proceedings of the 2nd International Workshop on the World Wide Web and Conceptual Modeling (WCM2000), pp. 89-100. Baresi, L., Garzotto, F., and Paolini, P. (2001). “Extending UML for Modeling Web Applications”. Proceedings of the 34th Annual Hawaii International Conference on System Sciences (HICSS '01), Vol. 3, p. 3055. Basili, V.R., Selby, R.W., and Hutchens, D.H. (1986). “Experimentation in Software Engineering”. IEEE Transaction on Software Engineering, Vol. 12, Issue 7, pp. 733-743. Basili, V.R., and Rombach, H.D. (1988). “The TAME project: towards improvement-oriented software environments”. IEEE Transactions on Software Engineering, Vol. 14, Issue 6, pp. 758-773. Basili, V.R. (1993). “The Experimental Paradigm in Software Engineering”. Proceedings of the International Workshop on Experimental Software Engineering Issues: Critical Assessment and Future Directions, LNCS 706, Springer, pp. 3 - 12. Basili, V.R. (1996). “The Role of Experimentation in Software Engineering: Past, Current, and Future”. Proceedings of International Conference on Software Engineering (ICSE’96), pp. 442-449. Basili, V.R., Shull, F., and Lanubile, F. (1999). “Building Knowledge through Families of Experiments”. IEEE Transactions on Software Engineering, Vol. 25, pp. 456-473. Bastien, J.M., and Scapin, D.L. (1993). “Ergonomic Criteria for the Evaluation of Human-Computer Interfaces”. Technical Report no. 156. INRIA, Rocquencourt, France. Batra, S., and Bishu, R.R. (2007). “Web usability and evaluation: issues and concerns - usability and internationalization: HCI and culture”. Proceedings of the 2nd International Conference on Usability and Internationalization, LNCS, Vol. 4559, Springer, pp. 243–249. Becker, S.A., and Mottay, F.E. (2001). “A Global Perspective on Web Site Usability”. IEEE Software, Vol. 18, Issue 1, pp. 54-61. 336
Bevan, N., and Schoeffel, R. (2001). “A proposed standard for consumer product usability”. Proceedings of 1st International Conference on Universal Access in Human Computer Interaction (UAHCI), New Orleans, August 2001. Bevan, N. (2007). “Web Usability and the New ISO Quality Model”. Keynote 1st International Workshop on Web Usability and Accessibility (IWWUA’07). Bevan, N. (2009). “International standards for usability should be more widely used”. Journal of Usability Studies, Vol. 4, Issue 3, pp. 106-113. Biostat 2006. Biostat Comprehensive Meta-Analysis v2. http://www.metaanalysis.com/ Blackmon, M.H., Kitajima, M., and Polson, P.G. (2005). “Tool for accurately predicting website navigation problems, non-problems, problem severity, and effectiveness of repairs”. Proceedings of the SIGCHI conference on Human factors in computing systems (CHI’05), pp. 31-40. Bolchini, D., and Garzotto, F. (2007). “Quality of Web Usability Evaluation Methods: An Empirical Study on MiLE+”. Proceedings of the International Workshop on Web Usability and Accessibility (IWWUA‘07), pp. 481-492. Booch, G., Rumbaugh, J., and Jacobson, I. (1999). “Unified Software Development Process”. Addison-Wesley. Botafogo, R., Rivlin, E., and Shneiderman, B. (1992). “Structural analysis of hypertexts: Identifying hierarchies and useful metrics”. ACM Transactions on Information Systems, Vol. 10, Issue 2, pp. 142-180. Briand, L., Labiche, Y., Di Penta, M., and Yan-Bondoc, H. (2005). “An experimental investigation of formality in UML-based development”. IEEE Transactions on Software Engineering, Vol. 31, Issue 10, pp. 833849. Brooke J. (1996). “SUS: A 'quick and dirty' usability scale”. Jordan PW, Thomas B, Weerdmeester B, McClelland I, editors. Usability Evaluation in Industry. London: Taylor & Francis, pp. 189-94. Budgen, D., Turner, M., Brereton, P., and Kitchenham, B. (2008). “Using mapping studies in software engineering”. Proceedings of Psychology of Programming Interest Group, Lancaster University, pp. 195-204. 337
Cachero, C., Melia, S., Genero, M., Poels, G., and Calero, C. (2007). “Towards improving the navigability of Web applications: a model-driven approach”. European Journal of Information Systems, Vol. 16, pp. 420-447. Calero, C., Ruiz, J., Piattini, M. (2005). “Classifying Web Metrics Using the Web Quality Model”. Emerald Group Publishing Limited. Vol. 29, Issue 3, pp. 227-248. Casteleyn, S., Daniel, F., Dolog, P., and Matera, M. 2009. “Engineering Web Applications”, Springer. Ceri, S., Fraternali, P., and Bongio, A. (2000). “Web modeling language (WebML): a modeling language for designing Web sites”. Proceedings of the 9th World Wide Web Conference (WWW’09), pp. 137–157. Ceri, S., Fraternali, P., Acerbis, R., Bongio, A., Butti, S., Ciapessoni, F., Conserva, C., Elli, R., Greppi, C., Tagliasacchi, M., and Toffetti, G. (2003). “Architectural issues and solutions in the development of data-intensive Web applications”. Proceedings of the 1st Biennial Conference on Innovative Data Systems Research. Online Proceedings, Asilomar, CA. Chattratichart, J., and Brodie, J. (2004). “Applying user testing data to UEM performance metrics”. Proceedings of the ACM SIGCHI Conference on Human factors in computing systems (CHI’04), ACM press, pp. 11191122. Chin, J.P., Diehl, V.A, and Norman, K.L. (1988). “Development of an instrument measuring user satisfaction of the human-computer interface”. Proceedings of the SIGCHI conference on Human factors in computing systems, pp. 213-218. Ciolkowski, M., Shull, F., and Biffl, S. (2002). “A family of experiments to investigate the influence of context on the effect of inspection techniques”. Proceedings of the 6th International Conference on Empirical Assessment in Software Engineering (EASE’02), pp. 48-60. Cockton, G., Lavery, D., and Woolrychn, A. (2003). “Inspection-based evaluations”. The Human-Computer Interaction Handbook, 2nd edition, J.A. Jacko and A. Sears, Eds. Lawrence Erlbaum Associates, pp. 11711190. Colosimo, M., De Lucia, A., Scanniello, G., and Tortora, G. (2009). “Evaluating Legacy System Migration Technologies through Empirical Studies”. Information and Software Technology, Vol. 51, Issue 12, Elsevier, pp. 433-447. 338
Conover, W.J. (1998). “Practical Nonparametric Statistics”, Wiley, 3rd edition. Conte, T., Massollar, J., Mendes, E., and Travassos, G.H. (2009). “Web usability inspection technique based on design perspectives”. IET Software, Vol. 3, Issue 2, pp. 106-123. Costabile, M.F., and Matera, M. (2001). “Guidelines for hypermedia usability inspection”. IEEE Multimedia, Vol. 8, Issue 1, pp. 66-69. Cowan, D., Ierusalimschy, R., De Lucena, C.J., and Stepien, T.M (1993). “Abstract data views”. Structured Programming, Vol. 14, Issue 1, pp. 1-14. Cruz-Lemus, J.A., Genero, M., Caivano, D., Abrahão, S., Insfrán, E., and Carsí, J.A. (2011). “Assessing the influence of stereotypes on the comprehension of UML sequence diagrams: A family of experiments”. Information and Software Technology, Vol. 53, Issue 12, pp. 1391-1403. Cunliffe, D. (2000). “Developing usable Web sites – a review and model”. Internet Research: Electronic Networking Applications and Policy, Vol. 10, Issue 4, pp. 295– 307. Davis, F.D. (1989). “Perceived Usefulness, Perceived ease of use and user acceptance of information technology”. MIS Quarterly, Vol. 13, Issue 3, pp. 319-340. De Troyer, O., and Leune, C.J. (1998). “WSDM: A user centered design method for web sites”. Computer Networks, Vol. 30, Issue 1-7, pp. 85-94. Dieste, O., López, M., Ramos, F. (2008). “Updating Empirical Evidence to Derive Well-founded Practices in Software Requirements Elicitation Techniques Selection”. Proceedings of the 11th Workshop on Requirements Engineering, Spain. Dix, A., Finlay, J., Abowd, G., and Beale, R. (1998). “Human-Computer Interaction”. Prentice Hall, Europe. Dromey, R.G. (1998). “Software Product Quality: Theory, Model and Practice”. Software Quality Institute, Griffith University, Australia. Dybå, T., and Dingsøyr, T. (2008). “Empirical studies of agile software development: A systematic review”. Information and Software Technology, Vol. 50, Issues 9-10, pp. 833-859. Dzidek, W. J., Arisholm, E., and Briand, L. C. (2008). “A Realistic Empirical Evaluation of the Costs and Benefits of UML in Software Maintenance”. IEEE Transactions on Software Engineering, Vol. 34, Issue 3, pp. 407432. 339
Escalona, M.J., Mejías, M., and Torres, J. (2004). “Developing systems with NDT and NDT-tool”. Proceedings of the 13th International Conference on Information Systems Development, pp. 149-159. Escalona, M.J., and Aragón, G. (2008). “NDT. A Model-Driven Approach for Web Requirements”. IEEE Transactions on Software Engineering, Vol. 34, Issue 3, pp. 377-390. Fenton, N. (1993). “How Effective Are Software Engineering Methods?”. Journal of Systems and Software, Vol. 22, Issue 2, pp. 141-146. Fenton, N., and Pfleeger, S.L. (1996). “Software Metrics: A Rigorous and Practical Approach”, Second ed., International Thomson Computer Press. Ferre, X., Juristo, N., and Moreno, A.M. (2005). “Framework for Integrating Usability Practices into the Software Process. Product Focused Software Process Improvement”. Proceedings of the 6th International Conference, (PROFES’05), LNCS 3547, Springer, pp. 202-215. Fisher, R.A. (1915). “Frequency distribution of the values of the correlation coefficient in samples of an indefinitely large population”. Biometrika, Vol. 10, Issue 4, pp. 507–521. Fitzpatrick, R. (1999). “Strategies for Evaluation of Software Usability”. http://www.comp.dit.ie/rfitzpatrick/papers/chi99%20strategies.pdf Fleiss, J.L. (1981). “Statistical Methods for Rates and Proportions”, Second ed., John Wiley & Sons, New York, 1981. Fons, J., Valderas, P., Ruiz, M., Rojas, G., and Pastor. O. (2003). “OOWS: A Method to Develop Web Applications from Web-Oriented Conceptual Models”. Proceedings of the 7th World MultiConference on Systemics, Cybernetics and Informatics, Vol. 1, 2003. Freire, A.P., Goularte, R., Fortes, R.P.M. (2007). “Techniques for developing more accessible Web applications: a survey towards a process classification”. Proceedings of the 25th ACM International Conference on Design of communication, pp. 162-169. Garzotto, F., Paolini, P., and Schwabe, D. (1993). “HDM - a Model-Based Approach to Hypertext Application Design”. ACM Transaction On Database Systems, Vol. 11, Issue 1, pp. 1-26. Gellersen, H., Wicke, R., and Gaedke, M. (1997). “Web Composition: an object-oriented support system for the Web engineering lifecycle”. Computer Networks and ISDN Systems, Vol. 29, Issues 8-13, pp. 8651553. 340
Glass, G.V., Mcgaw, B., and Smith, M.L. (1981). “Meta-Analysis in Social Research”. Sage Publications. Gomez, J., Cachero, C., and Pastor, O. (2000). “Extending a conceptual modeling approach to Web application design”. Proceedings of the 12th International Conference on Advanced Information Systems Engineering (CAiSE’00), pp. 79-93. Gomez, J., Cachero, C., Pastor, O. (2001). “Conceptual Modeling of DeviceIndependent Web Applications”. IEEE MultiMedia, Vol. 8, Issue 2, pp. 26-39. Granollers, T. (2004). “MPIu+a. Una metodología que integra la Ingeniería del Software, la Interacción Persona-Ordenador y la Accesibiiad en el contexto de equipos de desarrollo multidisciplinares”. Tesis Doctoral, Departament de Llenguatges i Sistemas Informàtics. Universitat de Lleida. Gray, W.D., and Salzman, M.C. (1998). “Damaged merchandise? A review of experiments that compare usability evaluation methods”. HumanComputer Interaction, Vol. 13, Issue 3, pp. 203-261. Hall, A., and Chapman, R. (2002). “Correctness by construction: Developing a commercial secure system”. IEEE Software, Vol. 19, Issue 1, pp. 18-25. Hartson, R.H., Andre, T.S., and Williges, R.C. (2003). “Criteria for Evaluating Usability Evaluation Methods”. International Journal of HumanComputer Interaction, Vol. 15, Issue 1, pp. 145-181. Hedges, L.V., and Olkin, I. (1985). “Statistical Methods for Meta-Analysis”. Academia Press. Hennicker, R., and Koch, N. (2001). “Systematic design of web applications with UML”. Unified Modeling Language: Systems Analysis, Design and Development Issues, pp. 1–20. Hertzum, M., and Jacobsen, N.E. (2001). “The evaluator effect: a chilling fact about usability evaluation methods”. International Journal of HumanComputer Interaction, Vol. 13, pp. 421-443. Hollingsed, T., and Novick, D.G. (2007). “Usability inspection methods after 15 years of research and practice”. Proceedings of the 25th annual ACM international conference on design of communication (SIGDOC’07), ACM Press, pp. 249-255.
341
Hornbæk, K., and Frøkjær, E. (2004). “Two psychology-based usability inspection techniques studied in a diary experiment”. Proceedings of the 3rd Nordic conference on Human-computer interaction (NordiCHI '04), pp. 3-12. Hornbæk, K. (2006). “Current practice in measuring usability: challenges to usability studies and research”. International Journal of Human–Computer Studies, Vol. 64, pp. 79–102. Hornbæk, K., and Law, E.L.C. (2007). “Meta-analysis of correlations among usability measures”. Proceedings of the SIGCHI conference on Human factors in computing systems (CHI '07), ACM New York, pp. 617-626. Hornbæk, K. (2010). “Dogmas in the assessment of usability evaluation methods”. Behaviour & Information Technology, Vol. 29, Issue 1, pp. 97111. Höst, M., Regnell, B., and Wohlin, C. (2000). “Using students as subjects - a comparative study of students and professionals in lead-time impact assessment”. Proceedings of the 4th Conference on Empirical Assessment and Evaluation in Software Engineering (EASE’00), pp. 201–214. Hu, P.J., and Chau, P.Y.K. (1999). “Examining the Technology Acceptance Model Using Physician Acceptance of Telemedicine Technology”. Journal of Management Information Systems, Vol. 16, Issue 2, pp. 91-113. Hvannberg, E.T., Law, E., and Lárusdóttir, M. (2007). “Heuristic evaluation: Comparing ways of finding and reporting usability problems”. Interacting with Computers, Vol. 19, Issue 2, pp. 225-240. Hwang, W., and Salvendy, G. (2010). “Number of people required for usability evaluation: the 10±2 rule”. Communications of the ACM, Vol. 53, Issue 5, pp. 130-133. IBM (2009). “IBM Web Design Guidelines”. Available at https://www01.ibm.com/software/ucd. International Organization for Standardization (1996). “ISO/IEC 9241-10, Ergonomic Requirements for Office Work with Visual Display Terminals (VDTs) – Part 10: Dialogue Principles”. International Organization for Standardization (1998). “ISO/IEC 9241-11: Ergonomic Requirements for Office work with Visual Display Terminals (VDTs) – Part 11: Guidance on Usability”. International Organization for Standardization (1998). “ISO/IEC 12207: Standard for Information Technology – Software Lifecycle Processes”. 342
International Organization for Standardization (1999). “ISO/IEC 13407: Human-Centred Design Processes for Interactive Systems”. International Organization for Standardization (1999). “ISO/IEC 14598-1, Information technology - Software product evaluation - Part 1: General overview”. International Organization for Standardization (2001). “ISO/IEC 9126-1 Standard, Software Engineering – Product Quality – Part 1: Quality Model”. International Organization for Standardization (2005). “ISO/IEC 25000, Software Engineering – Software Product Quality Requirements and Evaluation (SQuaRE) – Guide to SQuaRE”. International Organization for Standardization (2010). “ISO/IEC 9241-210, Ergonomics of human-system interaction - Part 210: Human-centred design for interactive systems. Ivory, M.Y., and Hearst, M.A. (2001). “The state of the art in automating usability evaluation of user interfaces”. ACM Computing Surveys, Vol. 33, Issue 4, pp. 470–516. Ivory, M.Y. (2001). “An Empirical Foundation for Automated Web Interface Evaluation”. PhD Thesis, University of California, Berkeley, Computer Science Division. Juristo, N., and Moreno, A. (2001). “Basics of Software Engineering Experimentation”, Kluwer Academic Publishers. “Guidelines for eliciting usability functionalities”. IEEE Transactions on Software Engineering, Vol. 33, Issue 11, pp. 744-758.
Juristo, N., Moreno, A., and Sanchez-Segura, M.I. (2007).
Kampenes, V., Dybå, T., Hannay, J.E., and Sjøberg, D.I.K. (2007). “A Systematic Review of Effect Size in Software Engineering Experiments”. Information and Software Technology, Vol. 49, Issues 11-12, pp. 10731086. Karat, J. (1997). “User-Centered Software Evaluation Methodologies”. Handbook of Human-Computer Interaction. M. Helander, T. K. Landauer and P. Prabhu, Elsevier Science B.V.: 689-704. Kirakowski, J., and Corbett, M. (1993). “SUMI: the Software Usability Measurement Inventory”. British Journal of Educational Technology, Vol. 24, Issue 3, pp. 210-212. 343
Kitchenham, B.A., Pfleeger, S., Hoaglin, D.C., El Emam, K., and Rosenberg, J. (2002). “Preliminary guidelines for empirical research in software engineering”. IEEE Transactions on Software Engineering, Vol. 28, Issue 8, pp. 721–734. Kitchenham, B.A., Dyba, T., and Jorgensen, M. (2006). “Evidence-based software engineering”. Proceedings of the 26th International Conference on Software Engineering (ICSE 2006), IEEE Computer Society, pp. 273– 281. Kitchenham, B.A. (2007). “Guidelines for Performing Systematic Literature Reviews in Software Engineering”. Version 2.3, EBSE Technical Report, Keele University, UK. Kitchenham, B.A. (2008). “The role of replications in empirical software engineering - a word of warning”. Empirical Software Engineering, Vol. 13, Issue 2, pp. 219-221. Koutsabasis, P., Spyrou, T., and Darzentas, J. (2007). “Evaluating usability evaluation methods: criteria, method and a case study”. Proceedings of the 12th international conference on Human-computer interaction: interaction design and usability (HCI’07), pp. 569-578. Leavit, M., and Shneiderman, B. (2006). “Research-Based Web Design & Usability Guidelines”. U.S. Government Printing Office. http://usability.gov/guidelines/index.html Lindsay, R.M., and Ehrenberg, A.S.C. (1993). “The Design of Replicated Studies”. The American Statistician, Vol. 47, pp. 217-228. Lynch, P., and Horton, S. (2002). “Web Style Guide: Basic Design Principles for Creating Web Sites”. 2rd ed. New Haven: Yale University Press. Malak, G., and Sahraoui, H. (2010). “Modeling Web Quality Using a Probabilistic Approach: An Empirical Evaluation”. ACM Transactions on the Web, Vol. 4, Issue 3, Article 9, 31 pages. Maxwell, K. (2002). “Applied Statistics for Software Managers”. Software Quality Institute Series, Prentice Hall. McCall, J.A., Richards, P.K., Walters, G. F. (1977). “Factors in software quality”. Vols. IIII, Rome Aid Defense Centre, Italy. McNeile, A. (2003). “MDA: The Vision with the Hole?”. Available at http://www.metamaxim.com/ download/documents/MDAv1.pdf. 344
Mendes, E. (2005). “A Systematic Review of Web Engineering Research”. Proceedings of the International Symposium on Empirical Software Engineering (ISESE’05), pp. 498–507. Microsoft corporation (2009). “Microsoft Web Design Guidelines”. Available at http://www.microsoft.com/spain/empresas/guias/usabilidad. Miller, J., and Mukerji, J. (2001). “Object Management Group: MDA Guide” Version 1.0.1. http://www.omg.org/docs/omg/03-06-01.pdf Mohagheghi, P., Gilani, W., Stefanescu, A., and Fernandez, M.A. (2012). “An empirical study of the state of the practice and acceptance of model-driven engineering in four industrial cases”. Empirical Software Engineering, Vol. 17, pp. 1-28 Molina, F., and Toval, A. (2009). “Integrating usability requirements that can be evaluated in design time into Model Driven Engineering of Web Information Systems”. Advances in Engineering Software, Vol. 40, Issue 12, pp. 1306-1317. Moody, D.L. (2001). "Dealing with Complexity: A Practical Method for Representing Large Entity Relationship Models". PhD Thesis, Department of Information Systems, University of Melbourne, Melbourne, Australia. Moraga, M.A., Calero, C., Piattini, M., and Diaz, O. (2007). “Improving a Portlet Usability Model”. Software Quality Control, Vol. 15, Issue 2, pp. 155-177. Moreno, N., and Vallecillo, A. (2008). “Towards interoperable Web engineering methods”. Journal of the American Society for Information Science and Technology, Vol. 59, Issue 7, pp. 1073-1092.Neuwirth, C.M., and Regli, S.H. (2002). IEEE Internet Computing Special Issue on Usability and the Web, Vol 6, Issue 2. Nielsen, J. (1993). “Usability Engineering”. Academic Press, London. Nielsen, J. (1994). “Heuristic evaluation”. Usability inspection methods, J. Nielsen and R.L. Mack. (Eds.), John Wiley & Sons, pp. 25-62. Nielsen, J. (2005). “Ten best intranets of 2005”. Jakob Nielsen's Alertbox. http://www.useit.com/alertbox/20050228.html. Object-Oriented Management Group (2008). “Software Process Engineering Meta-model v2.0 (SPEM 2)”. Formal/2008-04-01. Available at http://www.omg.org/technology/documents/formal/spem.htm. 345
Offutt, J. (2002). “Quality attributes of Web software applications”. IEEE Software: Special Issue on Software Engineering of Internet Software, pp. 25–32. Ogawa, R., Harada, H., and Kaneko, A. (1998). “Scenario-based hypermedia: A model and a system”. Thirty-First Hawaii International Conference on System Sciences, Vol. 2, pp. 47–56. Olsina, L., and Rossi, G. (2002). “Measuring Web Application Quality with WebQEM”. IEEE Multimedia, Vol. 9, Issue 4, pp. 20-29. Olson, J.R., and Olson, G.M. (1990). “The growth of cognitive modeling in human-computer interaction since GOMS”. Human-Computer Interaction, Vol. 5, pp. 221–265. Oztekin, A. Nikov, A. and Zaim, S. (2009). ‘‘UWIS: An assessment methodology for usability of web-based information systems’’. Journal of Systems and Software, Vol. 82, Issue 12, pp. 2038-2050. Panach, I., Condori, N., Valverde, F., Aquino, N., and Pastor, O. (2007). “Towards an Early Usability Evaluation for Web Applications”. Alain Abran, R.D., Antonia Mas (ed.): MENSURA 2007. LNCS 4895, pp. 32-45. Panach, I., Condori, N., Valverde, F., Aquino, N., and Pastor, O. (2008). “Understandability measurement in an early usability evaluation for model-driven development: an empirical study”. Proceedings of the 2nd International Symposium on Empirical Software Engineering and Measurement (ESEM’08), pp. 354-356. Panach, I., Aquino, N., and Pastor, O. (2011). “A Model for Dealing with Usability in a Holistic MDD Method”. User Interface Description Language (UIDL), Lisbon, Portugal. Pastor, O. (1992). “Diseño y desarrollo de un entorno de producción automática de Software Basado en el modelo orientado a objetos”. Tesis doctoral, Departamento de Sistemas Informáticos y Computación, Universidad Politècnica de Valencia. Petersen, K., Feldt, R., Shahid, M., and Mattsson, M. (2008). “Systematic mapping studies in software engineering”. Proceedings of the 12th International Conference on Evaluation and Assessment in Software Engineering (EASE), University of Bari, Italy. Petticrew, M. and Roberts, H. (2005). “Systematic Reviews in the Social Sciences: A Practical Guide”. Blackwell Publishing. 346
Ricca, F., Di Penta, M., Torchiano, M., Tonella, P., and Ceccato, M. (2010). “How Developers’ Experience and Ability Influence Web Application Comprehension Tasks Supported by UML Stereotypes: A Series of Four Experiments”. IEEE Transactions on Software Engineering, Vol. 36, Issue 1, pp. 96-118. Rosenthal, R. (1986). “Meta-Analytic Procedures for Social Research”. Sage Publications. Rumbaugh, J. (1991). “Object Oriented Modeling and Design”. Prentice Hall. Schwabe, D., and Rossi, G. (1995). “The object-oriented hypermedia design model”. Communications of the ACM, Vol. 38, Issue 8, pp. 45-46. Schmettow, M. (2012). “Sample size in usability studies”. Communications of the ACM, Vol. 55, Issue 4, pp. 64-70. Seffah, A., Donyaee, M., Kline, R.B., and Padda, H.K. (2006). “Usability Measurement and Metrics: A Consolidated Model”. Software Quality Journal, Vol. 14, Issue 2, pp. 159-178. Shull, F., Carver, J.C., Vegas, S., and Juristo, N. (2008). “The role of replications in Empirical Software Engineering”. Empirical Software Engineering, Vol. 13, Issue 2, pp. 211-218. Signore, O. (2005). “A Comprehensive Model for Web Site Quality”. Proceedings of the 7th IEEE Inter. Symposium on Web Site Evolution. IEEE Computer Society, pp. 30-36. Sjøberg, D.I.K., Anda, B., Arisholm, E., Dybå, T., Jørgensen, M., Karahasanovic, A., and Vokác, M. (2003). “Challenges and recommendations when increasing the realism of controlled software engineering experiments”. Empirical Methods and Studies in Software Engineering Experiences from ESERNET 2001-2003, LNCS 2765, pp. 24-38. Sjøberg, D.I.K., Hannay, J.E., Hansen, O., Kampenes, V.B., Karahasanovic, A., Liborg, N., and Rekdal, A.C. (2005). “A Survey of Controlled Experiments in Software Engineering”. IEEE Transaction on Software Engineering, Vol. 31, Issue 9, pp. 733-753.Somervell, J., and McCrickard D. (2004). “Comparing generic vs. specific heuristics: Illustrating a new UEM comparison technique”. Proceedings of the Human Factors and Ergonomics Society, pp. 2480-2484.
347
Sottet, J., Calvary, G., Coutaz, J., and Favre, J. (2007). “A model-driven engineering approach for the usability of plastic user interfaces”. Proceedings of the Working Conference on Engineering Interactive Systems, pp. 140-157. Ssemugabi, S., and De Villiers, R. (2007). “A comparative study of two usability evaluation methods using a web-based e-learning application”. Proceedings of the annual research conference of the South African institute of computer scientists and information technologists on IT research in developing countries (SAICSIT '07), pp. 132-142. Steuer, J. (1992). “Defining Virtual Reality: Dimensions Determining Telepresence”. Journal of Communication, Vol. 42, Issue 4, pp. 73-93. Sun Microsystems (2009). “Sun Guide to Web Style”. Available at http://www.sun.com/Webdesign. Sutcliffe, A. (2002). “Assessing the reliability of heuristic evaluation for Web site attractiveness and usability”. Proceedings of the 35th Annual Hawaii International Conference on System Sciences (HICSS’02), pp. 1838-1847. Sutton, J.A., Abrams, R.K., Jones, R.D., Sheldon, A.T., and Song, F. (2001). “Methods for Meta-Analysis in Medical Research”. John-Wiley & Sons. Tan, D., and Bishu, R. (2009). “Web evaluation: heuristic evaluation vs. user testing”. International Journal of Industrial Ergonomics, Vol. 39, pp. 621627. Tichy, W.F. (1998). “Should Computer Scientists Experiment More?”. IEEE Computer, Vol. 38, Issue 5, pp. 32-40. Turner, M., Kitchenham, B., Budgen, D., and Brereton, P. (2008). “Lessons learnt undertaking a large-scale systematic literature review”. Proceedings of the 12th International Conference on Evaluation and Assessment in Software Engineering, (EASE’08), BCS-eWiC, Vol. 8. Valderas, P., and Pelechano, V. (2011). “A survey of requirements specification in model-driven development of web applications”. ACM Transactions on the Web, Vol. 5, Issue 2, Article 10, 51 pages. Venkatesh V. (2000). “Determinants of perceived ease of use: integrating control, intrinsic motivations, and emotion into the technology acceptance model”. Journal Information Systems Research, Vol. 11, Issue 4, pp. 342– 65. 348
Virzi, R.A. (1997). “Usability Inspection Methods”. Handbook of HumanComputer Interaction. M. Helander, T. K. Landauer and P. Prabhu, Elsevier Science B.V.: 705-715.Wohlin, C., Runeson, P., Höst, M., Ohlsson, M.C., Regnell, B., and Wesslén, A. (2000). “Experimentation in Software Engineering: An Introduction”. Kluwer Academic Publishers. World Wide Web Consortium - W3C (2008). “Web Content Accessibility Guidelines 2.0 (WCAG 2.0)”. Caldwell, B., Cooper, M., Guarino Reid, L., Vanderheiden, G. (Eds.), http://www.w3.org/TR/WCAG20. Zelkowitz, M.V., and Wallace, D.R. (1998). “Experimental Models for Validating Technology”. IEEE Computer, Vol. 31, Issue 5, pp. 23-31. Zhao X., and Zou Y. (2007). “A Framework for Incorporating Usability into Model Transformations”. Proceedings of the Model Driven Development of Advanced User Interfaces (MDDAUI’07), CEUR-WS.org Vol-297, Paper no. 8.
349
Ph.D. THESIS . NOVEMBER 2012
The proposed usability inspection method has been instantiated in two industrial model-driven Web development methods: Object-Oriented Hypermedia (OO-H) and Web Modeling Language (WebML) in order to show the feasibility of the approach. In addition, the usability inspection method has been empirically validated by means of a family of experiments in OO-H and a controlled experiment in WebML.
A Usability Inspection Method for Model-driven Web Development Processes Adrián Fernández Martínez
Adrián Fernández Martínez
This PhD thesis aims to contribute towards addressing the aforementioned limitations by proposing a usability inspection method that can be integrated into different Model-Driven Web development processes. The method is composed of a Web Usability Model that breaks down the concept of usability into sub-characteristics, attributes and generic measures, and a Web Usability Evaluation Process (WUEP) that provides guidelines on how the usability model can be used to perform specific evaluations. The generic measures from the usability model must be operationalized in order for them to be applied to the software artifacts of different Web development methods and at different abstraction levels, thus allowing usability to be evaluated at several stages of the Web development process, especially during the early stages of development.
A Usability Inspection Method for Model-driven Web Development Processes
Web applications have become the backbone of business, information exchange, and social networks. In this kind of applications, usability is considered as one of the most important quality factors, since the ease or difficulty that users experience with this kind of systems will determine their success or failure. However, there are several shortcomings with the existing Web usability evaluation approaches such as: the concept of usability is only partially supported; usability evaluations are mainly performed when the Web application has been developed; the lack of guidelines on how to properly integrate usability into Web development, and the shortage of Web usability evaluation methods that have been empirically validated.
SUPERVISED BY DRA. SILVIA ABRAHÃO DR. EMILIO INSFRÁN tesis_adrian2.indd 1
25/10/12 00:25