A User-Driven Interface for Exploring Visualizations Daryl H. Hepting and Paul Schmiedge University of Regina, Regina, CANADA ABSTRACT There is presently a variety of methods by which to create visualizations, and many of these require a great deal of manual intervention. Even with those methods by which it is easy to create a single visual representation, understanding the range of possible visual representations and exploring amongst them is difficult. We present a generalized interface, called cogito, that permits the user to control exploration of the visualization output of various manual tools, all without the requirement to modify the original tool. Programming within the cogito API is required to connect to each tool, but it is not onerous. We consider that the exploratory experience or activity is valuable, and that it is possible to easily create this experience for standard tools that do not normally permit exploration. We illustrate this approach with several examples from different kinds of manual interfaces and discuss the requirements of each. Keywords: exploration, visualization, batch, scripts, modular visualization environments, toolkits, humancomputer interaction
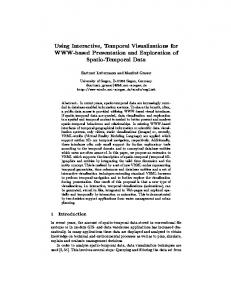
1. INTRODUCTION When Haber and MacNabb1 described the visualization pipeline, the question was how to realize a particular visual representation. Now, many years later, the question is how a user can find the particular visual representation that helps him or her gain some insight or communicate an idea. Sicard and Marck2 found cognitive, didactic, and aesthetic logics in scientific pictures, which are not separable without knowledge of the author’s intent. For them, scientific pictures are “imbued with the ‘view’ of the author which claims to be objective. But, in fact, it is attached to ‘thought history’, technological history, scientific history and is marked by aesthetic choices, cultural bias, and perceptional practices.” All in all, the selection of a visual representation involves more than objective consideration of the problem to be depicted. Consider that any visual representation can be decomposed into parameters, each with their own values. A parameter could be “graph type,” with values including “bar chart,” “pie chart,” “line chart,” “scatter plot,” and so on. Each visual representation can be denoted as an N -tuple, where vi is a value of parameter Pi . In practise, not all N -tuples may correspond to valid visual representations because of incompatibilities between values of different parameters. The Cartesian product of the values from all the parameters forms the N -dimensional space of available visual representations. hv1 , v2 , . . . , vN i ∈ P1 × P2 × . . . × PN The space of available visual representations can be very large, and it can be difficult to grasp the implications of all available combinations of values. This fact only exacerbates the problem of selecting and specifying the individual elements in a visual representation. In the midst of so many combinations, it can be difficult to find a visual representation that is apposite. The use of parameters and values to describe particular visual representations is an adaptation of Bertin’s3 retinal variables, which he used to systematically explore marks on a plane and to show how those marks could be used to construct diagrams, networks, and maps. Similar concepts are found in Modular Visualization Environments 4 (MVEs) such as AVS5 (Application Visualization System), and the toolkit philosophy of vtk .6 Figure 1 presents a sample visual representation, based on a small dataset from Bertin3 [page 100]. It provides a view of the French economy from the early 1960s. For each d´epartement in France, the data provides: the
Figure 1. One possible visual representation of Bertin’s data, constructed from parameters and values that specify features including the graph type, the annotation, the sorting of the data, and the colours.
workforce (in thousands of workers) for each of the three sectors (primary, secondary, and tertiary) in the economy; the total workforce (the sum of the three sectors); and the percentage of the workforce in each sector. Bertin3 remarked that “to construct 100 DIFFERENT FIGURES from the same information requires less imagination than patience. However, certain choices become compelling due to their greater ‘efficiency.’ ” But the question of efficiency is closely linked to the task at hand and the user’s experience with the elements of a visual representation, as Casner7 describes. Therefore, cogito 8–10 is designed to facilitate, through interactive articulation and evaluation of visual representations, each user’s own assessment of efficiency, while requiring far less patience than a manual approach. The remainder of the paper is organized as follows. Section 2 introduces relevant background about visualization tools. Section 3 describes the basic architecture of cogito and how it can act as an interface to various existing visualization tools. Section 4 describes use of the cogito with vtk, GNUplot,11 R,12 and openDX 13 in examples. Finally, Section 5 presents some conclusions and areas for future work.
2. BACKGROUND Through adaptation of the classification of Kochhar et al.,14 it is possible to distinguish manual, automatic, and augmented visualization systems based on the relationship that they establish between human and computer. Automated systems, like BOZ,7 appear to the user as black boxes, which are given input and produce output. They address the concern15 that the size of the visualization parameter space is typically so large that the user would be overwhelmed if he or she had to deal directly with it in its entirety. Augmented systems aid the user by allowing certain well-defined tasks to be performed primarily by the computer, with the effect of increasing people’s capabilities to tackle complex problems. Design Galleries,16 for example, works to provide a good sampling of the range of alternatives based on a user-specified means for comparison, given a priori. Jankun-Kelly and Ma’s spreadsheet interface17 allows exploration with greater context as the rows and columns of the spreadsheet show the values of the two different parameters being manipulated at any one time. However, the user must specify how each visual representation is to be constructed. Both of these systems lack flexibility, though, because they require a tight coupling with the software that realizes the alternatives for display. Furthermore, the a priori specification of an objective function required by Design Send correspondence to the first author: c/o Department of Computer Science, University of Regina, Regina, Saskatchewan, S4S 0A2, Canada. E-mail:
[email protected]
Galleries can limit the possibility for exploration. The spreadsheet approach is limited because it works with only two parameters at a time, though many more may be involved. The spreadsheet approach therefore decreases the likelihood that the best available visual representation may be found by the user. Manual systems provide the building blocks, but leave the responsibility for assembling these building blocks with the user. Therefore, exploration requires patience on the part of the user, who must explicitly specify new combinations and then keep track of his or her experiments in case any of them should need to be revisited. Even for problems with relatively small parameter spaces, an exhaustive evaluation of alternatives is almost always impractical. Instead, humans rely on heuristic search methods, which are likely to find acceptable solutions in a reasonable amount of time (what Simon18 called satisficing). These search heuristics can be of two sorts, in general. If the problem is well-understood, local search techniques may be employed effectively. If the problem is new, however, a global search of the space may be better suited to the exploration of alternatives. Manual systems do not necessarily lend themselves to either form of search. In both cases, either new programming must be done or an existing program must be invoked in a new way. Furthermore, humans are not suited to the bookkeeping required for these searches of parameter space and therefore usually rely on some form of external memory. Still, a manual approach remains attractive for those people who write the code for their own use or for use by a very focused community. That neither a global nor a local search is well-supported in general makes these searches less of a concern to developers of manual systems. In particular, we consider manual programs as falling into one of three categories: Batch Invocation Programs (BIPs) with GNUplot and R as examples; Scripted Modular Visualization Environments (SMVEs) with openDX as an example; and Toolkits and Application Programming Interfaces (TAPIs) with vtk as an example. These are considered, in order, in the following paragraphs. Fox19 has built a graphical user interface for R to support an introductory course in statistics. His goal is to ease introductory users into script writing directly in the Tcl/Tk20 command environment. Similarly, xgfe (Xwindows GNUplot Front End)21 presents users with the GNUplot functionality through the more familiar menus and buttons. Both of these graphical user interfaces are intended to introduce users to the native environments of each tool. They provide fairly complete access to the underlying capabilities of each tool. openDX comes with a graphical user interface and a scripting language. The graphical user interface provides visual programming capabilities, much like AVS5 and others. These were developed to ease the programming requirements for visualization. They provided a visual programming capability that offered several advantages for development over coding alone. However, visual representations constructed in these systems are dependent on these systems for viewing. The scripting interface allows a more traditional programming experience and may be preferable for more complicated tasks. The Visualization Toolkit,6 otherwise known as vtk, provides a great many capabilities to its users. As a toolkit, it can be seen as a collection of utilities or as a library of functions that a programmer may employ. An implementation using vtk requires programming knowledge, and so vtk ’s direct user base is limited to people with knowledge of at least one of the languages for which there exists an interface in vtk. The Visualization Toolkit began with a focus on coding that is more traditional than any of the other examples thus far considered. Its graphical interfaces have been developed more recently. Lefer22 describes a parsing system that analyzes the C++ implementation files of a vtk distribution, and provides the user with a graphical user interface mapped to the classes found within vtk. This interface allows direct manipulation of the vtk object properties without knowledge of any programming language but it also introduces users to the complexity of vtk itself. The user must still know something of vtk ’s render pipeline in order to construct a valid visual representation, and he must also understand what values are valid for a given interface within vtk. It does not provide a means to abstract the visualization from the specific tools needed to realize it. MayaVi23 and QteVTK24 represent more general means of interacting with a particular vtk visual representation using tools that are relevant to the exploration of the underlying data. As such, they have had success in providing the benefits of both MVEs and vtk. In all of the aforementioned cases of interfaces, it is difficult to get far from the underlying tool and to create an abstraction that is apart from command syntax. Side-Views25 modified the menus inside of GIMP ∗ ∗
GNU Image Manipulation Program, http://www.gimp.org
to show previews of various commands. However, this fine-grained preview requires substantial knowledge of the application before it can be undertaken. According to Perkins,26 a space can appear either as clue-rich (homing), in which the solution is evident, or clue-poor (Klondike), in which the solution must be found by “prospecting.” Insight may be gained by the transformation of a space from Klondike to homing, possibly through exploration. The power of the augmented systems, which support various forms of exploration, cannot easily be brought to the existing manual systems. What is required is a means of generating automatically particular alternatives for the user to evaluate. In the next section, we describe how this can be done through the cogito system.
3. ARCHITECTURE An interface for this exploration must be such that a user with little syntactic knowledge can navigate the space. The interface must produce complete visual representations and show enough context to permit navigation. A schematic is shown in Figure 2. Sims27 is one of several inspirations that embody what is called “interactive evolution”: a user directs the search of the visualization parameter space by making selections of complete visual representations, and those selections determine the makeup of the subsequent search space. The cogito system supports the user by managing the display of alternatives to illustrate the breadth of what is available (see Figures 2, 5, 6, 7, and 8). Some systems that provide multiple coordinated views28 require a great deal more from the user.
Figure 2. Schematic look at the interface: the parameter space of available alternatives is partitioned according to user-specified viewing criteria. Each partition (A – F) has a representative element (a – f), which is displayed to the user in separate cells in the interface. The subspace for the next search iteration is based on the user selection (b and f).
The main premise of the cogito architecture is interchangeability. The interface does not rely on a particular task or implementation of the parameter space. This was accomplished through separation of the cogito system into 3 distinct portions (Figure 3).
Figure 3. Design model for cogito system.
The User Interface portion implements the exploration aspects of cogito, and simply renders and responds to the interaction points—buttons, list selections, and so forth. This layer encapsulates each user’s conception of the problem.
The Core portion provides the main functionality of cogito itself. The cogito Core handles the invocation of the manual visualization tool controlled by the view selected by the user. In response to each invocation, the manual visualization tool provides a completed visual representation in a form that can be displayed in one of the cells of the interface, as depicted in Figure 2. This portion also handles the grouping of image layouts, history navigation, and system initialization. The Application portion provides the abstract interface by which the Core can communicate with a variety of manual visualization tools. To interface with cogito, the visualization system must articulate the parameters and values that it has to offer (this can be influenced by what the user wants to accomplish). This information is used by the Core portion to construct each invocation of the tool. It is useful to consider each of the manual visualization tools as providing a service to the cogito system, for the realization of requested visual representations (Figure 1, for example). The cogito system then becomes an example of a service-oriented architecture. Batch Invocation Programs are programs that can provide a visualization for a given parameter set through non-interactive techniques. Typically called from a command prompt with options appended to the execution command or a configuration file, cogito can interact with these programs by constructing command-line invocations with parameter flags or customized configuration files. Cogito supports a sophisticated XML-based configuration language that allows a developer to specify a parameter space and command syntax for virtually any batch-style process. Modular Visualization Environments are typically designed to encourage direct user interaction, supporting only limited forms of inter-process communication. However, many MVEs also provide scripting interfaces that can provide batch-style interaction. Using a specially generated script, MVEs can become like Batch Invocation Programs with the same style of interaction. A developer is then responsible for both an XML configuration and a scripting interface, but generally only the most basic of script files is needed. This script file provides a template or foundation for a wide variety of visual representations available from the MVE. Toolkits and APIs provide perhaps the most potential flexibility for visualization. It is frequently very interesting to explore the potential of an API such as OpenGL or vtk. In most cases, a toolkit developer can produce a simple program that cogito can use as a batch invocation process, but sometimes the full flexibility or efficiency of the program is best obtained through live interaction. Cogito supports a dynamic library version of application interface, to extend the potential for space exploration beyond simple static images or batch program output. A developer creates a shared object that extends cogito’s application interaction API, and generates whatever form of representation is desired. By addressing these three major forms of interaction for manual programs, cogito provides a great deal of both control and flexibility. Virtually any existing manual application can work within the cogito interface, usually with no modification to the existing code so long as batch-like interaction can be achieved. The only caveat is that someone with knowledge of how to interact with the manual application must be available when the application is first placed within the cogito interface. Note that detailed knowledge of the manual application’s capabilities is not required. This design allows the same interface to be used for a variety of different visualization tools. It is then easy for a user to switch between tools. A user needs only understand what options are available, not necessarily how they work, and cogito frees the user to explore the ramifications of these options in an intuitive and consistent manner. Interface specification is done in terms of the user’s view of the parameter space instead of the application’s available functionality.
4. EXAMPLES A common element to all interaction is the XML configuration file. One such file is included in Figure 4 and is described in the following subsection.
4.1. Batch Invocation Programs (BIPs) To demonstrate the effectiveness of a cogito connection to Batch Invocation Programs, we present sample applications created for R12 and GNUplot.11 These applications represent a class of applications designed for statistical analysis, and they can generate a variety of interesting graphics to enhance and present tabular data. GNUplot supports very simple interaction through configuration files that can contain data and instructions for representing that data. In our very simple example, we explore the various ways that a simple curve based on four data points can be graphed with a set of different graphing parameters. The data points remain constant, but we explore the various ways they may be represented. In Figure 4, the GNUplot XML configuration file is shown. GNUplot works with an external configuration file, so each of the named components is replaced in the example configuration file example.gpt with values drawn from the ranges defined in the XML file. As can be seen in this example, floating-point numbers can be defined by a range instead of listed explicitly. The y1coord is defined to be any value between 0.05 and 0.95 (inclusive) with samples taken at increments of 0.1. Meanwhile, the graph types, which are explicit named types from within GNUplot, are simple string types that are inserted into the configuration file directly. 0.05 0.95 0.1 csplines bezier unique 0.05 0.95 0.1 /sw/bin/gnuplot / ${APPDIR}configs/example.gpt
Figure 4. XML configuration file for GNUplot.
R12 is a much more complex data analysis tool. Typically used as an interactive command-based statistical interpreter, R command files are more akin to script files. R provides many more display options than GNUplot, and our example program allows a user to explore all the different representations of a multivariate survey of student abilities. Figure 6 shows our R sample through a cogito interface.
4.2. Scripted Modular Visualization Environments (SMVEs) OpenDX is a visual programming environment for data visualizations. Using data objects and connective symbols, users can create various visual representations of a variety of data types. It is particularly suited to displaying measurements of physics experiments. Moreover, its connectivity-style interaction is very powerful and can lead to a variety of new ways to explore the data—but it is difficult to intuit how the data connections work and what a given connection “means”. Figure 7 compares the normal OpenDX interface to an example running under cogito.
Figure 5. Screen shot of the cogito interface used to explore curve variations available within GNUplot.
As it is a graphical programming tool, OpenDX does not intuitively integrate with a batch-oriented paradigm for interaction. To create a batch-style interaction, though, is relatively simple. A basic image path is designed in OpenDX, and saved as an OpenDX script. These are ASCII text documents, so cogito can, with its XML configuration language, be trained to generate modified OpenDX scripts . For our example, the space explored covers a selection of transforms that can be performed on a given mesh model within OpenDX. This exploration allows a user to become comfortable with the various effects that can be applied to a mesh, and only the developer of the initial script and XML configuration need be moderately familiar with the semantics of OpenDX. As a highly sophisticated programming environment, OpenDX produced the largest sample space of all of our examples (see Table 4.3). Many of the explored components, that is, inputs to the program, are named cryptically and are difficult for a user to understand. But by exploring the parameter space visually through cogito, the user can ignore the complexity of the underlying software and focus on selecting the visual representation that is most meaningful to him or her.
4.3. Toolkits and Application Programming Interfaces (TAPIs) Our example of an API interacting with cogito is the vtk API.6 For this example, we attempted to replicate the Shapes9 application for cogito, which was originally implemented in OpenInventor.29 For this simple example, it was sufficient to create a basic command-line wrapper for vtk that runs in two modes: a batch mode that generates a single image of a shape based on parameters given on the command line, and an interaction mode that launches an exploration window for a given shape when launched without a specified output file.
Figure 6. R through a cogito interface.
Figure 7. On the left, a simple openDX application in the native graphical user interface. Notice the number of possible arguments to “image” (denoted by the number of tabs on the upper edge of the “image” block. On the right, a similar application presented through the cogito interface.
Example Program GNUplot
R
OpenDX
vtk
Components Explored (Elements) First Y-Coordinate (10) Second Y-Coordinate (10) Interpolation curve (3) Plot Type (5) X-Axis (5) Y-Axis (6) Factor (6) Background (6) Colour (6) Direction (4) Value (10) Number (10) Shapes (13) Colours (3) Transparency (4) Rotations (4x, 4y, 4z)
Total Space 300
900
14,400
9,984
Table 1. Size of parameter space for each example.
The cogito screen generated for vtk is seen in Figure 8. An additional feature of this particular example is the addition of the “Examine” button, defined as an extra action in the XML configuration. When the button is clicked, the same batch application is launched with the same configuration parameters. However, without any output specification, the program is immediately launched into the interactive three-dimensional viewer for the vtk sample. This feature demonstrates how cogito can be used to move from an exploration environment to a more traditional application seamlessly, allowing the user to take his or her final decision and begin working with it directly. Even though this is a simple example, the space of available visual representations contains nearly 10,000 alternatives: (13 shapes) × (3 colours) × (4 transparencies) × (4 rotations in x) × (4 rotations in y) × (4 rotations in z) = 9,984 points in the parameter space. The parameter space sizes of all of our examples are summarized in Table 4.3.
5. CONCLUSIONS The cogito interface provides the means both to obtain a global view of the contents of the parameter space and to make local modifications through the “New Space” dialogue box (see Figure 9). Being able to change one’s view of the current parameter space (through the “View Key”) enables a user to transform the space into one that is “homing.”26 Insight gained from the use of the cogito system could be applied to constructing a meaningful objective function for use with Design Galleries. Adaptation of the cogito interface to the various manual systems was straightforward, making further adaptations possible. We have shown that it is easy to create an exploratory experience for a manual tool with which a user might be familiar. A promising route may be the further abstraction of the applications from any specific tools, which would enable one to switch easily between GNUplot, R, OpenDX, and vtk as the tool which realizes the visualizations. From the user perspective, the same conceptual view of all these tools can be maintained.
ACKNOWLEDGEMENTS The authors wish to thank the University of Regina and the Natural Sciences and Engineering Research Council of Canada (NSERC) for funding through its Discovery Grant and Undergraduate Student Research Award programs. The authors also wish to thank the reviewers and Andrew Stubbs, from the University of Regina, for many helpful comments that improved the paper.
Figure 8. A sample screen showing the cogito interface to the vtk application.
Figure 9. A close up of the New Space dialogue obtained if the upper left and lower right images from Figure 8 are selected.
REFERENCES 1. R. B. Haber, B. Lucas, and N. Collins, “A data model for scientific of visualization with provisions for regular and irregular grids,” in Proc. of Visualization’91, pp. 298–305, (San Diego, CA), 1991. 2. M. Sicard and J.-A. Marck, “The importance of mental perception when creating research pictures,” in Exploiting Mental Imagery with Computers in Mathematics Education, R. Sutherland and J. Mason, eds., pp. 252–262, Springer-Verlag, New York, 1995. 3. J. Bertin, Semiology of graphics : diagrams, networks, maps, University of Wisconsin Press, 1983. translated by W. J. Berg. 4. G. Cameron, “Modular visualization environments: Past, present, and future,” Computer Graphics , pp. 3–4, November 1995. 5. C. Upson et al., “The application visualization system: A computational environment for scientific visualization,” IEEE Computer Graphics and Applications 9(4), pp. 30–42, 1989. 6. W. J. Schroeder, K. M. Martin, and W. E. Lorensen, “The design and implementation of an object-oriented toolkit for 3D graphics and visualization,” in Proceedings of Visualization 96, pp. 93–100, 1996. 7. S. M. Casner, “A task-analytic approach to the automated design of graphic presentations,” ACM Transactions on Graphics 10, pp. 111–151, April 1991. 8. D. H. Hepting, F. D. Fracchia, J. C. Dill, and R. D. Russell, “Cogito: a system for computer-aided visualization,” Tech. Rep. CMPT TR 96-02, Simon Fraser University, 1996. Unpublished technical sketch presented at SIGGRAPH 96. 9. D. H. Hepting, A New Paradigm for Exploration in Computer-Aided Visualization. PhD thesis, Simon Fraser University, 1999. 10. D. H. Hepting, “Towards a visual interface for information visualization,” in Proceedings of the Sixth International Conference on Information Visualization, E. Banissi, ed., pp. 295–302, IEEE Computer Society, 2002. 11. T. Williams and C. Kelly, gnuplot: An Interactive Plotting Program, April 2004. 12. W. Venables, D. Smith, and the R Development Core Team, An Introduction to R, Network Theory Ltd., 2004. 13. IBM Corporation, Yorktown Heights, NY, IBM Visualisation Data Explorer, 7th ed., May 1997. 14. S. Kochhar, J. Marks, and M. Friedell, “Interaction paradigms for human-computer cooperation in graphicalobject modelling,” in Proceedings of Graphics Interface ’91, S. MacKay and E. M. Kidd, eds., pp. 180–189, 1991. 15. J. Foley and W. Ribarsky, “Next-generation data visualization tools,” in Scientific Visualization, L. R. et al., ed., Academic Press, 1994. 16. J. Marks et al., “Design Galleries: A general approach to setting parameters for computer graphics and animation,” in SIGGRAPH ’97 Conference Proceedings, pp. 389–400, 1997. 17. T. J. Jankun-Kelly and K.-L. Ma, “Visualization exploration and encapsulation via a spreadsheet-like interface,” IEEE Transactions on Visualization and Computer Graphics 7(3), pp. 275–287, 2001. 18. H. Simon, Models of Discovery, Reidel, 1977. 19. J. Fox, “The R commander: A basic-statistics graphical user interface to R,” Journal of Statistical Software 14, September 2005. 20. J. K. Ousterhout, Tcl and the Tk Toolkit, Addison-Wesley Professional, 1994. 21. D. Ishee, X GNUplot Front End. http://www.uni-koeln.de/rrzk/software/grafik/visualization/xgfe/xgfe.html, 1998. 22. W. Lefer, “Automatic graphic user interface generation for vtk,” Plzen (R´epublique Tch`eque) , pp. 279–285, 2002. 23. P. Ramachandran, “Mayavi: A free tool for cfd data visualization,” 4th Annual CFD Symposium, Aeronautical Society of India , 2001. 24. S. L. Stoev and W. Strasser, “Qtevtk - a multi-platform, object-oriented visualization environment extending vtk,” in WSCG 2000 Conference Proceedings, V. Skala, ed., 2000.
25. M. Terry and E. D. Mynatt, “Creativity and interface: Supporting experimentation with side-views,” Communications of the ACM 45, October 2002. 26. D. N. Perkins, “Insight in minds and genes,” in The Nature of Insight, R. J. Sternberg and J. E. Davidson, eds., pp. 495–533, MIT Press, Cambridge, MA, 1995. 27. K. Sims, “Artificial evolution in computer graphics,” in Computer Graphics: SIGGRAPH ’91 Conference Proceedings, R. J. Beach, ed., pp. 319–328, ACM Press, 1991. 28. J. C. Roberts, “Exploratory visualization with multiple linked views,” in Exploring Geovisualization, A. MacEachren, M.-J. Kraak, and J. Dykes, eds., Amsterdam: Elsevier, 2004. 29. J. Wernecke, The Inventor Mentor, Addison-Wesley, 1994.