E
UNITED NATIONS
Economic and Social
WORKING PAPER NO 8
Council 4 May 2006 ENGLISH ONLY ECONOMIC COMMISSION FOR EUROPE
STATISTICAL COMMISSION
CONFERENCE OF EUROPEAN STATISTICIANS Group of Experts on Consumer Price Indices Eighth Meeting Geneva, 10-12 May 2006 Item 6 of the provisional agenda
A USER POINT OF VIEW ON CORE INFLATION MEASURES* Invited paper submitted by the European Central Bank
The meeting is organised jointly with the International Labour Office (ILO)
* This paper has been prepared by Mr. Laurent Bilke, European Central Bank, at the invitation of the Secretariat. Paper posted on Internet as received from the author.
A user point of view on core inflation measures
1
L. Bilke2
Preliminary version April 2006
This notes aims at clarifying the framework for assessing core inflation measures. At least three different goals can be assigned to them. It is shown that, while useful to describe current inflation developments, most (but not all) measures have no or limited information content for trend inflation. It is also very difficult to consider them as leading indicators of headline inflation.
1
Contributions from M. Lenza and A. Meyler and comments from G. Kenny H.-J. Klöckers are acknowledged. All remaining errors are the author’s responsibility. The views expressed herein are not necessarily the ones of the European Central Bank. 2 European Central Bank.
[email protected]
1
1 Introduction Central banks, in order to achieve their goal of maintaining price stability, need in practice to distinguish, within ongoing inflation developments, between short-term volatility and more lasting evolutions. As Blinder puts it when he describes his experience as a policy maker: “the name of the game was distinguishing the signal from the noise, which was often difficult (...) What part of each monthly observation on inflation is durable and what part is fleeting?” (Blinder, 1997). However, while this rationale is rather uncontroversial, central banks may communicate on their practice regarding it with some slight nuances. In particular, more or less emphasis can be placed on core inflation measures as a way to drop the short-term noise. Without going as far as using a core inflation measure as the targeted inflation, Bank of Canada refers to a core inflation which excludes from the initial CPI basket the eight most volatile components, as an "operational guide for monetary policy". Bank of Sweden regularly refers to a core inflation measure in its Inflation Report and publishes a forecast for it, although the core inflation measure of interest is defined in a different way (excluding indirect taxation or interest rate costs, as headline inflation includes owner occupied housing). To some extent, the ECB has made another choice: its monetary policy framework does not refer to a core inflation measure. It relies on a definition of price stability as a year on year increase in HICP inflation of below 2% over the medium term. The reference to the medium term precisely implies that the central bank removes some short term noise in its assessment of inflation developments. But if the ECB has shown maybe more reluctance than some other central banks to use a core inflation measure to clarify formally its monetary policy strategy, this obviously does not necessarily mean that these measures are considered as completely useless. The ECB reports
2
each month in its Monthly Bulletin - in the Section that describes the recent prices and costs developments - the evolution of an inflation measure excluding some volatile items, the HICP excluding unprocessed food and energy, but does not formally call it a “core inflation” measure. Less frequently, it also reports the developments in some other measures, like trimmed means (see ECB, 2001, for a broad overview, and ECB, 2005). The range of available core inflation measures is in fact very wide, and this stems first from a wide choice of possible empirical methods used to remove the noise, and second from substantial differences in the definitions which underlie these core inflation measures. How to compare so different measures as inflation excluding some fixed items or an estimation based on a dynamic factor model? There appears to be no absolute core inflation measure. As a consequence, the properties of a core inflation measure can only be assessed relatively to its assigned goal. The aims of the present note are to provide a framework for such an assessment, to establish a typology of the possible methods and uses of these core inflation measures, and to evaluate the properties of some core inflation measures. In that sense, it follows the framework proposed in ECB (2001) and updates some of its results. Three possible uses, interrelated, are described and correspond to three ways to assess the properties of these indicators. The rest of this note is organised as follows. Section 2 takes stock of the wide variety of methods, and proposes a typology. Section 3 describes three possible uses of these measures, while Section 4 shows how the properties of the various core inflation measures can be assessed. Lastly, Section 5 concludes on the usefulness of some core inflation measures today.
3
2 Alternative approaches to core inflation measurement The will to exclude short-term noise has translated into a wide range of core inflation measures. This variety stems from various possible definitions of the noise itself and many examples of noise can come to mind, for instance: “changing seasonal patterns, broad-based resource shocks, exchange-rate changes, changes in indirect taxes, and asynchronous price adjustment” (Cecchetti, 1997). But, the precise rationale for excluding each of them (for instance seasonal pattern and asynchronous price adjustment) may clearly vary from one to another. Therefore, it is necessary to define a set of possible economic or statistical criteria that one can refer too to justify the exclusion. The focus here will be on the statistical criteria, whereas a literature exists on model-based definitions of core inflation. Our view is that the latter are more rarely referred to in the day-to-day analysis of price developments by central banks. Several statistical criteria are regularly proposed to define the noise to be removed. They belong to two big families. The first is related with the idea to remove the developments that are specific to a few sectors and the second with the idea that the effect of short-term shocks should be disregarded. At least three different statistical criteria belong to the first family: volatility, idiosyncratic components, and largest changes in absolute value. They are related, but they place different emphasis on the moments of the distribution of each item level price change. The second one only covers the removal of the prices with low persistence and is less directly connected with the three previous criteria. In order to define these criteria, let us assume that price developments at the disaggregated level follow two components, a common one and a sector specific one3: x jt = χ t + ε jt 3
(1)
In that, we follow a usual framework, as formulated for instance by Wynne (1999).
4
with x jt stands for the growth rate of price for the good or service j at time t. χ t is the common component and ε jt is the sector specific component. A first possible criterion is volatility; reducing the noise may first mean excluding fully or partly the most volatile items. In that case, it is straightforward from equation 1 that if χ t and
ε jt are orthogonal, this means that we exclude the items for which var(ε jt ) is the high in relative terms. This criterion motivates the removal of particularly volatile series, like unprocessed food or energy, or of the seasonal factors which by definition increase the volatility of overall inflation. Another illustration is the Edgeworth type of index which weights each individual price change by the inverse of its variance over a certain period (Diewert, 1994, Hogan et al., 2001, and Pedersen, 2005). Second, the exclusion can be made for the idiosyncratic component, i.e. the part which is peculiar to a sector, as opposed to the common component of inflation developments. In that case, the core inflation measure is directly χ t and the whole of ε jt for each j is removed. Therefore, the higher var(ε jt ) and the bigger E (ε jt ) − E ( χ t ) in absolute term are, the more information will be removed from the given x jt .Some econometric methods (dynamic factor models) precisely aim at decomposing disaggregated price changes into an idiosyncratic and a common component. Another criterion is extreme changes: the items for which the price change is in the tale of the distribution of all the items prices changes at a given time – on one side and the other - are excluded. The idea is also very close to the two previous ones, but this time, on top of the variance and the mean, the shape of the distribution tales will have a particular importance. Trimmed mean measures (which exclude a given percentage of the distribution on each side)
5
are the usual illustration of this approach, while median inflation is a special case of it, with the trimming parameter set to 50%. Last, another possible criterion, less explored, is low persistence: the components that return quickly to their baseline after an external shock are less persistent, and therefore induce little lasting perturbation for the overall. For the sake of simplification, the inflation process at the item level can be rewritten as an autoregressive process and persistence can be proxied by the autocorrelation of order 14: x jt = ρ j (χ t −1 + ε jt −1 ) + µ jt
(2)
Focusing on the developments in the more persistent prices of the basket may be a way to track the more lasting developments, in line with the more forward looking conception of core inflation. Blinder (1997) for instance suggests reweighting the CPI basket according to (a) the persistence of each component and (b) its covariance with overall inflation. The idea of a persistence based measure has been implemented for instance at the Bank of England by Cutler (2001). To sum up, the first family of criteria aims at reducing the idiosyncratic part, with the following possible gradation: only volatility can be taken on board, or the other moments characterising the distribution can also be incorporated (from the mean to the shape of the whole distribution). The second family relies on a completely different framework and is based on an assessment of persistence. From an economic point of view, as idiosyncratic shocks may not be imputed to standard macro-economic determinants, removing the idiosyncratic component is therefore close to the idea of excluding exogenous shocks. Thus, the exclusion of indirect taxes or administrative prices can be included in this family. The
4
The most commonly used measure in the inflation persistence literature is the sum of the autoregressive coefficients of an auto-regressive process. Other possible inflation persistence measures are the half life, the largest autoregressive root and mean reversion.
6
removal of the less persistent items appears to be more motivated by the will to design a measure with some information content for future inflation developments. After a clarification of the various statistical criteria, the completion of this classification requires to deal with the implementation of the noise exclusion. In practice, there remain several ways to remove it, whatever the chosen statistical criterion is. At least two issues still differentiate the various measures: how is the new aggregate computed and how are the noisy items excluded over time? Table 1 below provides a quick overview of some of the most representative measures and it distinguishes between two types: the ones belonging to the first (“disaggregated”) are based on the exclusion of individual items (“pure exclusion”) or on a reweighing and the ones belonging to the second type (“aggregate”) are computed directly at an aggregate level. Regarding the disaggregated method, in most cases, the exclusion of the noise or the reweighting can be made once for ever or the noise part can be reassessed at each period. Table 1 – A classification of core inflation measures Disaggregated Pure exclusion Criteria for identifying the noise High variance
Once for ever
Time varying
HICPX
Aggregate Reweighting
Once for ever Diewert (1994) Hogan et al. (2001)
Time varying Pedersen (2005)
Idiosyncratic
Extreme changes Low persistence
Seasonal adjustment
DFM (Cristadoro et al., 2004) Trimmed mean Cutler (2001)
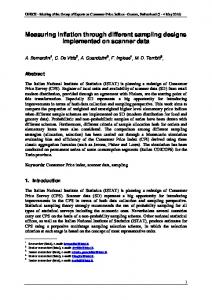
Within the broad range of core inflation measures, the noise is overall defined in terms of volatility or persistence. We have seen that the more volatile items and the less persistent ones 7
are more likely to be excluded, whatever the precise goal of the core inflation measure is. From this point of view, the current oil price shock may nowadays less appear as pure noise to be excluded. Charts 1 and 2 below present rolling estimates of both volatility and persistence (as measured by the sum of the autoregressive coefficients) of brent oil price (month-onmonth changes, in dollar). The range of rolling periods goes from 2 to 7 years. Unconditionally on the windows, the volatility of oil prices has decreased since the first half of the nineties. Turning to persistence, with the lower windows (2 and 3 years), the persistence of oil price shock appears to have significantly increased over the recent past, while the phenomenon is too recent to be captured by longer windows. Chart 1 – Rolling estimate of the volatility of Chart 2 – Rolling estimate of the persistence of crude oil price crude oil price 1.2
20 2y 3y 4y
16
5y 6y 7y
0.8 0.4
12 0.0
8 -0.4
4
2y 3y 4y
-0.8
5y 6y 7y
-1.2
0 84
86
88
90
92
94
96
98
00
02
04
84
86
88
90
92
94
96
98
00
02
04
3 Different motivations behind the use of core inflation As stated in Hogan et al. (2001), in a Bank of Canada paper, one should expect a core inflation measure to be “a good indicator of current and future trends in inflation”. That is the overall goal the various core inflation measures aim at achieving. Underlying inflation today shall be therefore evocative of ongoing and future inflation developments. This goal-oriented
8
definition suggests that two polar ways of considering core inflation can be distinguished. The first places the stress on its information content about current inflation developments (retrospective analysis, in the sense that current core inflation developments in practice relate to events which have already happened). The second places the emphasis on future inflation developments (prospective analysis). The two approaches are related as one expects underlying inflation to be informative about both current ongoing and future overall inflation developments. Some ambiguity in the discussion about core inflation measures may arise from the fact that with these two ways, more or less emphasis can be placed on one or the other side, leading to very different conceptions, expected properties and uses. In practice, underlying inflation can be therefore referred to with a view to describe or inform on current developments. The monitoring of and the communication on inflation developments indeed involves a need to identify the origin of current shocks impacting on price developments. In the ECB communication for instance, underlying inflation measures are referred to with the purpose to describe current developments. In fact this mention of underlying inflation developments can be understood as the first step of the sectoral analysis of inflation developments, motivated by the observation that inflation can be driven by sector specific determinants in the short-term. Within the framework of the breakdown of short-term inflation developments into five sectors, inflation excluding energy and unprocessed food excludes the expected more volatile component at this stage. By contrast, underlying inflation can also be referred to in practice as a forecasting tool of future inflation developments. For instance, many research papers asses the forecasting power of core inflation measures.
9
There is also maybe an intermediate way, in which core inflation is supposed to be indicative of trend inflation. Instead of core inflation being a leading indicator of overall inflation (including some noise), it is expected to be indicative of inflation developments corrected for some high frequency volatility. This conception is in practice between the two polar views: it is more forward looking than the purely retrospective analysis because formally focusing on trend provides more information on the future; but it is less forward looking than the purely prospective analysis (forecasting purpose) because the measure does not aim at forecasting the share of overall inflation movement that can be considered as noise, or which more generally moves overall inflation away from its trend. If a core inflation measure really captures trend inflation, then it can be considered as an attractor of headline inflation, in the sense that headline inflation is expected to fluctuate around it. To sum-up we propose to evaluate the properties of core inflation measures through three degrees of analysis: -
underlying inflation relates to current or past inflation in the less noisy components (descriptive approach);
-
underlying inflation is an indicator of trend inflation (attractor);
-
core inflation is a predictor of overall headline inflation developments.
10
4 Assessing the usefulness of core inflation measures This section aims first at defining the set of criteria one can refer too, for each of the three previous goals that can be assigned to core inflation. Then it applies them to a group of euro area measures. 4.1 Expected properties of core inflation measures The properties of the various core inflation measures should be assessed relatively to their assigned goal. As described in the previous section, three of them can be distinguished: a descriptive tool, an attractor for headline inflation or a leading indicator of headline inflation developments. This paragraph describes what could be the statistical properties we can expect for each of these three goals. The criteria required for the descriptive approach can be twofold. First, on the statistical side, one can probably expect that core and headline inflation have a similar mean. An additional desirable property could be that core inflation has a lower variance than headline inflation. Second, since the goal of the underlying inflation measure is to describe current developments, one could expect them to be easy to communicate. Wynne (1999) defines a set of criteria in order for an underlying inflation measure to be useful, among which: the measure should be computable in real time, it should have a track record (i.e. that it has already been widely explored), and it should be understandable by the public. We can add to this set of conditions that the measure should be stable in time, i.e. be not too frequently or too largely revised. The second possible goal for underlying inflation is to consider it as serving as an attractor for headline inflation. For instance, Vega and Wynne (2001) consider the ability of core inflation indicators to track trend inflation defined as a 36-month moving average. The performance of the measure is assessed via the difference between core inflation and this trend, in terms of
11
mean standard error. This approach is however debatable as it relies on an arbitrary definition of trend inflation. Moreover, and maybe more fundamentally, there is an uncertainty on the direction of the relationship between core and headline inflation: if core inflation is systematically catching up with headline inflation developments, then looking at core inflation would be of a relatively limited interest. Robalo Marques et al. (2003) propose a set of statistical criteria which answer these two points. They require simultaneously that: (1) core and headline inflation have the same trend, (2) core inflation plays as an attractor of headline inflation, but (3) that the inverse does not hold, i.e. that headline inflation is not an attractor of core inflation. The first condition imposes that underlying and headline inflation measures are cointegrated with unit coefficients, i.e. the log difference between the two series in level must be stationary5. The second implies that core inflation Granger causes headline through an error correction term. Therefore, in an ECM equation of headline inflation, the coefficient associated with the long-term relationship is expected to be significantly different from zero and negative. The third condition implies that core inflation is strongly exogenous, i.e. there is no error correction term in the equation of core inflation and that headline inflation does not Granger cause core inflation. Last, it is also possible to consider core inflation as an indicator of future headline inflation developments. For instance, Le Bihan and Sédillot (2000) as well as Cristadoro et al. (2004) have considered the ability of several core inflation indicators to forecast headline inflation, by gauging the out-of-sample forecast error. 4.2 Implementation for three core inflation measures We now turn to the implementation of these criteria to three measures for the euro area: HICP inflation excluding unprocessed food and energy (HICPX), a trimmed mean measure (with a trimming of 16% on each side of the distribution), and a dynamic factor index (DF, from 5
Note on stationarity
12
Cristadoro et al., 2004). It should be borne in mind that the quantitative estimate provided below are subject to some caveats, due to the relatively small size of the sample period under review (10 years6). Table 2 and 3 below summarise the evaluations of the first set of criteria. Only the dynamic factor measure has the same mean as inflation, but this is by construction, whereas HICPX and the trimmed mean measure have a lower average over the sample period. Regarding volatility, both the dynamic factor index and HICPX have a lower standard deviation than overall inflation. In terms of communication, the measure which excludes a fixed basket (energy and unprocessed food) has clearly an advantage over the two others: it has a better track record, is certainly more easily understandable, and appears more stable in time. Most central banks which may place some emphasis on core inflation developments usually refer officially to fixed exclusion measures, probably firstly because of their communicability properties. Table 2 – Can core inflation measures be used for the descriptive analysis? Statistical criteria
Average Std. Dev.
Inflation
HICPX
Trimmed mean
0.16 0.13
0.14 0.07
0.15 0.19
DF 0.16 0.03
Month on month rates. Feb. 1996 to Feb. 2006.
6
Most of the time, the sample period hereafter is February 1996 to February 2006. HICP excluding unprocessed food and energy is however available since 1992, but all the results presented in this section related with this measure hold for both sample period (1996-2006 and 1992-2006).
13
Table 3 – Can core inflation measures be used for the descriptive analysis? Ability to be communicated Excl. energy and unpro. Trimmed mean Dynamic factor Food Computable on real time Track record Understandable Stable in time
*** *** *** ***
** * ** ***
** * * *
This represents a qualitative assessment from the author. The table has to be read as following: in the first line, the first measure (excl. energy and unpro. food) is slightly more easily computable in real time than the two others.
However, a description of current shocks may not be the only goal of a core inflation measure, and one may wish to consider it as giving some indication on trend inflation. Table 4 below reports the results regarding the second set of criteria which allows us to evaluate the ability of the measures to be considered as attractors for headline inflation. The test for cointegration with unit coefficients is subject to some caveats given the usual low power problem. In order to deal with this issue, both the Augmented Dickey-Fuller test and the Kwiatkowski-Phillips-Schmidt-Shin test are used. As they are based on symmetric null hypothesis, our procedure can be seen as robust to the low power problem. As expected over such a sample period (Jan. 1996 to Feb. 2006), the results are balanced. Cointegration can be firmly rejected only for HICP excluding unprocessed food and energy, whereas the trimmed mean and the dynamic factor measures can or cannot be considered as cointegrated with overall inflation, depending on the test. Regarding the next criteria, the permanent exclusion measure cannot be considered as an attractor of headline inflation. However headline inflation itself can not be considered as an attractor of this core inflation measure and it is even strongly exogeneous to the developments
14
in this core inflation measure. If the latter property is a desirable one, it can not be sufficient, as the HICPX measure fulfils none of the required two previous conditions to be considered as an attractor itself. The trimmed mean measure is an attractor for headline inflation. But the reverse also holds, as headline inflation is also an attractor of core inflation. Therefore this measure should be used with a certain degree of caution: it is indicative of trend inflation, but to the same extent than headline inflation itself. Table 4 – Can core inflation measures play as attractors of headline inflation? Excl. energy and unpro. Food
Trimmed mean
Dynamic factor
Cointegration with unit coefficients ADF test KPSS test
NO NO
NO YES
NO YES
Core inflation Granger causes headline through an ECM
Long term coeff. T Stat
NO -1.46E-02 [-1.10968]
YES -0.007467 [-5.34935]
YES -0.077398 [-2.22992]
Headline inflation does not Granger cause core through an ECM (lambda=0)
Long term coeff. T Stat
YES 1.80E-03 [0.25705]
NO 1.28E-02 [6.90836]
YES 1.92E-03 [1.01291]
Strong exogeneity
Wald p value
YES 0.64
-
NO 0.01
Note: for the cointegration test "yes" if type I error < .05 for ADF and "yes" if type I error > .05 for KPSS
15
Only the dynamic factor measure satisfies the two conditions of being an attractor and not being attracted at the same time. Though, the very last condition – strong exogeneity - is not fulfilled, this formally means that the short-term dynamics in headline inflation can influence core inflation developments. However, the probability that these coefficients associated with headline inflation lags in the equation of core inflation sum to zero cannot be rejected. Thus, if the DF measure does not formally satisfy the last condition of strong exogeneity, this should not be considered as too problematic. With regard to the forecasting ability, studies of the out sample forecast errors of usual underlying inflation measures generally conclude that these indicators may have a relatively low ability to predict overall inflation developments (see for instance Rich and Steindel, 2005). Exclusion based measures (HICPX and the trimmed mean) exhibit particularly low performance. This statement can be considered as directly resulting from the previous observations: as these measures have a relatively low ability (if not no ability at all) to be considered as attractors for headline inflation, one cannot expect them to be good leading indicators. Regarding the dynamic factor index, Cristadoro et al. (2004) have this promising result that their index can beat a random walk in real time. In an unreported exercise, we also find that this measure can beat an autoregressive process and that it has undoubtedly a strong advantage over the other core inflation measures in that respect.
5 Conclusion Core inflation measures are certainly useful tools for monetary policy analysis in real time, but they must be handled with a high degree of carefulness and they have many limitations.
16
There is no perfect core inflation measure in absolute terms, given that the assessment on each core inflation measure is conditional on its assigned goal. Regarding some of the measures which are usually referred to in the euro area, the exclusion measures, like HICP inflation excluding unprocessed food and energy or a trimmed mean, are useful indicators to detail the sector-specific shocks that currently affect inflation developments. However, they have no (HICPX) or limited (trimmed mean) information content for trend inflation. ECB (2005) clarifies this and highlights that in the recent past these measures have sometimes been lagging headline inflation developments. When a gap between headline and these core inflation measures opens because of an oil price shock, as was the case in 2005 and at the beginning of 2006, it has to be expected that HICP excluding energy and unprocessed food will move a bit in the direction of overall inflation, since the oil price shock will at least partly be passed through to the non-energy sectors with some lag. One of the measures one can use for analytical purposes – the dynamic factor model proposed by Cristadoro et al. (2004) – can be considered as giving some indication on trend inflation, which is a decisive difference with the two other measures. There is even evidence that it could be helpful for the purpose of forecasting headline inflation. However, in practice, inflation forecasts can only rely on a broad assessment of the economic situation and it would not be prudent to consider that a single indicator can be sufficient for the purpose of forecasting. Lastly, the treatment of energy price developments as noise (i.e. with high volatility and low persistence) can appear to some extent less justified today. As highlighted in ECB (2005), it could be particularly misleading to consider as “core” or “underlying” a measure which would exclude a possibly lasting shock.
17
REFERENCES Blinder, Alan, 1997, Commentary, The Federal Reserve Bank of St. Louis Review, 79(1). Cutler, Joanne, 2001, “Core inflation in the UK”, External MPC Unit Discussion Paper, 3. Cristadoro, Riccardo, Mario Forni, Lucrezia Reichlin and Giovanni Veronese, 2004, “A measure of core inflation for the euro area”, forthcoming in Journal of Money, Credit and Banking. Diewert, W.E., 1995, “On the stochastic approach to index numbers”, Discussion Paper No. DP95(31), Department of Economics, University of British Columbia. ECB, 2001, “Measures of underlying inflation in the euro area”, Monthly Bulletin, Jul. ECB, 2005, “Diverse patterns in headline and underlying inflation”, Monthly Bulletin, Nov. Le Bihan, Hervé, and Franck Sédillot, 2000, “Does core inflation help forecast inflation? Out-ofsample evidence from French data”, Economics Letters, 69, 261-266. Pedersen, Michael, 2005, “An alternative measure of core inflation”, Danmarks Nationalbank Working Papers, 33. Rich, Robert, and Charles Steindel, 2005, “A review of core inflation and an evaluation of its measures”, Federal Reserve Bank of New-York, mimeo. Robalo Marques, Carlos, Pedro Duarte Neves, and Luís Morais Sarmento, 2003, “Evaluating core inflation indicators”, Economic Modelling, 20(4), 765-775. Hogan Seamus, Marianne Johnson, and Thérèse Laflèche, 2001, “Core inflation”, Technical Report No. 89/ Bank of Canada. Vega, Juan Luis, and Mark Wynne, 2001, “An evaluation of some measures of core inflation for the euro area”, German Economic Review, 4(3), 269-306. Wynne, Mark, 1999, “Core inflation: a review of some conceptual issues”, ECB Working Paper,5.
18
19