Measuring Driving Styles: A Validation of the Multidimensional Driving Style Inventory Hanneke Hooft van Huysduynen, Jacques Terken, Jean-Bernard Martens, and Berry Eggen Eindhoven University of Technology P.O Box 513, 5600MB Eindhoven The Netherlands {H.Hooft.van.Huysduynen, J.M.B.Terken, J.B.O.S.Martens, J.H.Eggen}@tue.nl ABSTRACT
The aim of this study was to validate the stability of the different factors of the Multidimensional Driving Style Inventory (MDSI) [16], which was originally developed and validated with participants in different geographical areas of Israel. In this study, the questionnaire was distributed in the Netherlands and Belgium. A factor analysis of the data of 364 participants revealed five of the eight factors that resulted from the original factor analysis: Angry driving, Anxious driving, Dissociative driving, Distress-reduction driving, and Careful driving style. In addition, 24 items divided over the five factors seem to be stable compared to the 44 items divided over the eight factors of the original analysis. The factors revealed through the analysis of these data were used to determine driver profiles, consisting of one or two driving styles. The next step is to compare self-report data on driving style to actual driving behaviour. Author Keywords
Driving Style, Driving behaviour, Human factors, SelfReport, Questionnaire, Factor Analysis ACM Classification Keywords
H.1.2 User/Machine Systems: Human factors INTRODUCTION
Advanced Driver Assistance Systems (ADAS) are developed with the purpose of increasing safety, efficiency and driver comfort and reducing driver’s workload. These systems interact with the driver with the purpose to advise or assist the driver or take over control altogether in certain driving situations [12]. To the extent that the advice or assistance requires drivers to deviate from their typical behavioural patterns, acceptance of those systems may be jeopardized. For Permission to make digital or hard copies of all or part of this work for personal or classroom use is granted without fee provided that copies are not made or distributed for profit or commercial advantage and that copies bear this notice and the full citation on the first page. Copyrights for components of this work owned by others than the author(s) must be honored. Abstracting with credit is permitted. To copy otherwise, or republish, to post on servers or to redistribute to lists, requires prior specific permission and/or a fee. Request permissions from
[email protected]. AutomotiveUI '15, September 01 - 03, 2015, Nottingham, United Kingdom. Copyright is held by the owner/author(s). Publication rights licensed to ACM. ACM 978-1-4503-3736-6/15/09…$15.00 DOI: http://dx.doi.org/10.1145/2799250.2799266.
instance, if a speed advice system advises the driver to slow down or if a speed control system reduces the speed of the car without a clearly perceivable and obvious need, drivers who are used to drive at a higher speed may not adopt the advice or allow the vehicle to reduce the speed of the vehicle. The typical behavioural patterns of drivers are usually referred to by the term ‘driving style’ [8]. This includes the choice of driving speed, headway, overtaking of other vehicles and the tendency of commiting traffic violations [3]. In order to learn more about compliance towards ADAS we need to understand how the compliance to ADAS is influenced by people’s driving style. Such insight will enable us to explore means to influence people’s willingness to comply with such systems that are tuned to the needs and interests of specific driver groups. It appears evident that what might influence or persuade one group may not work at all for another group [9], or may even encourage greater involvement in risky behaviour [17]. An easy way to determine drivers’ driving style is by means of a questionnaire, giving information about someone’s self-reported driving style. Several self-report measures of driving behaviour, style and cognition have been constructed and validated over the last couple of years. In this paper, we will review several driving style questionnaires that have been proposed in the literature and then validate one to be used for our further research. Driving Style Questionnaires
Gulian et al. developed the Driver Behaviour Inventory (DBI) [7] to study dimensions causing driver stress. This questionnaire covered vehicle use, demographics, accidents, convictions and attitudes towards those, health, work and personal problems, moods, emotions and attitudes towards driving and other road users. The 35 items of the questionnaire highlighted driver stress reactions. A factor analysis of the 35 items revealed five factors including feelings as aggression, irritation when overtaking, alertness, dislike and frustration when failing to overtake. As the DBI focuses on driver stress, other factors determining driving style are not addressed in this questionnaire, rendering the DBI less useful for our research. Reason et al. developed a Driver Behaviour Questionnaire (DBQ) [14] consisting of 50 items covering five classes of
aberrant behaviour: slips, lapses, mistakes, unintended violations, and deliberate violations. Participants had to indicate for each item on a five-point scale how often they committed that behaviour while driving. The analyses of the results of this questionnaire resulted in three factors: violations, dangerous errors and silly errors. As the DBQ focuses on aberrant behaviours, non-aberrant aspects of typical driving behaviour are not addressed, therewith rendering the DBI less useful for our current purpose. Furnham and Saipe developed a Driver Behaviour Questionnaire [6] measuring risk taking on the road. The results of the 25 items of the questionnaire revealed five factors: feeling and expressing aggression, law breaking behaviour, expressing confidence in taking driving risks, the excitement of driving and taking risks when driving. These factors describe differences in driving behaviour but do not represent different driving styles. Breaking the law, for example, can be part of a driving style, but is not a driving style by itself. French et al [5] revealed six dimensions labelled speed, calmness, planning, focus, social resistance (advise) and deviance through a principal component analysis of fifteen driving style questions. The outcomes of the Driver Style Questionnaire (DSQ) [5] were used to describe the relation between driving style, decision-making style and accident liability. The results showed that thoroughness (one of the factors resulting from the analysis of the decision making style questionnaire) correlated with all the driving styles and idealism correlated with none of the driving styles. The weakness of this questionnaire is the distribution of fifteen items over six dimensions resulting in two or three items per dimension. Lajunen and Summala [11] developed the driver Skill Inventory (DSI) to measure self-reported safety motive and skill dimensions. The 29 items relate to perceptual-motor skills and safety orientation [10], referring to the ability to drive in a safe and skilful manner by assessing their abilities to a hypothetical average driver on a five-point scale. This questionnaire taps into driving skills and safety motives rather than driving style. Ishibashi et al. [8] define driving style as an attitude, orientation and way of thinking for daily driving. They developed a Driving Style Questionnaire consisting of eighteen questions divided over eight components: Confidence in driving skill, Hesitation for driving, Impatience in driving, Methodical driving, Preparatory manoeuvres at traffic signals, Importance of automobile for self-expression, Moodiness in driving and Anxiety about traffic accidents. Through analysis of car following behaviour at low speed, they examined the validity of the questionnaire. Results showed, for example, a positive relationship between confidence in driving skill and the use of the gas pedal. The weakness of the questionnaire is that each component consists out of two items.
Taubman-Ben-Ari et al. [16] suggested four broad driving styles: (1) Reckless and careless driving, which is correlated with violations and thrill seeking while driving, characterized by for example higher speed. (2) Anxious driving, referring to feelings of alertness and tension. (3) Angry and hostile driving, characterized by more use of the horn and flash functionality. (4) Patient and careful driving, reflecting a well-adjusted driving style. Building on these four broad styles they created the Multidimensional Driving Style Inventory (MDSI) [16] consisting of 44 items. A factor analysis revealed eight main factors. (a) Dissociative driving, in which people are easily distracted and dissociated during driving. (b) Anxious driving, in which people show signs of anxiety and lack of confidence. (c) Risky driving, in which people seek for sensation and more risky driving. (d) Angry driving, in which people tend to be hostile and aggressive. (e) High-velocity driving, in which people tend to drive faster and are more time driven. (f) Distress-reduction driving, in which people engage in relaxing activities to reduce stress. (g) Patient driving, in which people are polite to other road users and have no pressure of time. (h) Careful driving, in which people drive carefully and structured. The MDSI [16] consists of items which were adapted from several other existing surveys, such as the DBI of Gulian et al. [7] studying dimensions defining driver stress, the DBQ [14] developed by Reason et al. about aberrant behaviour, the DBQ developed by Furnham and Saipe [6] measuring risk taking on the road, and the DSQ of French et al. [5] describing the relation between driving style, decisionmaking style and accident liability. Additionally, original items were created to complete the questionnaire. Taubman-Ben-Ari et al. [16] conducted their study in various geographical areas in Israel. To be able to use the MDSI in future studies in another geographical region we needed to conduct a independent validation of the questionnaire. So the aim of this study is to validate the eight main factors and loadings found by Taubman-Ben-Ari et al. through distribution of the same questionnaire among drivers in the Netherlands and the Dutch speaking part of Belgium. METHOD Participants
Three hundred twenty five participants volunteered to participate in this study and completed the online questionnaire. In addition, forty participants volunteered to participate in the study of a master student Industrial Design completed the same questionnaire. Of the participants who filled in the online questionnaire (N=365) the majority drove most of their miles in the Netherlands (N=197, 54%) and Belgium (N=116, 32%). Other participants drove most of their miles in: Greece (N=11), Germany (N=8), United Kingdom (N=4), India (N=4), Malaysia (N=4), Europa (N=3), Italy (N=2),
Portugal (N=2), Turkey (N=2), Australia (N=2), United Stated (N=2), Bulgaria (N=1), Ireland (N=1), Sweden (N=1), Russia (N=1), Mexico (N=1), Japan (N=1), United Arab Emirates (N=1) and South Africa (N=1). Two hundred eighty one participants completing the online questionnaire were male and eighty-four were female. Twenty one percent were within the age category 17 to 24, forty one percent were between the age of 25 and 39, thirty five percent were between the age of 40 and 65, and three percent were older than 65. Three quarter of the participants indicated that they make use of a navigation system (N=278, 76%) and half of the participants indicated that they use Cruise Control (N=189, 52%). A fifth indicated that they make use of an Advanced Parking Assist System (N=81, 22%), five percent (N=20) indicated that they make use of Adaptive Cruise Control, four percent (N=14) that make use of a Blind Sport Warning System and one percent (N=4) of the participants indicated to use a Lane Departure Warning System. Procedure and Measure
The questionnaire was offered in two different languages: English and Dutch. Instead of literally translating the questions from English, the English version was translated into Dutch with the aim to preserve the meaning of the questions as much as possible. Both versions were distributed through Facebook, email and both Dutch and Flemish online automotive forums. Participants were asked to complete an online questionnaire that consisted out of six questions relating to their demographic data and driving history and the multidimensional driving style inventory of Taubman-BenAri et al [16] consisting of 44 statements. The questions related to the demographic data and driving history concerned gender, age category, duration of being in possession of a driver’s license, miles driven per year, in which country the most annual mileage were driven and which driver’s support systems are used. The multidimensional driving style inventory (MDSI) [16] is a validated self-report questionnaire by which each statement is rated on a six-point scale (“not at all” to “very much” and in the Dutch version also “never” to “always” depending on the statement). This questionnaire assesses eight factors resulting from the original analysis: Dissociative driving (8 items, Cronbach’s alpha .82), Anxious driving (7 items, Cronbach’s alpha .82), Risky driving (5 items, Cronbach’s alpha .83), Angry driving (5 items, Cronbach’s .80). High-velocity driving (6 items, Cronbach’s alpha .76), Distress-reduction driving (4 items, Cronbach’s alpha 75), Patient driving (4 items, Cronbach’s alpha 74) and Careful driving (5 items, Cronbach’s alpha 0.76).
RESULTS AND DISCUSSION MDSI Factors Reproduced
Identical to the factor analyses performed by TaubmanBen-Ari et al. [16], a factor analysis with Varimax rotation was conducted with eight factors to determine if the items would be divided over the same eight factors compared to the results of Taubman-Ben-Ari et al. [16]. Next to the factor analysis with eight factors a second analysis with six factors was conducted as a follow up on the results of the first analysis. The first analyses revealed eight factors of which two factors did not have enough items to have a meaningful contribution. Finally, an Oblique Principal Component Cluster Analysis (OPCCA) was conducted as a check to the results of the Varimax factor analysis. In OPCCA the dimensions do not have to be orthogonal, which tends to deliver factors that are easier to interpret. In all three analyses, item nine was not taken in consideration due to a mistake in the set-up of the questionnaire, which resulted in missing data of item nine for 146 participants (40%). In addition, one of the participants was removed from the analyses. SPSS indicated multiple answers of this participant as outliers and inspection of the answers for this participant revealed internal inconsistencies, indicating that this person’s answers were not reliable. The first factor analysis was conducted with the answers of 364 participants revealing a distribution of the 43 items over eight factors explaining 49% of the variance. In Table 1 the item distribution can be found. Factor 1 consists of seven items addressing angry and frustrated behaviour when driving. This factor, explaining 14% of the variance (Cronbach’s alpha .81), was labelled “Angry driving style”. Factor 2 consists of five items addressing risky and thrill seeking behaviour. This factor, explaining 11% of the variance (Cronbach’s alpha .83), was labelled “Risky driving style”. Factor 3 consists of seven items addressing nervous and anxious driving behaviour. This factor, explaining 6% of the variance (Cronbach’s alpha .74), was labelled “Anxious driving style”. Factor 4 consists of nine items addressing nonchalant, dissociated behaviour, except for item 19, which addresses assertive, risky behaviour. This factor, explaining 5% of the variance (Cronbach’s alpha .67), was labelled “Dissociative driving style”. Factor 5 consists of five items addressing careful and cautious behaviour. This factor, explaining 4% of the variance (Cronbach’s alpha .63), was labelled “Careful driving style”. Factor 6 consists of four items addressing behaviour to become relaxed, less stressed. This factor, explaining 3% of the variance (Cronbach’s alpha .54), was labelled “De-stress driving style”. Factor 7 consists of two items addressing dissociated behaviour. This factor explains 3% of the variance (Cronbach’s alpha .11). Factor 8 consists of four items addressing two different types of behaviours, two items address careful behaviour and two
Table 1: Results of two factor analysis (Loadings are from the second analysis) 43 3 28 12 17 13 2
Factor 1 | Angry Driving Honk my horn at others Blow my horn or “flash” the car in front as a way of expressing frustrations When someone does something on the road that annoys me, I flash them with high beam Swear at other drivers When a traffic light turns green and the car in front of me doesn’t get going immediately, I try to urge the driver to move on When a traffic light turns green and the car in front of me doesn’t get going, I wait for a while until it moves [-] Purposely tailgate other drivers
Loadings .803 .771 .733 .657 .692 .503 .413
44 22 24 6 29
Factor 2 | Risky Driving Enjoy the excitement of dangerous driving Like to take risks while driving Like the thrill of flirting with death or disaster Enjoy the sensation of driving on the limit Get a thrill out of breaking the law
.832 .737 .701 .657 .732
31 10 40 4 25 33 41 8
Factor 3 | Anxious Driving Feel nervous while driving Driving makes me feel frustrated Feel comfortable while driving [-] Feel I have control over driving [-] It worries me when driving in bad weather Feel distressed while driving Always ready to react to unexpected manoeuvres by other drivers [-] While driving, I try to relax myself [-]
.799 .744 .720 .534 .499 .445 .429 .331
5 19
Factor 4 | Dissociative Driving Attempt to drive away from traffic lights in third gear (or on the neutral mode in automatic cars) Forget that my lights are on full beam until flashed by another motorist Nearly hit something due to misjudging my gap in a parking lot Plan my route badly, so that I hit traffic that I could have avoided Intend to switch on the windscreen wipers, but switch on the lights instead Fix my hair / makeup while driving Distracted or preoccupied, and suddenly realize the vehicle ahead has slowed down, and have to slam on the breaks to avoid a collision Drive through traffic lights that have just turned red When someone tries to skirt in front of me on the road, I drive in an assertive way in order to prevent it
42 14 23 7 41
Factor 5 | Careful Driving Tend to drive cautiously Drive cautiously Base my behaviour on the motto “better safe than sorry" On a clear freeway, I usually drive at or a little below the speed limit Always ready to react to unexpected manoeuvres by other drivers
.706 .686 .581 .425 .403
1 37 26 11
Factor 6 | Distress-Reduction Driving Style Do relaxing activities while driving Use muscle relaxation techniques while driving Meditate while driving I daydream to pass the time while driving
.683 .662 .518 .617
15 30
Factor 7 Lost in thoughts or distracted, I fail to notice someone at the pedestrian crossings Misjudge the speed of an upcoming vehicle when passing
38 16 18 32
Factor 8 Plan long journeys in advance In a traffic jam, I think about ways to get through traffic faster At an intersection where I have to give right-of-way to oncoming traffic, I wait patiently for crossing traffic to pass Get impatient during rush hour
35 27 39 36 34 20 21
9 When in a traffic jam and the lane next to me starts to move, I try to move into that lane as soon as possible The grey items were removed from the second analysis; the italic items do not correlate with the same items compared to the original factor analysis
.648 .597 .530 .465 .453 .508 .496 .447
items address frustrated risky behaviour. This factor explains 3% of the variance (Cronbach’s alpha .31).A constraint was set to have at least three items per factor [13] and in combination with the low Cronbach’s alpha factor 7 was removed from the analysis. As a Cronbach alpha value indicates the overall reliability of a questionnaire of which at least 0.7 is considered good [4:681]. The items in factor 8 are heterogeneous which makes it difficult to label this factor and in combination with the low Cronbach’s alpha the decision was made to also remove this factor from the analysis. As item 19 addresses assertive, risky behaviour which is not in line with the other items in factor 4 this item was also removed from further analysis. As a follow up on the results of the first factor analysis a second factor analysis with Varimax rotation consisting of six factors was conducted in which items 9, 15, 16, 18, 19, 30, 32 and 38 were left out as those do not fit in the six main factors used in this analysis. This analysis revealed a distribution of 36 items over six factors explaining 48% of the variance. In Table 1 the item distribution can be found, as mentioned above, the items in grey are discarded in this analysis and the last column provides the factor loadings of each item. Factor 1 consists of seven items labelled “Angry driving style”. This factor explains 16% of the variance (Cronbach’s alpha .81). Factor 2 consists of five items labelled “Risky driving style”. This factor explains 12% of the variance (Cronbach’s alpha .83). Factor 3 consists of eight items labelled “Anxious driving style”. This factor explains 6% the variance (Cronbach’s alpha .76). Factor 4 consists of eight items labelled “Dissociative driving style”. This factor explains 5% of the variance (Cronbach’s alpha .68). Factor 5 consists of four items labelled “Careful driving style”. This factor explains 4% of the variance (Cronbach’s alpha .65). Factor 6 consists of four items labelled “De-stress driving style”. This factor explains 4% of the variance (Cronbach’s alpha .54). Another method to investigate different clusters of items projected within one dimension is an Oblique Principal Component Cluster Analysis (OPCCA). This analysis was performed as a validation to the factors resulting from the second analysis. For the OPCCA analysis the same 37 items used for the second factor analysis were used. This analysis revealed five main clusters with a second eigenvalue smaller than 1,2 (indicating that they are indeed clustered one dimensionally): Factor 1, Careful Driving (Cronbach’s alpha .85); Factor 2, Anxious Driving (Cronbach’s alpha .75); Factor 3, Angry Driving (Cronbach’s alpha .81); Factor 4 Distress-Reduction Driving (Cronbach’s alpha .55); and Factor 5 Dissociative Driving (Cronbach’s alpha .70). In this analysis, the items of Careful driving and Risky driving (resulting from the second analysis) were combined into one factor, labelled Careful driving (as the items of Risky driving are negative in this factor).
MDSI Factors Original and Reproduced
The original factor analysis of the MDSI [16] revealed eight factors: Dissociative driving , Anxious driving, Risky driving, Angry driving, High-velocity driving, Distressreduction driving, Patient driving, and Careful driving. As can be seen in Table 1, six of these factors could be reproduced with a Varimax rotation using data mainly collected within the Netherlands and Belgium. The items in italics in Table 1 are items that are assigned to other factors within the original factor analysis compared to the second analysis performed within this study. Removing these items resulted in twenty-four items divided over six factors that seem to be stable. Five factors still have enough items when taking the constraint of at least three items per factor. The factor Careful driving resulting from the second analysis does not have enough items left to have a meaningful contribution. The OPCCA revealed five factors of which the factor labelled Careful Driving in the second analysis is combined with Risky Driving. If we compare the outcomes of the one-dimensional OPCCA with the original factor analysis by Taubman-Ben-Ari et al. [16], we arrive at five stable factors with a minimum of at least three items per factor in which Careful and Risky are combined to six items. These analyses result in a questionnaire that exists of twenty four items tapping into feelings, attitudes and behaviours, with a distribution over five clusters: Careful driving, Angry Driving, Anxious Driving, Dissociative driving and Distress-Reduction Driving. Driving styles and Driver Profiles
One of the reasons to conduct this study was to investigate the possibility to categorise people’s driving style on the basis of their self-reported driving behaviour. Categorisation of people’s driving style can help in understanding how to incorporate certain aspects of behaviours in ADAS to enhance compliance towards these systems. For example, drivers who are categorized as Risky drivers may prefer a smaller headway compared to Careful drivers. This aspect might be incorporated in an ADAS to enhance compliance. The next question is how we can determine people’s driving style. The factor analysis with Varimax rotation revealed six driving styles. The simplest method is to use the average scores for each factor (summing the scores of the items assigned to each factor and dividing the sum by the number of items) and taking the highest scoring factor as someone’s driving style. This method identifies 331 (91%) participants as Careful drivers. Thus, this method has little discriminating power. A second method takes the factor loadings into consideration for the different items. In this method a person’s score for each item is multiplied with the factor loading of that item and then the average score for each factor is calculated for each person. This method identifies 299 (82%) participants as Careful drivers, still having little discriminating power. In the third method “the factor loadings are adjusted to take account of the initial correlations between items” [4]. Accordingly, the
item scores are multiplied by the adjusted factor loadings, and the average of the resulting scores is taken across the items for each factor for each individual. The factor with the highest average is taken as the participants driving style. This method revealed an almost equal distribution of participants over the six different factors when taking the highest score as identifying someone’s driving style. As mentioned by Field [4:634], this is a more sophisticated method for calculating factor scores, providing factor scores which show the deviation of each participant from the mean of that factor. If someone scores high on a factor according to the factor score, that person scores high relative to the average of the scores of all participants within the same factor. It should be noticed, however, that all these methods take the highest scoring factor as indicative of someone’s driving style, therewith ignoring the scores for the other factors. This may be satisfactory for one-dimensional constructs, but there is no a priori reason to assume that driving style is a one-dimensional construct. If we take driving style as a multi-dimensional construct, it might be more appropriate to talk about driver profiles, so that someone might be said to be both a careful and attentive driver.
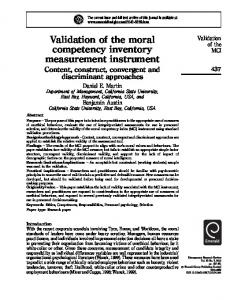
Figure 1: Distribution Driver Profiles
diversity of the drivers that participated in the survey (see Figure 2). This plot reveals no obvious clustering, from which it may be concluded that not all people can be categorised as for instance either an angry or careful driver. The scores on all the factors together determine what type of driver someone is, therewith providing further support for the notion of driver profile.
To determine driver profiles, the factors obtained from the second factor analysis were used, giving rise to six different factors. The factor scores of each participant as calculated by the third method above were normalized by subtracting the mean from each factor score and dividing by the standard deviation. The means and standard deviations (SD) were calculated across the six factor scores of each participant. Next, a threshold was calculated by taking the mean + 1 SD of each participant to see which factor scores for each individual driver exceeded the calculated threshold (this method is similar to the method used by Shahab et al. [15]). The profile of an individual was then built on the factor(s) which exceed the threshold value. Applying this method resulted in 21 different profiles consisting of one or two driving styles. For 11 participants no profile could be determined, due to the fact that none of their factor scores exceed the threshold. As can be seen in Figure 1, 272 (75%) of the participants are allocated to a profile consisting of one driving style. The profiles shown in Figure 1 indicate that within the sample of 364 participants, for example, 49 participants are angry drivers compared to the other participants and 48 are careful drivers in comparison to the rest. Figure 1 provides an overview of the division of driving styles with respect to all the participants within the sample. As a final check, driver profiles were also determined on the basis of the outcomes of the OPCCA analysis. In this method the factor scores resulting from the OPCCA were subjected to multidimensional scaling and the outcomes were visualized in a two-dimensional plot, identifying both the relationships between these constructs and illustrating
Figure 2: Two-Dimensional Visualization of One-Dimensional Analysis CONCLUSION AND GENERAL DISCUSSION
Advanced Driver Assistance Systems have the potential to improve traffic safety and throughput when drivers comply to use these systems. If these systems do not meet drivers’ needs and expectations, drivers will refrain from using them. Provided that different people are sensitive to different forms of persuasion, as shown in [9], the notion of driver profiles may help to identify common differences in characteristics between groups of drivers. A first step to identify differences between drivers is by means of a questionnaire giving information about someone’s self-reported driving style . This paper described
the validation of the Multidimensional Driving Style Inventory developed by Taubman-Ben-Ari et al. [16]. The analysis of the results of 364 participants completing the questionnaire showed that most of the original factors could be replicated quite well, with 24 of the 44 original items divided over five or six main factors. A factor analysis with Varimax rotation revealed six factors among the 24 items and an OPCCA analysis revealed five factors: Dissociative driving, Anxious driving, Risky driving, Angry driving, Distress-reduction driving, and Careful driving (Risky and Careful driving are combined in OPCCA revealing five factors). As a side note, it needs to be kept in mind that the Cronbach alpha values of the Distress-reduction style within all the three analyses is below the acceptable threshold of 0.7 and therefore should be interpreted with caution.
The purpose of the research was to validate the questionnaire to know if this questionnaire can measure driving styles in future studies. A next question is how the results of the MDSI (self-reported behaviour) are correlated with actual behaviour in a vehicle or driving simulator. For such driving style questionnaires to be meaningful, they should predict actual driving behaviour. This can enhance the understanding of driving styles and the relation to certain behaviours and help to decide which direction to take when investigating how persuasive systems can be used to influence the compliance towards ADAS.
The scores gained from the analysis were used to create driver profiles consisting of one or more driving styles. The first two methods that were used to identify driving styles identified most drivers as Careful drivers. This may be due either to respondents giving socially desirable answers, or to the fact that people in general try to avoid accidents. Anyway, these methods are not discriminating enough. The third method resulted in 21 driver profiles. It needs to be kept in mind that these profiles created are relative within the sample. People who are categorized as angry drivers are angry drivers in comparison to the other drivers within the sample. This means that a driver who is categorized as an angry driver in this study may not be an angry driver in an absolute sense, comparing to all drivers outside this study.
REFERENCES
ACKNOWLEDGEMENTS
This research project is part of the Impuls Programme of the Eindhoven University of Technology and we are grateful to Marin Sikkenk for making her data available for this study. 1.
Bekiaris, E., Amditis, a., and Panou, M.DRIVABILITY: a new concept for modelling driving performance. Cognition, Technology & Work 5, (2003), 152–161.
2.
Constantinescu, Z., Marinoiu, C., and Vladoiu, M.Driving style analysis using data mining techniques. International Journal of Computers, Communications and Control 5, 5 (2010), 654–663.
3.
Elander, J., West, R., and French, D.Behavioral correlates of individual differences in road traffic crash risk: an examination of methods and findings. 113, 2 (1993), 279–294.
The scores resulting from the OPCCA were used and rendered jointly in a two dimensional space. The render of the scores does not reveal obvious clustering of the drivers participating in the survey, indicating that characterizing drivers in terms of a single dominant driving style is too simple. The scores on all the factors together determine what type of driver someone is.
4.
Field, A.Discovering Statistics Using SPSS. In Sage Publications, 2009.
5.
French, D.J., West, R.J., Elander, J., and Wilding, J.M.Decision-making style, driving style, and selfreported involvement in road traffic accidents. Ergonomics 36, 6 (1993), 627–44.
The two dimensional plot resulting from the OPCCA analysis can be used for selection of participants in follow up studies to create a balanced representation of different driving styles.
6.
Furnham, A. and Saipe, J.Personality correlates of convicted drivers. Personality and Individual Differences 14, 2 (1993), 329–336.
7.
Gulian, E., Matthews, G., Glendon, A.I., Davies, D.R., and Debney, L.M.DIMENSIONS OF DRIVER STRESS. Ergonomics 32, 6 (1989).
8.
Ishibashi, M., Okuwa, M., Doi, S., and Akamatsu, M.Indices for characterizing driving style and their relevance to car following behavior. SICE Annual Conference 2007, IEEE (2007), 1132–1137.
9.
Kaptein, M., De Ruyter, B., Markopoulos, P., and Aarts, E.Adaptive Persuasive Systems: A Study of Tailored Persuasive Text Messages to Reduce Snacking. ACM Transactions on Interactive Intelligent Systems 2, 2 (2012), 1–25.
Another aspect that has to be taken into consideration is that the results are a context-free and momentary self-report. Multiple factors may influence drivers’ behaviour, such as the driving environment, traffic conditions, the driver’s condition and personal characteristics (gender, age, driving experience, etc.) [2]. As mentioned by Bekiaris et al. [1] driver behaviour is not necessarily static, but evolves over time and in context, as dependent on the ability to drive and the driving performance of a particular person in a specific environment and under specific circumstances. This notion should be taken into consideration when making use of a self-report measurement of someone’s driving behaviour.
10.
Lajunen, T., Parker, D., and Stradling, S.G.Dimensions of driver anger, aggressive and highway code violations and their mediation by safety orientation in UK drivers. Transportation Research Part F: Traffic Psychology and Behaviour 1, 2 (1998), 107–121.
11.
Lajunen, T. and Summala, H.Driving experience, personality, and skill and safety-motive dimensions in drivers’ self-assessments. Personality and Individual Differences 19, 3 (1995), 307–318.
12.
Nirschl, G.Human-Centered Development of Advanced Driver Assistance Systems. In M.J. Smith and G. Salvendy, eds., Human Interface and the Management of Information. Interacting in Information Environments. Springer Berlin Heidelberg, Berlin, Heidelberg, 2007, 1088 – 1097.
13.
Raubenheimer, J.An item selection procedure to maximise scale reliability and validity. SA Journal of Industrial Psychology 30, 4 (2004).
14.
Reason, J., Manstead, A., Stradling, S., Baxter, J., and Campbell, K.Errors and violations on the roads: a real distinction? Ergonomics 33, 10-11 (1990), 1315–1332.
15.
Shahab, Q., Terken, J., and Eggen, B.Development of a questionnaire for identifying driver’s personal values in driving. Proceedings of the 5th International Conference on Automotive User Interfaces and Interactive Vehicular Applications AutomotiveUI ’13, ACM Press (2013), 202–208.
16.
Taubman-Ben-Ari, O., Mikulincer, M., and Gillath, O.The multidimensional driving style inventory-scale construct and validation. Accident; analysis and prevention 36, 3 (2004), 323–332.
17.
Taubman-Ben-Ari, O. and Yehiel, D.Driving styles and their associations with personality and motivation. Accident Analysis and Prevention 45, (2012), 416–422.