Page 1 of 27
Transactions on Multimedia Computing Communications and Applications
A Video Bitrate Adaptation and Prediction Mechanism for HTTP Adaptive Streaming ASHKAN SOBHANI, University of Ottawa, Canada ABDULSALAM YASSINE, University of Ottawa SHERVIN SHIRMOHAMMADI, University of Ottawa, Canada HTTP Adaptive Streaming (HAS) has now become ubiquitous and accounts for a large amount of video delivery over the Internet. But since the Internet is prone to bandwidth variations, HAS’s up and down switching between different video bitrates to keep up with bandwidth variations leads to a reduction in Quality of Experience (QoE). In this paper, we propose a video bitrate adaptation and prediction mechanism based on Fuzzy logic for HAS players, which takes into consideration the estimate of available network bandwidth as well as the predicted buffer occupancy level, in order to proactively and intelligently respond to current conditions. This leads to two contributions: First, it allows HAS players to take appropriate actions, sooner than existing methods, to prevent playback interruptions caused by buffer underrun, reducing the ON-OFF traffic phenomena associated with current approaches and increasing the QoE. Second, it facilitates fair sharing of bandwidth among competing players at the bottleneck link. We present the implementation of our proposed mechanism and provide both empirical/QoE analysis and performance comparison with existing work. Our results show that compared to existing systems, our system has 1- better fairness among multiple competing players by almost 50% on average and as much as 80% as indicated by Jain’s fairness index, and 2- better perceived quality of video by almost 8% on average and as much as 17%, according to the eMOS model. Categories and Subject Descriptors: H.5.1 [Multimedia Information Systems]: Video—algorithms, design, experimentation; I.2.8 [Problem Solving, Control Methods, and Search]: Scheduling General Terms: Experimentation, measurement, performance Additional Key Words and Phrases: HAS; Fuzzy-based Controller; Adaptation; Video bitrate; ON-OFF Traffic; Prediction; Grey Model; Adaptive Moving Average ACM Reference Format: Ashkan Sobhani, Abdulsalam Yassine, and Shervin Shirmohammadi, 2015. A multi-frequency MAC specially designed for wireless sensor network applications. ACM Trans. Embedd. Comput. Syst. 9, 4, Article 39 (March 2015), 21 pages. DOI:http://dx.doi.org/10.1145/0000000.0000000
1. INTRODUCTION
The trend of video streaming, both in industry and academia, has significantly shifted towards HTTP Adaptive Streaming (HAS), because HTTP packets can travel across firewalls and Network Address Translators [Begen, et al. 2011, Kuschnig, et al. 2011] without any restrictions. The features of HAS were proposed for the first time by [Carmel et al. 2002], and were standardized with the name of MPEG-DASH [(MPEG) IJSW. 2010] as the first international standard of adaptive video bitrate HTTP-based streaming solution. Previously, Internet video players used the progressive download feature of HTTP to watch video streams. But this method suffers from two major shortcomings. First, the user or the player has to somehow select a suitable video bitrate, which may well lead to selecting a bitrate that does not match the incoming bandwidth. As a result, the user may suffer from interruptions and video freezes caused by buffer depletion. Second, users with fast Internet connection could waste huge amounts of bandwidth.
Author’s addresses: A. Sobhani, A. Yassine and S. Shirmohammadi, Computer and Electrical Engineering Department, University of Ottawa. Permission to make digital or hardcopies of part or all of this work for personal or classroom use is granted without fee provided that copies are not made or distributed for profit or commercial advantage and that copies show this notice on the first page or initial screen of a display along with the full citation. Copyrights for components of this work owned by others than ACM must be honored. Abstracting with credits permitted. To copy otherwise, to republish, to post on servers, to redistribute to lists, or to use any component of this work in other works requires prior specific permission and/or a fee. Permissions may be requested from Publications Dept., ACM, Inc., 2 Penn Plaza, Suite 701, New York, NY 10121-0701 USA, fax +1 (212) 869-0481, or
[email protected]. © 2010 ACM 1539-9087/2010/03-ART39 $15.00 DOI:http://dx.doi.org/10.1145/0000000.0000000
ACM Transactions on xxxxxxxx, Vol. xx, No. x, Article xx, Publication date: Month YYYY
https://mc.manuscriptcentral.com/tomm
Transactions on Multimedia Computing Communications and Applications
For example, a user can download a long video very fast, but could stop playback after few seconds, wasting the bandwidth of the unwatched portion of the video. HAS solves these problems by applying an adaptation controller at the player side which selects the most appropriate video bitrate based on players’ conditions (e.g. buffer, screen resolution, etc.) and the underlying network conditions. Hence, HAS keeps the simplicity of progressive downloading, but at the same time allows for automatic adaptation to current network conditions without user intervention. Because of such properties, HAS is now adopted by most of the popular Over The Top (OTT) video solutions in the market such as Apple HTTP live steaming [Pantos. 2015], Microsoft smooth streaming [Zambelli. 2009a], Adobe HTTP dynamic streaming [Hassoun. 2010], Echostar Move Adaptive Stream [Echostar.2009] and Netflix [Netflix]. In HAS, each video sequence is compressed into multiple video bitrates with different resolutions and qualities. These compressed versions are called representations. Each representation is fragmented into several segments with constant duration, stored at different servers. The URL addresses of the representations and the corresponding information e.g. bitrates are incorporated in a manifest file called Media Presentation Description (MPD). By means of the information provided in the MPD file, the player should find the best-suited candidate among the available representations to be played back at each round. To do so, the player utilizes an adaptation logic which adapts the player’s requests to the current conditions such as the available network bandwidth, the level of playback buffer, and the type of players’ devices. The main goal of the player is to maintain the highest perceived quality of the streaming video. To achieve such a goal, the following challenges should be addressed: First, performing up and down switching between different representations of the video in order to keep up with bandwidth variations may lead to significant reduction in the Quality of Experience (QoE) [Mok, et al. 2012a]. Second, the player might encounter playback interruptions caused by sudden increases in congestion level or equivalently abrupt decline in incoming bandwidth. Third, there will always be an inevitable mismatch between real network throughput and the selected video bitrate. Such mismatch is the result of the innate variation of encoded video bitrate, throughput measurement uncertainties, and the limited number of available video representations. Fourth, selecting the right video bitrate requires a mechanism to continuously observe or predict the throughput and the buffer dynamics. Fifth, unfairness and instability are common among players competing for shared bandwidth over a bottleneck link. Therefore, video bitrate adaptation methods must be designed in a way to minimize the negative effect of ON-OFF traffic pattern [Akhshabi, et al. 2012a] and allow players to converge to an equilibrium point where they fairly share the bandwidth at the bottleneck link. The above challenges serve as motivation to design our mechanism based on Fuzzy-logic. In this paper, we propose a video bitrate adaptation and prediction mechanism for HAS that copes with the uncertain balance between stability and adaptability. Our proposed Fuzzy-logic Controller (FLC) takes two inputs: an estimation of the available network bandwidth utilizing Kaufman’s Adaptive Moving Average (KAMA) proposed in [Kaufman. 1995], and the buffer prediction level based on Grey model [Liu, et al. 2010]. The main contributions of our work are as follows: a) We propose an FLC mechanism for HAS that dynamically controls the rate of the requested video and provides intelligent decision-making for downloading subsequent video segments. Our method tackles the challenge of defining the precise buffer thresholds by considering the fuzzy aspects of buffer thresholds. b) Our proposed mechanism progressively downloads segments as long as there is a representation with a video bitrate higher than the estimated available bandwidth. This is important because it reduces the ON-OFF traffic pattern in those cases, in turn reducing instability and unfairness among competing players and hence positively affecting the QoE. Our mechanism allows the TPC congestion controller to stay active more often that regular HAS, and consequently, as it is shown in our
ACM Transactions on xxxxxxxx, Vol. xx, No. x, Article x, Publication date: Month YYYY
https://mc.manuscriptcentral.com/tomm
Page 2 of 27
Page 3 of 27
Transactions on Multimedia Computing Communications and Applications 3
experimental results, players using our proposed method share the available bandwidth more fairly compared to other existing HAS methods. c) We propose, for the first time, the use of KAMA, to enable HAS players to be responsive to the sustainable and stable change in the bandwidth and at the same time not to unnecessarily react to short-term bandwidth fluctuations. In other words, the players maximize the network utilization without continuously changing the video bitrates. This further reduces the up and down switching between different representations and leads to a significant increase in QoE. d) We propose a Grey-model predictor, which allows the FLC to make decisions based on the predicted buffer level. This means the FLC can proactively respond to the current conditions using the predicted buffer level and take an appropriate action sooner than existing methods, especially when the chance of buffer underrun is high. Buffer underrun is the main cause of playback interruptions. Our Grey-model predictor helps the controller keep the buffer at a reliable level at all times. The rest of the paper is organized as follows: In the next section, we discuss the related work, followed by the system architecture in Section 3. In Section 4, we present the experimental results, and finally in Section 5 we conclude the paper and provide directions for future work. 2. RELATED WORK
In general, adaptation methods can be placed into two main categories [Thang, et al. 2014, Li, et al. 2013]: throughput-based [Zambelli. 2009, Liu, et al. 2011, Thang, et al. 2012, Xiong, et al. 2012] and buffer-based [Miller, et al. 2012, Akhshabi, et al. 2012b, Huang, et al. 2014, Le, et al. 2013, Tian and Liu. 2012]. In throughput-based methods, the player chooses the appropriate video representation just by considering the measured bandwidth. However, knowing the underlying network condition is complex and hence precisely measuring or estimating the TCP throughput is not trivial. For this reason, throughput-based methods often employ various mechanisms to predict the end-to-end available bandwidth. Examples include Exponential Weighted Moving Average (EWMA), Holt Winters, Autoregressive model, Support Vector Regression (SVR), Multi-Layer Perceptron (MLP) etc. as discussed in [Bouten, et al. 2015]. Among these prediction methods, EWMA [Thang, et al. 2012, Akhshabi, et al. 2012b] is more favorable, because it works passively and does not impose any further communication burden on the network. Furthermore, a cross session approach proposed by [Jiang, et al. 2015] can be used to obtain an accurate throughput prediction for a new session using temporal and spatial similarity between the new session and other sessions within a time window, where there is no profile of measured segment throughputs for the new session. On the other hand, using buffer-based methods, players make decisions regarding the next video representation based on the current context of the playback buffer in order to play the video in a smooth manner. As pointed out in [Thang, et al. 2014], in buffer-based methods, different ranges are defined for the buffer level, such that different actions can be taken by the controller accordingly. It is very challenging to determine the buffer thresholds in such methods. Authors of [Spiteri, et al. 2016] propose an interesting optimization problem, which aims to find the optimum buffer thresholds in order to maximize the QoE modeled using two metrics of the average video bitrate and playback smoothness. In addition, [Beben, et al. 2016] propose a method that makes use of a pre-computed buffer map to find the highest available video representation such that by downloading that, avoiding video freeze is guaranteed. Moreover, since buffer-based methods react sluggishly to bandwidth variations compared to throughput based methods, some works, e.g [Juluri, et al. 2015a], and leverage throughput prediction in order to react faster to the bandwidth variations. Also [Juluri, et al. 2015a, Juluri, et al. 2015b] goes further, and proposes using the information of segment sizes provided in the MPD file to proportionally assign different weights to be used in the ACM Transactions on xxxxxxxx, Vol. xx, No. xx, Article xx, Publication date: Month YYYY
https://mc.manuscriptcentral.com/tomm
Transactions on Multimedia Computing Communications and Applications
weighted harmonic mean download rate. Such information can be used later by the adaptation mechanism to make a more accurate decision. For instance, [Juluri, et al. 2015a] utilizes the weighted harmonic mean of previously measured segment throughputs whose weights are proportional to the corresponding segments’ sizes to improve throughput prediction. There are several other studies that aim at maximizing the QoE [Mok, et al. 2012b, Bouten, et al. 2015, Li, et al. 2014a, Joseph and de Veciana. 2014]. Since switching up and down between different representations can lead to reduction in QoE [Alberti, et al. 2013, De Vriendt, et al. 2013, Chen, et al. 2014], some adaptation algorithms such as [Akhshabi, et al. 2012b, Sobhani, et al. 2015, Huang, et al. 2014, Jiang, et al. 2014] use Additive Increase and Multiplicative Decrease (AIMD) to improve the player’s QoE smoothly instead of rough increases. As pointed by [Liu, et al. 2011], the main reason of such a conservative step-wise is to reduce the risk of playback interruptions which is possible in case of aggressive switch up. AIMD allows the player to deal with sudden increases in congestion level or equivalently an abrupt decline in incoming bandwidth. The proposed adaptation method in [Yin, et al. 2015] is based on model predictive control (MPC). This method considers both throughput prediction and buffer occupancy, and tries to select the next video bitrate which maximizes an objective function modeling the QoE. Although [Yin, et al. 2015] propose using rule-based decision table to address the issue of the high computational complexity required for solving such an optimization method, preparing such a table for different adaptation sets can be impractical. In addition, it does not make a decision about imposing delay which is inevitable under some circumstances. Authors in [Zhou, et al. 2016] propose a Markov decision-based approach to capture the dynamics of a video streaming system. Even though the reward function in [Zhou, et al. 2016] is properly defined to consider the most important factors influencing the QoE, and a greedy algorithm was proposed to reduce the computational complexity of finding the optimal solution, it needs the channel state transition probabilities which are difficult to acquire in heterogeneous networks and even more difficult for non-stationary channels. Therefore, the performance of this method can be compromised with an inaccurate Morkov channel model. Also, this method does not provide any policy for situations where postponing the download of the following segment is inevitable. A Q-Learning based approach is also proposed by [Mart and Garc. 2016] whose reward function is defined to be an indication of the QoE, and directs the client to pick the most desirable policy in order to maximize the QoE. Although the influencing factors considered by the reward function are somewhat analogous to those taken into account by our proposed Fuzzy method, in FLC, those factors are firstly converted to the fuzzy domain, and accordingly fuzzy rules are defined, instead of a reward function to be used by the FLC to make decisions about the final actions and find the best policy. Parallel to the above works, other studies addressed the issue of unfairness and instability in HAS, which is common among players competing for higher bandwidth over a bottleneck link. The study [Akhshabi, et al. 2012a] properly points out the root cause of unfairness and instability, which is the well-known ON-OFF pattern of downloading segments. A video bitrate adaptation method should act such that players converge to an equilibrium point. To this end, the work in [Houdaille and Gouache. 2012] proposes a bandwidth manager based on a traffic shaping mechanism to allocate fair bandwidth to players using home gateways. Although the experimental results show it could improve fairness among players, the home gateway solution is not enough, as the bottleneck conditions can occur on a link outside of the home gateway. The work in [Li, et al. 2014b] tries to justify the instability of players competing for a shared bandwidth in an undersubscribed bottle link. The authors claim that when the link is underutilized, the bandwidth estimation is not as accurate as when the link is over utilized. They also compare this effect with the well-known bandwidth cliff effect (congestion collapse), which, in our opinion, is unrelated to the fluctuation in video bitrates selected by competing players. As explained in [Nagle. 1984], in case of congestion collapse, ACM Transactions on xxxxxxxx, Vol. xx, No. x, Article x, Publication date: Month YYYY
https://mc.manuscriptcentral.com/tomm
Page 4 of 27
Page 5 of 27
Transactions on Multimedia Computing Communications and Applications 5
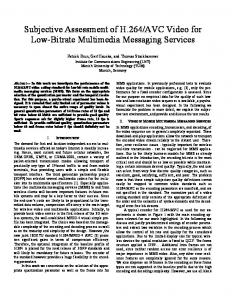
the real throughput (Goodput) experienced by each player is much less than its fairly designated throughput. But experimental results in [Li, et al. 2014b] show that, after the bandwidth cliff event, the players reach their fair shares. So it cannot be a congestion collapse. We have a different explanation: when a sudden load is imposed on a switching node, due to the limited space in the buffer, packets are lost such that the player cannot keep up with updating its measurement; subsequently, the retransmission timer would not be updated accordingly. Consequently, the host commences sending more copies of the late packets and the buffers in the switching node are overrun, and, as a result, the new arriving packets are dropped. In this context, the player will experience throughput much less than the expected one. In [Jiang, et al. 2014], the pros and cons of different segment scheduling methods including immediate download and periodic download are presented, and randomized chunk scheduling is proposed to improve stability and fairness among competing players. First, before scheduling the next download, the player generates a random buffer threshold within the predefined range centered at the intended buffer level. Then, if the current level of playback buffer is less than the generated threshold, the next download will take place immediately; otherwise, the download of the next segment is scheduled for later, to the extent of the difference between the current level buffer and that random threshold. This type of scheduling strives to eliminate synchronization among downloads of different players. It should be noted that this synchronization event has been reported by [Li, et al. 2014b] as well. In addition to the aforementioned works, the study [Petrangeli, et al. 2015] strives to address the fairness issue among competing players by proposing in-network proxies cooperating to facilitate fair resource sharing. On the contrary, our proposed method does not take advantage of any intermediate network elements in order to solve fairness issue. We focus only on the player itself, which can be more practical in the real word, as it is more difficult to gain access to and manage the network resources of a service provider, including its intermediate nodes. Different from the aforementioned works trying to address unfairness in HAS, as pointed out in the introduction section, our FLC mechanism improves the fairness among competing players by reducing the ON-OFF traffic. To achieve fairness through the normal TCP congestion control mechanism, our method aims at reducing the OFF periods. However, reducing OFF periods is not trivial, since OFF periods usually happen when the playback buffer is almost full, and the HAS player in order to prevent buffer overflow starts postponing the download of the following segments. Therefore, to reduce the OFF periods, first we need to predict this situation more timely and more accurately. To do so, we use the buffer level predictor as well as the bandwidth predictor to detect the situation in time, enabling the FLC to take the appropriate action. By reducing the OFF periods, the underlying TCP controllers remain active longer during the sessions, and consequently, the available bandwidth is expected to be shared more fairly among the players. To give insight into the rationale behind our method, Fig.1 illustrates various possible approaches which can be taken by a client where the playback buffer is almost full and there is a mismatch between available bandwidth and the highest available video bitrate (denoted by level i in Fig.1) lower than available bandwidth. As shown in Fig.1, due to this mismatch, the download of a segment belonging to level i is finished earlier than the time at which the player needs to pick another segment from the buffer (video time line boundary t2). This gap is indicated by Δ in fig. 1. Now, if the download of the following segment is performed immediately, as illustrated in fig. 1 top, playback buffer overflow condition is possible. In another approach, which is common among the HAS players, the download of the following segment is postponed to the next video time line boundary. By doing so, the buffer level is maintained, but as can be seen in fig. 1 middle, an OFF period is created.
ACM Transactions on xxxxxxxx, Vol. xx, No. xx, Article xx, Publication date: Month YYYY
https://mc.manuscriptcentral.com/tomm
Transactions on Multimedia Computing Communications and Applications
Δ
Δ
Buffer Statuses at t2
Buffer Statuses at t1
Without Imposing Delay
With Imposing Delay
Proposed Method
Δ-ε T
T t2
t1 Video Time Line Boundary
Maximum buffer capacity Buffer Occupancy OFF Period
Previous Buffer Level Segment of level i Segment of level i+1
Fig. 1.Different possible approaches to download the following segment
However, as shown in fig.1 bottom, creation of a continuous stream is possible when there is a representation with a bitrate higher than the available bandwidth (denoted by level i+1). Immediate download of the following segment with the video bitrate greater than the available bandwidth allows for a larger segment to be downloaded for a longer time than the segment play time, T, (the difference between download time and segment play time is denoted by ε in fig. 1). As a result, in addition to eliminating the OFF period, the buffer size is kept away from the full limit (red dashed line) compared to the first approach which increases the risk of buffer overflow. It should be noted that our proposed method requires quality changes, which in theory may have a negative impact on QoE. However, according to the recommended representation sets given by Apple, Microsoft and Netflix [Toni, et al. 2014], video bitrates are usually selected in a way to reflect Weber’s Law of Just Noticeable Difference (JND). If we assume that two adjacent video representations are spaced in such a way that the difference between them in terms of JND is less than 3 (which is common in practice [Thang, et al. 2014]]), the impact of quality change is not obviously noticeable to the viewer, as investigated and confirmed in [Jansen, et al. 2002]. Obviously, this cannot be applied where there is no available representation with a bitrate higher than the available bandwidth, so our method does not always eliminate the OFF period. With regard to prediction mechanisms, the proposed method in [Zhou, et al. 2013] utilizes Autoregressive–Moving-Average (ARMA) and Generalized Autoregressive Conditional Heteroscedastic (GARCH) in order to predict the average and the variance of bandwidth, respectively. Then the predicted average and the predicted variance are used in a controltheoretic approach to control the buffer size and the rate adaptation. The main drawback of [Zhou, et al. 2013] is that the prediction is performed on bandwidth, but during OFF period there is no bandwidth history. As a result, ARMA and GARCH might produce erroneous predictions. The works in [Yao, et al. 2012, Curcio, et al. 2010, Riiser, et al. 2012, Hao, et al. 2014] take advantage of rate prediction in order to proactively switch to the predicted transmission rates as well as to prevent streaming disruptions. In such approaches, the player exploits the predicted available bandwidth provided by the bandwidth maps. However, access to bandwidth maps restricts the use of these methods. Furthermore, in case of failed predictions; i.e., when the provided map is not matched with the real experienced bandwidth, if an alternative mechanism is not provided, like what is proposed by [Riiser, et al. 2012], not only will the provided bandwidth prediction be ineffective, but also it will degrade QoE.
ACM Transactions on xxxxxxxx, Vol. xx, No. x, Article x, Publication date: Month YYYY
https://mc.manuscriptcentral.com/tomm
Page 6 of 27
Page 7 of 27
Transactions on Multimedia Computing Communications and Applications 7
3. PROPOSED SYSTEM ARCHITECTURE
The central part of our system is the fuzzy controller that takes the adaptive smoothed observed throughput and the predicted buffer dynamics as inputs. Preliminary descriptions of the fuzzy logic controller appeared in [Sobhani, et al. 2015]. Here we introduce a system that takes two inputs for decision making: the available bandwidth estimated by means of KAMA, and the buffer dynamics predicted by a Grey predictor. In Fig.2, the high level architecture of our system is presented. We first start by introducing the details of KAMA and the Grey prediction model and then explain the FLC mechanism. Estimated Throughput MPD File Video Sequence Encoded in different bitrates
AMA
FLC
R1 R2
Grey Predictor
Relative Error Media Engine
Buffer Level
< Error Level
Segment Downloader
MUX
Delay
Yes/No
HTTP/1.1 RN
Received Segment
Video Segments
CDNs Playback Buffer
Media Presentation & Description Files
HTTP Adaptive Player
. Fig. 2. Block diagram of video-streaming architecture
3.1 Kaufman’s Adaptive Moving Average (KAMA)
There are several methods for estimating end-to-end available bandwidth in best effort networks e.g. [Brown. 1957, Chatfield. 1978, Smola and Schölkopf. 2004]. The details of these methods are beyond the scope of this paper and can be seen in [Bouten, et al. 2015]. In this paper, we are interested in methods that work passively and do not impose any further communication burden on the network. One such method is the Exponential Weighted Moving Average (EWMA) [Brown. 1957] shown in equation (1). EWMA is usually used to smoothen the previously experienced segment throughputs so that the short-term fluctuations are canceled out, and the smoothed version of the segment throughput can be thought of as an estimation of the available bandwidth. 𝑆𝑇(𝑖) = (1 − 𝛼) × 𝑆𝑇(𝑖 − 1) + 𝛼 × 𝑇(𝑖),
(1)
where 𝑇(𝑖) the computed throughput of the ith segment, 𝑆𝑇(𝑖) is the corresponding smoothed 2 throughput, and 𝛼 = where (𝑙) is the number of samples such that the smaller value of α 𝑙+1
corresponds to a longer history and vice versa. However, the selection value of the smoothing factor (𝛼 ) in EMWA is challenging. Using more samples, i.e. smaller 𝛼 , in exponential averaging can cancel unnecessary short-term throughput variations, and as a result, minimizing unnecessary fluctuations in video quality. However, the player cannot use the maximum available bandwidth, and it reacts sluggishly to non-short-term bandwidth variations and needs a larger buffer size to cope with large throughput decreases. In contrast, if fewer samples, i.e. larger α, are used in exponential averaging, the player reacts faster to varying bandwidth, making it responsive and maximizing the bandwidth utilization. But, some fluctuations would not be filtered out, which adversely impacts the QoE. In general, it would be more appropriate if the value of α is dynamically selected based on the current network condition. To this end, we take advantage of the Kaufman's Adaptive Moving Average (KAMA) concept proposed in [Kaufman. 1995], mostly used in financial markets to extract more understandable trends. As shown in equation (2), KAMA is quite similar to EMWA with the difference that, in KAMA, the smoothing factor (∁(i)) is dynamically calculated for every sample while in EMWA, α is fixed. The detailed ACM Transactions on xxxxxxxx, Vol. xx, No. xx, Article xx, Publication date: Month YYYY
https://mc.manuscriptcentral.com/tomm
Transactions on Multimedia Computing Communications and Applications
Page 8 of 27
calculation of ∁(i) as well as an example showing the performance of KAMA are provided in Online Appendix, section A. 𝑆𝑇(𝑖) = (1 − ∁(𝑖)) × 𝑆𝑇(𝑖 − 1) + ∁(𝑖) × 𝑇(𝑖)
(2)
3.2 Grey prediction model
As mentioned earlier, buffer-based methods use the current occupied level of the buffer in order to make decisions about changing the video bitrate. In this regard, they react sluggishly to the steady variation of incoming bandwidth, and hence cannot efficiently use the available network bandwidth. Our proposed Grey predictor extracts the steady trend of the buffer level variation and predicts the buffer occupancy level ahead of time. The trend of changes in the buffer level indirectly shows the trend of variations in incoming network bandwidth. This is important as we feed such predictions to the FLC which tries to uninterruptedly download video segments. By so doing, the FLC can proactively respond to the current context using the predicted buffer level and take an appropriate action sooner, especially when the chance of buffer underrun/overrun is high. Online Appendix, section B explains the steps of constructing the Grey model at each round, and how the model is evaluated in terms of the mean relative error (MRE). Also, an example is shown in Online Appendix, section B to demonstrate how the Grey model predicts the level of the buffer. 3.3 FLC design
Our proposed FLC considers both the estimated throughput and the buffer status for selecting the most appropriate video bitrate and the decision on continuous download of segments. Fig.3 shows the components of our FLC design including: Fuzzifier, fuzzy inference engine and defuzzzifier. Fuzzy-based controller is useful for running a complex process, like HAS, which can be comprehended better using imprecise qualitative knowledge of experts rather than using precise quantitative models. When Fuzzy logic is used for controlling a process, it can be seen as if a person with expert knowledge controls that process. In contrast to the definition of membership in the Boolean subset, in which an element definitely either belongs or does not to a subset, in Fuzzy logic an element can be a member of a subset to some degree and the extent of being a member of the subset can be determined by a function, called membership function. In this sense, the fuzzifier is required to map the crisp input variables to the linguistic variables using membership functions. These functions are defined based on experts’ knowledge for all fuzzy subsets within the numerical range of input variables. Therefore, each input variable, depending on its crisp value, has various degrees of membership to different fuzzy subsets [Zadeh.1975]. In our model for the Fuzzy-based controller model for HAS, this process is expressed as follows: FLC takes the normalized difference between the estimated throughput and the current selected video bitrate (Di) and either the normalized playback buffer occupancy 𝑜𝑐𝑐𝑢𝑝𝑖𝑒𝑑 𝑙𝑒𝑣𝑒𝑙 𝑜𝑓 𝑏𝑢𝑓𝑓𝑒𝑟 level ( 𝐵𝑖 = ) or the normalized predicted buffer level ̂𝑖 = (𝐵
𝑠𝑖𝑧𝑒 𝑜𝑓 𝑏𝑢𝑓𝑓𝑒𝑟 𝑃𝑟𝑒𝑑𝑖𝑐𝑡𝑒𝑑 𝑜𝑐𝑐𝑢𝑝𝑖𝑒𝑑 𝑙𝑒𝑣𝑒𝑙 𝑜𝑓 𝑏𝑢𝑓𝑓𝑒𝑟 𝑠𝑖𝑧𝑒 𝑜𝑓 𝑏𝑢𝑓𝑓𝑒𝑟
) based on the value of the relative error level as inputs.
Crisp values of these two inputs are mapped to the corresponding linguistic variables using the membership functions as illustrated in Fig.4 (a) and (b). Let L(x) be a set of linguistic values being mapped to all possible values associated with the measurement of the crisp variable x. Then we define 𝐿(𝐷𝑖 ) and 𝐿(𝐵𝑖 ) as in (3) and (4).
ACM Transactions on xxxxxxxx, Vol. xx, No. x, Article x, Publication date: Month YYYY
https://mc.manuscriptcentral.com/tomm
Page 9 of 27
Transactions on Multimedia Computing Communications and Applications 9
Fuzzifier
Inference Engine
Input Membership Functions
Di
λ x Buffer Level
Defuzzifier
Pi
>0
Input Membership Functions
Estimated Throughput
Quantization (fs)
-1 D-1
Vi
Fuzzifier
Imposed Delay
SPi-1
Select Logic
Defuzzifier
MUX
Bi
MUX
0
Rule Base
SPi
+1
Fig. 3 Block diagram of the FLC
𝐿(𝐷𝑖 ) = {
𝐿𝑎𝑟𝑔𝑒 𝑁𝑒𝑔𝑎𝑡𝑖𝑣𝑒 (𝐿𝑁), 𝑆𝑚𝑎𝑙𝑙 𝑁𝑒𝑔𝑎𝑡𝑖𝑣𝑒 (𝑆𝑁), } 𝑍𝐸𝑟𝑜 (𝑍𝐸), 𝑆𝑚𝑎𝑙𝑙 𝑃𝑜𝑠𝑖𝑡𝑖𝑣𝑒 (𝑆𝑃) , 𝐿𝑎𝑟𝑔𝑒 𝑃𝑜𝑠𝑖𝑡𝑖𝑣𝑒 (𝐿𝑃)
(3)
𝐿(𝐵𝑖 ) = {𝑆𝑚𝑎𝑙𝑙 (𝑆), 𝑀𝑒𝑑𝑖𝑢𝑚 (𝑀), 𝐿𝑎𝑟𝑔𝑒(𝐿)} LN
SN
ZE 1
SP
LP
1-(a/2)
Low
a 0
0.5
1
Full
Bi 2T
Segment Duration = T
No-Delay
4T
5T
6T
Delay
1
Increase
No-Change
Decrease
Larg-Decrease
-a/2 0 a/2
3T
(b) μF (Bi ),
1
-2.5a
High
Di
(a) μF (D𝑖 )
-4.5a
Medium
0.5
a -1
1
(4)
Vi 3.5a
Pi -2.5a
(c) μF (Vi )
0
2.5a
(d) μF (Pi )
Fig. 4. Input & output membership functions
Having mapped the crisp values to the linguistic values, the FLC then takes advantage of fuzzy “if/then” rules defined in Table I as a descriptive relationship in order to determine the values of the fuzzy outputs, the video bitrate (𝑉𝑖 ) and the indication flag (𝑃𝑖 ). It is worth noting that in this design we use the Mamdani model [Mamdani. 1974] to define fuzzy outputs. As defined in equation (5), 𝑉𝑖 takes four values: Increase (Inc), No Change (NoCh), Decrease (Dec), and Large-Decrease (LaDec). Increase and Decrease mean that the FLC increases and decreases the current video bitrate just by one step. Table I. Adaptation algorithm. Symbols for Di and Bi are defined in (3) and (4).
Di
Large Neg. Small Neg. Zero Small Pos. Large Pos.
Bi
Small
Medium
Large
LaDec/NoDel Dec/NoDel Dec/NoDel NoCh/NoDel Inc/NoDel
Dec/NoDel Dec/NoDel NoCh/NoDel Inc/NoDel Inc/NoDel
Dec/NoDel NoCh/NoDel Inc/NoDel Inc/Del Inc/Del
Large-decrease means decreasing the video bitrate by more than one step and No-Change means the FLC keeps the current video bitrate. In case of decreasing the video bitrate, the FLC can either be aggressive or conservative, in the former case allowing the controller to decrease the video bitrate by more than one step to cope with a sudden drop in incoming bandwidth. Otherwise, in order to smoothly adapt the video bitrate to the decreasing bandwidth, the controller conservatively decreases the selected bitrate step by step. In the case of increasing the video bitrate, the FLC acts as a conservative player in order to ACM Transactions on xxxxxxxx, Vol. xx, No. xx, Article xx, Publication date: Month YYYY
https://mc.manuscriptcentral.com/tomm
Transactions on Multimedia Computing Communications and Applications
Page 10 of 27
smoothly improve the quality of video instead of abrupt improvements which degrade the QoE. 𝐼𝑛𝑐𝑟𝑒𝑎𝑠𝑒 (𝐼𝑛𝑐), 𝑁𝑜 − 𝑐ℎ𝑎𝑛𝑔𝑒 (𝑁𝑜𝐶ℎ), 𝐷𝑒𝑐𝑟𝑒𝑎𝑠𝑒 (𝐷𝑒𝑐), 𝐿(𝑉𝑖 ) = { } 𝐿𝑎𝑟𝑔 − 𝐷𝑒𝑐𝑟𝑒𝑎𝑠𝑒 (𝐿𝑎𝐷𝑒𝑐)
(5)
Equation (6) defines two possible values which can be assigned to 𝑃𝑖 , 𝐷𝑒𝑙𝑎𝑦 and 𝑁𝑜 − 𝐷𝑒𝑙𝑎𝑦. It is important to note that 𝑃𝑖 only determines the need of download postponement, and does not specify the time of the download. If the linguistic value of 𝑃𝑖 is 𝑁𝑜 − 𝐷𝑒𝑙𝑎𝑦, the next download occurs immediately. Because the fuzzy outputs are discrete, the types of corresponding membership functions are triangular without any overlap, as shown in Fig. 4(c) and (d). 𝐿(𝑃𝑖 ) = {𝐷𝑒𝑙𝑎𝑦 (𝐷𝑒𝑙), 𝑁𝑜 − 𝐷𝑒𝑙𝑎𝑦(𝑁𝑜𝐷𝑒𝑙)}
(6)
Subsequently, the linguistic values of outputs are transformed to crisp values according to their degree of fulfillment (DOF). Mean of maxima (MOM) is selected as a method of defuzzification due to the discrete nature of the outputs [Liu. 2007]. Assuming that a linguistic variable output has N singleton type fuzzy subsets, denoted by 𝑘𝑖 ( 1 < i < N), the MOM defuzzification finds the maximum DOF and returns the corresponding 𝑘𝑖 . If there are more singletons with the same maximal DOF, then the output is calculated as the average of these singletons. Finally, the control parameters are generated based on the extracted crisp value outputs by means of equations (7) and (8): 𝑓𝑠 (𝐸𝑇) 𝑆𝑃𝑖−1 − 1 𝑆𝑃𝑖 = { 𝑆𝑃𝑖−1 𝑆𝑃𝑖−1 + 1
𝑖𝑓 𝑉𝑖 < −3.5 ∗ 𝑎 𝑖𝑓 − 3.5 ∗ 𝑎 < 𝑉𝑖 < −1.5 ∗ 𝑎 ⋏ 𝑆𝑃𝑖−1 > 𝑆𝑃𝑚𝑖𝑛 𝑖𝑓 − 1.5 ∗ 𝑎 < 𝑉𝑖 < 1.5 ∗ 𝑎 𝑖𝑓 𝑉𝑖 > 1.5 ∗ 𝑎 ⋏ 𝑆𝑃𝑖−1 < 𝑆𝑃𝑚𝑎𝑥
𝐷𝑙𝑖 = {
0 𝜆 × 𝑏𝑢𝑓𝑓𝑒𝑟 𝑙𝑒𝑣𝑒𝑙
𝑖𝑓 𝑃𝑖 < 0 𝑖𝑓 𝑃𝑖 > 0
(7)
(8)
where 𝑺𝑷𝒊 and 𝑫𝒍𝒊 are respectively the selected video bitrate and the amount of delay that the scheduler has to wait before issuing the next segment request; 𝒇𝒔 is a function, which gets the estimated throughput as an input and gives the highest available video bitrate less 𝟏 𝟏 than the given throughput; and 𝝀 is a fraction in the range ≤𝝀≤ determining the 𝟔
𝟓
amount of delay used by the downloader to postpone the next download. See [Sobhani, et al. 2015] for a detailed discussion on how the range of values for 𝝀 is selected. 4. EXPERIMENTAL RESULTS
We used the network topology illustrated in Fig.5 to emulate and evaluate the proposed adaptation method against existing methods. The adaptation methods were implemented in C++ on top of the Libdash sample player. At the server side, the DummyNet tool [Rizzo. 1997] was used to limit the bandwidth of the bottleneck link. Also, the RedBull video sequence [RedBullPlayStreets. 2014] was used with 16 available representations, as specified in Table II, hosted by a Microsoft IIS server.
ACM Transactions on xxxxxxxx, Vol. xx, No. x, Article x, Publication date: Month YYYY
https://mc.manuscriptcentral.com/tomm
Page 11 of 27
Transactions on Multimedia Computing Communications and Applications 11
DummyNet 20 ms
DASH Client
Internet
HTTP Server
Aggregation Router
DASH Client
Fig. 5. Applied network topology for the test-bed
Table II. Video sequence characteristics
[100,1],[150,2],[200,3],[250,4],[300,5], [400,6],[500,7],[700,8],[900,9],[1200,10], [1500,11],[2000,12],[2500,13],[3000,14], [4000,15],[5000,16],[6000,17]
Segment duration
Frame rate (fps) 24
GoP size
Sequence RedBull
[Video Bitrate (kbps),corresponding index]
15
6s
We compare our results with the methods proposed in [Thang, et al. 2012] and [Akhshabi, et al. 2012b] as they can fairly represent the behavior of throughput-based methods and buffer-based methods, respectively. Below, we refer to these methods as TB and BB, respectively. Furthermore, we compare our method against [Jiang, et al. 2014], referred to as FESTIVE below, because it directly aims at addressing the problem of unfairness among competing players. Another notable method proposed by [Juluri, et al. 2015a] is also considered in our comparison as it makes decision regarding the video bitrate as well as the amount of delay to be imposed for downloading the following segment. Herein, we refer to [Juluri, et al. 2015a] as SARA. In TB, the most suitable video bitrate is chosen among the available representations based on smoothed segment throughput (defined in equation (1)) in which α is 0.3. Also, the level of pre-buffering has been considered to be 30 seconds. In the BB method, the adaptation mechanism is performed based on the current level of the playback buffer. For doing so, different buffer thresholds (B1 < B2 < Bmax) are determined to extract the buffer status and to select the most appropriate action in order to prevent buffer under run. In the experiment, we use values for B1, B2, and Bmax to be 20 seconds, 40 seconds, and 60 seconds respectively. FESTIVE uses harmonic mean to estimate the bandwidth, which is more robust for larger outliers. In addition, FESTIVE introduces the randomized scheduler so that if the playback buffer is more than a pre-defined target buffer, it postpones the download of the next segment using a random delay drawn from a randomized target buffer size. The target buffer size for FESTIVE in our setup is considered to be 20 seconds. Accordingly, the random target buffer size is drawn from a random variable ranging in (14, 26) with uniform distribution. Similar to FESTIVE, harmonic mean is also used by SARA. However, in order to have more accurate prediction, SARA proposes weighting previously measured throughput proportionally to the corresponding segment sizes. Therefore, the segment size information should be provided to SARA along with the corresponding MPD file. Also, in our experiments, according to the segment duration, i.e 6 seconds, we set the parameters Bα , Bβ and Bmax to 10, 25 and 30 seconds respectively. To evaluate the performance of the above mentioned adaptation mechanisms, we follow [Li, et al. 2014b, Jiang, et al. 2014], which defines four types of metrics: I) the rate and the period of buffer underflows leading to video freezes, II) average of selected segments qualities, III) rate of switching among different representations and IV) fairness among
ACM Transactions on xxxxxxxx, Vol. xx, No. xx, Article xx, Publication date: Month YYYY
https://mc.manuscriptcentral.com/tomm
Transactions on Multimedia Computing Communications and Applications
competing players. Finally, we use Jain’s fairness index [Jain, et al. 1984] to assess the fairness among the competing players as the number of players is increased. 4.1 Evaluation
The defined experiment sets in this section are intended to demonstrate the dynamic behavior of the considered algorithms, and to show how our method reduces OFF periods compared to the other methods. Our experiments are divided into two sets: (1) single HAS player and (2) multiple HAS players. All of the experiments were separately conducted for TB, BB, SARA and FESTIVE. In the scenario defined for the first set of experiments shown in 4.1.1, a single HAS player downloads and plays back 60 segments; i.e., 360 seconds. Also, in order to take into account the impact of cross traffic on varying the available bandwidth, in our tests, we utilized [Iperf.2005] as a tool to create an aggressive TCP stream. For this purpose, the client side where the HAS player resides, executes the Iperf server when the download of the 15th segment is finished, to receive the TCP flow sent from the server side where the HTTP server is located. This cross traffic is kept up for 180 seconds. In this scenario, the available bandwidth of the bottleneck link is fixed at 8 Mbps. In the second scenario defined for the second experiment set shown in 4.1.2, 3 players compete on the bottleneck link with the fixed bandwidth during each simulation. The players start streaming randomly within the interval of the segment duration of 6 seconds. We made this assumption in order to reduce the chance of biasing. The experiment sets using the second scenario were repeated for different amounts of the fixed bandwidth ranging from 3 Mbps to 36 Mbps. Adjusting the bottleneck link’s bandwidth allows us to evaluate the various degree of OFF periods imposed by our method as well as other considered adaptation methods. It should be mentioned that the same pattern of cross traffic as described for the first scenario is used in this second scenario too. 4.1.1
Experiment Set 1
Fig. 6 shows the HAS player dynamics of all studied adaptation algorithms including Fuzzy, TB, BB, SARA and FESTIVE for the experiment set (1). As can be seen from Fig. 6 (a), (c), (e),(g) and (i), during the absence of cross traffic, all considered adaptation methods increased the video bitrate up to the maximum video bitrate available in the representation set; i.e., 6Mbps. As Fig. 6 (d) and (f) show, the playback buffer level of TB and BB remained the same when the cross traffic did not exist. However, when the aggressive TCP stream acting as cross traffic started, the cross traffic and the HAS player started competing on the bottleneck link, resulting less bandwidth available for the HAS player. This reduction in the available bandwidth caused a sudden drop in the buffer level for all HAS players using different adaptation methods as shown in Fig. 6 (b), (d), (f), (h) and (j). The largest decrease in buffer was observed for BB (Fig. 6 (d)) as this method is sluggish to react to changes in the available bandwidth, and the smallest one happened for TB, as it follows the bandwidth changes very fast. In regard to the creation of OFF periods, it is obvious in Fig. 6 (b) that, during the competition period (referred to the period when the cross traffic exists), our method did not impose any delay while using the other methods resulted in creating OFF periods during the competition. As illustrated in Fig. 6 (a), from segment 29 to segment 34, although the experienced segment throughput had a value in the range of (2.5 Mbps-3 Mbps) and it is expected that video index 13 be selected, our method selected the one-step higher video bitrate of video index 14, at 3 Mbps, when the corresponding buffer level was in the high region (24s – 30s), shown in Fig. 6 (b), and was going up to enter to the full region (30s – 36s). By doing so, our method kept the buffer away from being overflowed and consequently there was no need to impose any delay to decrease the buffer level. For the buffer dynamics of TB, SARA and FESTIVE, the methods using standard bandwidth estimation, shown in ACM Transactions on xxxxxxxx, Vol. xx, No. x, Article x, Publication date: Month YYYY
https://mc.manuscriptcentral.com/tomm
Page 12 of 27
Page 13 of 27
Transactions on Multimedia Computing Communications and Applications 13
Fig. 6 (d), (h) and (j), it can be seen that when the buffer was close to be full, in order to avoid the buffer overflow, these methods imposes delays to drain the buffer. It is intuitive that if these methods did not impose any delay on segment downloading; i.e., if they aggressively downloaded, buffer overflow would have happened. It is also important to notice in Fig. 6 that the fluctuations in the cross traffic are highly correlated with the occurred OFF periods. On the contrary, as shown in Fig. 6 (b), during the downloads of the first 15 segments and last 15 segments when there was no cross traffic, since the available bandwidth (8 Mbps) is more than the highest available video bitrate of 6 Mbps, our proposed method had no means to decrease the buffer level when approaching to the full region (30s – 36s), and so it went into OFF mode. It is also worth mentioning that even though FESTIVE uses randomized delays, as shown in Fig. 6 (i), it produced considerable fluctuations in the experienced segment throughput and subsequently instability in the adapted video bitrate. In fact, FESTIVE just aims at eliminating biasing among HAS players competing on the bottleneck link, and not reducing the OFF periods. Hence, in the scenarios in which there is a cross-traffic TCP stream competing with the HAS stream, it is not very efficient, and causes instability.
(a)
(b)
(c)
(d)
ACM Transactions on xxxxxxxx, Vol. xx, No. xx, Article xx, Publication date: Month YYYY
https://mc.manuscriptcentral.com/tomm
Transactions on Multimedia Computing Communications and Applications
(e)
(f)
(g)
(h)
(i)
(j)
Fig. 6. HAS player dynamics of adaptation algorithms including experienced segment throughput, selected bitrate, and cross traffic of Fuzzy, TB, BB, SARA and FESTIVE shown in (a), (c), (e),(g) and (i) respectively, and OFF period and buffer status of Fuzzy, TB, BB, SARA and FESTIVE shown in (b), (d), (f),(h) and (j) respectively.
4.1.2
Experiment Set 2
The main purpose of the second set of experiments is to measure the degree of OFF period by adjusting the bottleneck link’s bandwidth when there are 3 players plus cross traffic competing on the bottleneck link. To conserve space and to better illustrate how the ACM Transactions on xxxxxxxx, Vol. xx, No. x, Article x, Publication date: Month YYYY
https://mc.manuscriptcentral.com/tomm
Page 14 of 27
Page 15 of 27
Transactions on Multimedia Computing Communications and Applications 15
players compete for available bandwidth, the system dynamics of the 3 homogeneous players are shown in Fig. 7 to 9 for the Fuzzy, BB and FESTIVE adaptation methods respectively. The bandwidth of the bottleneck link was set to 24 Mbps. When the aggressive cross traffic started, it took almost half of the available bandwidth at 12 Mbps. This phenomenon can be justified by the fact the Iperf uses persistent connections while the HAS players use non-persistent connections. Hence, in the absence of cross traffic, the fair share of available bandwidth for each HAS player was 8 Mbps, and in the presence of cross traffic it dropped to 4 Mbps. Accordingly, it can be seen from Fig. 7 to 9, that all HAS players were able to reach the maximum video bitrate available in the video representation set; i.e., 6 Mbps. As illustrated in Fig. 7, the HAS players running our proposed method fairly share the bottleneck bandwidth when operating along with the cross traffic, and the curves of segment throughput experienced by the 3 players are relatively smoother. On the contrary, due to the OFF-period occurrence in FESTIVE, we see the unfairness in the segment throughputs; see Fig. 9. Moreover, in Fig.8, it can be easily observed that even though the HAS players using the BB method have not experienced any OFF period when sharing the bottleneck link with cross traffic, the segment throughput curves show severe fluctuations and unfairness among the HAS players. In the BB method, the players reacted slowly against available bandwidth variations as they were waiting for the buffer level to go below the predefined threshold. For instance, the cross traffic started at the 15th segment while all of HAS players started responding to this variation after the 20th segment. In order to restore the buffer level to the reliable threshold and to prevent from probable video freezes, they had to select bitrates lower than the fair share of bandwidth and consequently caused instability problems. This is a known problem of BB schemes and is also reported in [Park, et al. 2015]. Table III summarizes the overall performance of the considered adaptation methods in terms of the average video bitrate as well as the number of switches in the video level experienced by the 3 HAS players. In contrast to other adaptation methods, the players using our proposed method faced lower number of switches among different representations. Also, It can be seen that the Fuzzy and the TB methods led to higher average video bitrates compared to BB, SARA and FESTIVE. Table III. Performance comparison of the rate adaptation methods
Fuzzy TB BB SARA FESTIVE
(a)
Player 1
The average video bitrate (Mbps) 4.607 4.762 4.509 4.468 4.533
(b)
The number of video quality switches 9.66 15.66 22 16 18.6
Player 2
(c)
Player 3
Fig. 7. System dynamics of HAS players using Fuzzy method ACM Transactions on xxxxxxxx, Vol. xx, No. xx, Article xx, Publication date: Month YYYY
https://mc.manuscriptcentral.com/tomm
Transactions on Multimedia Computing Communications and Applications
(a)
Player 1
(b)
Player 2
(c)
Player 3
(c)
Player 3
Fig. 8. System dynamics of HAS players using BB method
(a)
Player 1
(b)
Player 2
Fig. 9. System dynamics of HAS players using FESTIVE method
4.1.3
QoE analysis
In this section we present the evaluation of different adaptation methods compared to our proposed method in terms of QoE. According to [De Vriendt, et al. 2013, Liu, et al. 2013, Claeys, et al. 2014, Mok, et al. 2011] which propose QoE models for HAS, average quality of selected representations, number and magnitude of switches among different representations and frequency and duration of freezes are considered as the most important factors having impact on QoE. Hence, the linear model provided in equation (9) [Claeys, et al. 2014] is used to estimate the Mean Opinion Score (MOS) of the adapted video playback. 𝑒𝑀𝑂𝑆 = 5.67 × 𝜇 − 6.72 × 𝜎 − 4.95 × ∅ + 0.17 (9) Where 𝜇 and 𝜎 denote the average and standard deviation of quality of segments constituting the adapted video stream respectively, and ∅ indicates the impact of choppy playback considering the number and duration of video playback freezes. However, as explained in [De Vriendt, et al. 2013], in order to capture the quality of each chunk belonging to different representations, different metrics including PSNR, SSIM, chunkMOS and the index of quality levels can be used. As chunk-MOS is usually not available, and PSNR and SSIM are very sensitive to video content, it is concluded in [De Vriendt, et al. 2013], that using quality level indices yields the most reliable results in terms of predicting the real MOS. To this end, in our evaluation, the quality level indices were used such that the obtained results are within range [0.0 5.3697] which is very close to the typical range of MOS, [0 5]. Table IV presents the computed eMOS using the results obtained from experiment set 2. The results of eMOS show that the Fuzzy outperforms TB, BB and FESTIVE methods in terms of average eMOS. Although the average eMOS of ACM Transactions on xxxxxxxx, Vol. xx, No. x, Article x, Publication date: Month YYYY
https://mc.manuscriptcentral.com/tomm
Page 16 of 27
Page 17 of 27
Transactions on Multimedia Computing Communications and Applications 17
SARA is slightly greater than the Fuzzy, it can be seen that the players using the Fuzzy experienced quite similar qualities as opposed to the SARA players whose satisfaction levels are considerably different. Table IV. The computed eMOS for the rate adaptation methods Player 1 4.146 4.021 4.006 4.2654 4.192
Fuzzy TB BB SARA FESTIVE
4.1.4
Player 2 4.213 3.808 3.747 3.9648 4.093
Player 3 4.191 4.057 4.128 4.427 3.795
OFF period analysis
In order to evaluate the performance of our proposed method and the other studied adaptation methods in terms creating OFF periods, extensive experiments were conducted based on the experiment set 2 for different amounts of the bottleneck link’s bandwidth including 36 Mbps, 24 Mbps, 18 Mbps, 12 Mbps, 6 Mbps and 3 Mbps. The results of these experiments are presented in Table V in the form of average and the standard deviation of measured OFF periods imposed by all adaptation methods. According to the results provided for 36 Mbps, it is obvious that the average of OFF periods experienced by all HAS players using different adaptation methods are quite similar which indicates this fact that when the fair share of available network bandwidth is greater than the highest video bitrate available in the video representation set, adaptation methods have no means to prevent from buffer overflow other than delaying the download of subsequent video segments. However, regarding the standard deviations, it can be seen that the OFF periods created by Fuzzy method and FESTIVE method were drawn from wider range of values compared to other methods. This implies that Fuzzy and FESTIVE try to randomize chunk scheduling to improve stability and fairness among competing players. In the experiments where the available bottleneck link bandwidth was set to 24 Mbps, as shown in Fig 7 to 9, the available bandwidth for each HAS player is less than the maximum video bitrate in the presence of cross traffic, and Fuzzy can use the one-step increase in the video bitrate as a means to not impose any delay. As expected, the results provided in Table V shows that our proposed Fuzzy method reduced the average of OFF periods by almost 29%, 28%, 34% and 20% compared to TB, BB, FESTIVE and SARA respectively. When the available bandwidth was limited to 18 Mbps, we still see that Fuzzy method caused OFF period, as the fair share of bandwidth for each HAS player in the absence of cross traffic was equal to the maximum available video bitrate. On the other hand, for the scenarios in which the available bandwidth was set to 12 Mbps, 6 Mbps and 3 Mbps, our proposed method were able to completely eliminate the OFF periods. Table V. OFF period statistic results Available Bandwidth (Mbps) 36 24 18 12 6 3
Fuzzy Avg(s) Std(s)
TB Avg(s) Std(s)
BB Avg(s) Std(s)
FESTIVE Avg(s) Std(s)
SARA Avg(s) Std(s)
2.2381 0.775 0.202 0 0 0
2.517 1.093 1.255 0.825 1.007 1.30
2.531 1.079 0.548 0.958 1.043 1.36
2.421 1.177 1.015 0.964 1.088 1.381
2.35 0.975 0.719 0.855 0.917 1.232
3.32 2.157 1.099 0 0 0
0.767 0.582 0.416 0.307 0.318 0.412
0.765 0.598 0.552 0.33 0.316 0.393
2.682 2.013 2.004 1.74 1.742 2.73
0.977 0.687 0.682 0.465 0.463 0.555
ACM Transactions on xxxxxxxx, Vol. xx, No. xx, Article xx, Publication date: Month YYYY
https://mc.manuscriptcentral.com/tomm
Transactions on Multimedia Computing Communications and Applications
4.2
Empirical Analysis
In this section we define a competition scenario in which four homogeneous players using different studied adaptation methods compete for 300 seconds on the bottleneck link whose available bandwidth is fixed at 8 Mbps. In this scenario, we did not consider the cross traffic to statistically investigate the behavior of HAS players themselves in terms of sharing the available bandwidth. We have conducted 50 runs for each adaptation method and then the average of segment throughput experienced by each HAS player over each run was taken. The first 5 samples were not considered in the averaging process, to only take into account the samples measured when the system was stable. The average segment throughput obtained from each run can be thought of as a realization of a random process in which the bottleneck link is shared among the HAS players. Afterwards, the ensemble of these 50 sample realizations allows us to construct the empirical cumulative distribution function (ECDF) of the segment throughput experienced by each HAS as an estimation of the real CDF. Fig.10 (a), (b), (c), (d) and (e) present the distributions of the players’ segment throughputs in the form of CDFs. We also use the two-sample Kolmogorov-Smirnov (2S-KS) test [Young. 1977, Conover and Conover. 1980] to capture the analysis of the experienced throughput. This test measures the distance between two empirical cumulative distribution functions (ECDFs). Based on 2S-KS, we test the null hypothesis (H0 ) that the ECDFs of two players (denoted by 𝑃𝑖 and 𝑃𝑗 ) using the same adaptation method are drawn from the same CDF at the 5% significance level (𝐻0 ∶ 𝑃𝑖 = 𝑃𝑗 , 1 ≤ 𝑖 ≤ 4, 1 ≤ 𝑗 ≤ 4, 𝑖 ≠ 𝑗). The computed pairwise values of H0 and p-value for the four players, considering the different types of adaptation methods, are reported in Table VI. According to the value of significance level, i.e. 5%, if p-value >0.05 then 𝐻0 is accepted (𝐻0 = 1); otherwise, it is rejected (H0 = 0). As can be seen from the reported values of the proposed method in Table VI, the test of the null hypothesis for the four players are accepted which means that the ECDFs of the four players are similar. We can conclude that when the players use our proposed method, they fairly share the available bandwidth. The results for TB reveal that the ECDF of player 2 (P2) is similar to the ECDF of player 4 (P4) while the ECDFs belonging to player 1 (P1) and player (P3) are akin to each other. Fig.10 (b) shows that P4 on average uses more bandwidth than its fair share, whereas P1 uses less. The 2S-KS results for players using the BB method indicate that the ECDFs of P1 and P3 and the ECDFs of P2 and P4 are pairwise alike. Also, the 2S-KS results for BB players show that although the ECDFs of P1, P2 and P4 are comparable; P3 is different as indicated by the significance level (0.05). In conclusion, the players using our proposed method share the available bandwidth in a fair way, whereas in the other methods, some players suffer from being over or under the fair share.
(a)
Proposed method
(b)
TB method
ACM Transactions on xxxxxxxx, Vol. xx, No. x, Article x, Publication date: Month YYYY
https://mc.manuscriptcentral.com/tomm
Page 18 of 27
Page 19 of 27
Transactions on Multimedia Computing Communications and Applications 19
(c)
BB method
(d)
FESTIVE method
(e) SARA method Fig.10. Empirical CDFs of experienced throughput Table VI. Two-sample Kolmogorov-Smirnov results
Proposed method
TB
(H0,P-Value) a = 0.05
(H0,P-Value) a = 0.05
P1
P1 -
P2 (1,0.507)
P3 (1,0.317)
P4 (1,0.2408)
P1
P1 -
P2 (0, 0.017)
P3 (0,5.3e-13)
P4 (0,7.1e-05)
P2 P3 P4
(1,0.507) (1,0.317) (1,0.2408)
(1,0.423) (1,0.6779)
(1, 0.423) (1,0.0560)
(1,0.6779) (1,0.0560) -
P2 P3 P4
(0, 0.017) (0,5.3e-13) (0,7.1e-05)
(0,3.6e-06) (1, 0.24)
(0,3.6e-06) (0, 0.002)
(1, 0.24) (0, 0.002) -
BB
FESTIVE
(H0,P-Value) a = 0.05
P1 P2 P3 P4
P1 (0,1.23e06) (1, 0.507) (0, 0.002)
(H0,P-Value) a = 0.05
P2 (0,1.23e06) -
P3 (1, 0.507)
P4 (0, 0.002)
(0, 2.9e-09)
(1, 0.095)
(0, 2.9e-09) (1, 0.095)
(0,1.7e-04)
(0,1.7e-04) -
P1
P1 -
P2 (1, 0.954)
P3 (0, 0.004)
P4 (1, 0.358)
P2 P3 P4
(1, 0.954) (0, 0.004) (1,0. 358)
(0, 0.031) (1, 0.154)
(0, 0.031) (0, 0.035)
(1, 0.154) (0, 0.035) -
SARA (H0,P-Value) a = 0.05
P1
P1 -
P2 (1, 0.3125)
P3 (0,0.1875)
P4 (0,0.1765)
P2 P3 P4
(1, 0.3125) (0,0.1875) (0,0.1765)
(0, 0.1750) (1,0.35)
(0, 0.1750) (1,0.2875)
(1,0.35) (1,0.2875) -
Afterwards, we compute the MOS using the model provided in subsection 4.1.3 to evaluate the different adaptation methods in terms of QoE. Fig. 11 shows the average eMOS along with its 95% confidence interval for each adaptation method. It is worth mentioning that the results were obtained for all players using the same method across 50 runs of defined ACM Transactions on xxxxxxxx, Vol. xx, No. xx, Article xx, Publication date: Month YYYY
https://mc.manuscriptcentral.com/tomm
Transactions on Multimedia Computing Communications and Applications
scenario in subsection 4.2. It can be observed that on average, the players using our proposed method (Fuzzy) experienced higher average video quality compared to players using other methods. However, the average quality of SARA and FESTIVE are slightly lower than that of proposed method. Accordingly, it can be concluded that Fuzzy, SARA and FESTIVE perform rather similarly when taking into account the average eMOS. In addition, the results for TB and BB indicate that they achieved much lower average quality compared to other methods. The main reason behind that is due to inaccurate estimation of throughput obtained from smoothing measured segment throughputs using the constant smoothing factor while SARA and FESTIVE use weighted harmonic mean to estimate the available bandwidth. It should be noticed that BB does not make use of estimated bandwidth when the buffer level falls in some predefined ranges; so it shows better performance than TB. Moreover, in order to measure the consistency between HAS clients using the same adaptation method, the standard deviations of eMOS, together with their 95% confidence intervals, are provided in Fig. 12. The magnitude of this standard deviation represents the size of difference among the average eMOS experienced by the HAS clients. On average, the Fuzzy method is able to reduce eMOS deviation by 34%, 43%, 6% and 18% with comparison to TB, BB, SARA and FESTIVE methods respectively. FESTIVE presents relatively good performance by randomized chunk scheduling, and mitigates the issue of unfair bandwidth allocation among competing HAS players. However, results of Fuzzy and SARA methods show the lower standard deviation compared to FESTIVE which result from this fact that both of which eliminate OFF periods when possible (for Fuzzy when there is representation with higher bitrate than estimated bandwidth, and for SARA when the playback buffer is not completely full) by continuously downloading the following segment. It can be observed that TB and BB shows the worst performance that indicates there is a considerable difference among the video quality perceived by the HAS clients using these methods. These results also support this fact, which is neglected by many HAS adaptation methods, that the proper segment download scheduling method is able to improve the video quality perceived by different HAS clients sharing bandwidth on a bottleneck link.
Fig. 11. Average eMOS for the players using TB, Fuzzy (proposed method), BB, SARA and FESTIVE
Fig.12. Standard deviation of eMOS for the players using TB, Fuzzy (proposed method), BB, SARA and FESTIVE
4.3 Fairness analysis
Finally, we investigate the fairness of our proposed method compared to TB, BB and FESTIVE. We conduct an experiment with different number of players. We assume that the available bandwidth of the bottleneck link is fixed such that each player is assigned 2 Mbps of the share bandwidth. For instance, if 8 players use the bottleneck link, the available bandwidth is fixed at 16 Mbps. In each run, we calculate the fairness using Jain index [Jain, et al. 1984], where JainIndex is Jain’s fairness index. Fig.13 plots the average of the unfairness index across the different number of the competing players. The average fairness measured by Jain index experienced by the players using our proposed method is almost 80%, 28%, 39%, %35 more than that of TB, BB, FESTIVE and SARA respectively. ACM Transactions on xxxxxxxx, Vol. xx, No. x, Article x, Publication date: Month YYYY
https://mc.manuscriptcentral.com/tomm
Page 20 of 27
Page 21 of 27
Transactions on Multimedia Computing Communications and Applications 21
However, the unfairness indices of our proposed method and FESTIVE slightly vary for different number of players whereas the unfairness indices of TB and BB considerably change as the number of players increases. These results reveal that although FESTIVE strives to eliminate the biasing event among the competing players and show a flat behavior across different number of players, the existence of its OFF-periods gives the opportunity to other players to unfairly share the bandwidth. The players in our proposed method share the bandwidth fairly because they use progressive download when the shared bandwidth is less than the highest available video bitrate.
Fig.13. Fairness for the different number of players
5. CONCLUSION AND FUTURE WORK
In this article, we proposed a video bitrate adaptation and prediction mechanism for HAS. Our proposed system takes into consideration the estimation of available network bandwidth as well as the predicted buffer occupancy level. Features that distinguish our system from other solutions are: First, we propose a method that eliminates the ON-OFF traffic pattern if the estimated available bandwidth is less than the maximum available video bitrate. Second, we apply KAMA to address the issue of selecting the proper smoothing factor based on network context. Third, we applied a prediction mechanism that allows the FLC to proactively respond to current situations using the predicted buffer level and take appropriate actions sooner, especially when the chance of buffer underrun/overrun is high. We have also shown that wrong predictions have no negative effect on the performance of the adaptation mechanism since it ignores accuracies that are not within an acceptable range. Based on the experimental tests, our system has better performance compared to other existing solutions in terms of fair bandwidth allocation and quality of streams perceived by players. In the future, Since, in general, the nature of bandwidth variation is wilder, we expect that our proposed predictor does not work very well as it works for wired network, so we will need to take advantage of more complicated traffic traces, plan to use more complex scenarios such as real world traces of Wifi and 3G traces. We are also planning to investigate and evaluate the interaction of our proposed method with other adaptation methods in scenarios involving players with different adaptation mechanisms simultaneously competing for bandwidth at the bottleneck link. 6. REFERENCES BEGEN, A.C., AKGUL, T. AND BAUGHER, M. 2011. Watching video over the web: Part 1: Streaming protocols. Internet Computing, IEEE 15, 54-63. KUSCHNIG, R., KOFLER, I. AND HELLWAGNER, H. 2011. Evaluation of HTTP-based request-response streams for internet video streaming. In Proceedings of the second annual ACM conference on Multimedia systems, ACM, 245-256. (MPEG) IJSW. 2010. Dynamic adaptive streaming over http. MOK, R.K., LUO, X., CHAN, E.W. AND CHANG, R.K. 2012a. QDASH: a QoE-aware DASH system. In Proceedings of the 3rd Multimedia Systems Conference, ACM, 11-22. AKHSHABI, S., ANANTAKRISHNAN, L., BEGEN, A.C. AND DOVROLIS, C. 2012a. What happens when HTTP adaptive streaming players compete for bandwidth? In Proceedings of the 22nd international workshop on ACM Transactions on xxxxxxxx, Vol. xx, No. xx, Article xx, Publication date: Month YYYY
https://mc.manuscriptcentral.com/tomm
Transactions on Multimedia Computing Communications and Applications
Network and Operating System Support for Digital Audio and Video, ACM, 9-14. KAUFMAN, P. 1995. Smarter trading. New York: McGraw-Hill. LIU, S., LIN, Y. AND FORREST, J.Y.L. 2010. Grey systems: theory and applications. Springer Science & Business Media. THANG, T.C., LE, H.T., PHAM, A.T. AND RO, Y.M. 2014. An evaluation of bitrate adaptation methods for HTTP live streaming. Selected Areas in Communications, IEEE Journal on 32, 693-705. LI, B., WANG, Z., LIU, J. AND ZHU, W. 2013. Two decades of internet video streaming: A retrospective view. ACM Transactions on Multimedia Computing, Communications, and Applications (TOMM) 9, 33. ZAMBELLI, A. 2009. IIS smooth streaming technical overview. Microsoft Corporation 3. LIU, C., BOUAZIZI, I. AND GABBOUJ, M. 2011. Rate adaptation for adaptive HTTP streaming. In Proceedings of the second annual ACM conference on Multimedia systems, ACM, 169-174. THANG, T.C., HO, Q., KANG, J.W. AND PHAM, A.T. 2012. Adaptive streaming of audiovisual content using MPEG DASH. Consumer Electronics, IEEE Transactions on 58, 78-85. XIONG, P., SHEN, J., WANG, Q., JAYASINGHE, D., LI, J. AND PU, C. 2012. NBS: a network-bandwidth-aware streaming version switcher for mobile streaming applications under fuzzy logic control. In Mobile Services (MS), 2012 IEEE First International Conference on, IEEE, 48-55. MILLER, K., QUACCHIO, E., GENNARI, G. AND WOLISZ, A. 2012. Adaptation algorithm for adaptive streaming over HTTP. In Packet Video Workshop (PV), 2012 19th International, IEEE, 173-178. AKHSHABI, S., NARAYANASWAMY, S., BEGEN, A.C. AND DOVROLIS, C. 2012b. An experimental evaluation of rate-adaptive video players over HTTP. Signal Processing: Image Communication 27, 271-287. HUANG, T., JOHARI, R., MCKEOWN, N., TRUNNELL, M. AND WATSON, M. 2014. A buffer-based approach to rate adaptation: Evidence from a large video streaming service. In Proceedings of the 2014 ACM conference on SIGCOMM, ACM, 187-198. LE, H.T., NGUYEN, D.V., NGOC, N.P., PHAM, A.T. AND THANG, T.C. 2013. Buffer-based bitrate adaptation for adaptive HTTP streaming. In Advanced Technologies for Communications (ATC), 2013 International Conference on, IEEE, 33-38. TIAN, G. AND LIU, Y. 2012. Towards agile and smooth video adaptation in dynamic HTTP streaming. In Proceedings of the 8th international conference on Emerging networking experiments and technologies, ACM, 109-120. BOUTEN, N., SCHMIDT, R.D.O., FAMAEY, J., LATRÉ, S., PRAS, A. AND DE TURCK, F. 2015. QoE-driven innetwork optimization for Adaptive Video Streaming based on packet sampling measurements. Computer networks 81, 96-115. JIANG J, SEKAR V, SUN Y. DDA: Cross-Session Throughput Prediction with Applications to Video Bitrate Selection, 2015. SPITERI K, URGAONKAR R, SITARAMAN RK. BOLA: Near-Optimal Bitrate Adaptation for Online Videos. In Proceedings of the 35th Annual IEEE International Conference on Computer Communications, 1-9. JIANG, J., SEKAR, V. AND ZHANG, H., “Improving fairness, efficiency, and stability in HTTP-based adaptive video streaming with FESTIVE”, IEEE/ACM Transactions on Networking, 22(1), 2014, pp. 326–340. BEBEN A, WIŚNIEWSKI P, BATALLA JM, KRAWIEC P. ABMA+: lightweight and efficient algorithm for HTTP adaptive streaming. In Proceedings of the 7th ACM International Conference on Multimedia Systems 2016 May 10 (p. 2). JULURI P, TAMARAPALLI V, MEDHI D. SARA: Segment aware rate adaptation algorithm for dynamic adaptive streaming over HTTP. In IEEE International Conference on Communication Workshop (ICCW) 2015 Jun 8 (pp. 1765-1770). JULURI P, TAMARAPALLI V, MEDHI D. Look-ahead rate adaptation algorithm for DASH under varying network environments. 11th International Conference on the InDesign of Reliable Communication Networks (DRCN), 2015 (pp. 89-90). LI, Z., BEGEN, A.C., GAHM, J., SHAN, Y., OSLER, B. AND ORAN, D. 2014a. Streaming video over HTTP with consistent quality. In Proceedings of the 5th ACM Multimedia Systems Conference, ACM, 248-258. JOSEPH, V. AND DE VECIANA, G. 2014. NOVA: QoE-driven optimization of DASH-based video delivery in networks. In INFOCOM, 2014 Proceedings IEEE, 82-90. ALBERTI, C., RENZI, D., TIMMERER, C., MUELLER, C., LEDERER, S., BATTISTA, S. AND MATTAVELLI, M. 2013. Automated QoE evaluation of dynamic adaptive streaming over HTTP. In Quality of Multimedia Experience (QoMEX), 2013 Fifth International Workshop on, IEEE, 58-63. DE VRIENDT, J., DE VLEESCHAUWER, D. AND ROBINSON, D. 2013. Model for estimating QoE of video delivered using HTTP adaptive streaming. In Integrated Network Management (IM 2013), 2013 IFIP/IEEE International Symposium on, IEEE, 1288-1293. CHEN, C., CHOI, L.K., DE VECIANA, G., CARAMANIS, C., HEATH, R.W. AND BOVIK, A.C. 2014. Modeling the Time—Varying Subjective Quality of HTTP Video Streams With Rate Adaptations. IEEE Transactions on Image Processing, 23, 2206-2221. SOBHANI, A., YASSINE, A. AND SHIRMOHAMMADI, S. 2015. A fuzzy-based rate adaptation controller for DASH. In Proceedings of the 25th ACM Workshop on Network and Operating Systems Support for Digital Audio and Video, ACM, 31-36. YIN X, JINDAL A, SEKAR V, SINOPOLI B. A control-theoretic approach for dynamic adaptive video streaming over HTTP. ACM SIGCOMM Computer Communication Review. 2015 Sep 22;45(4):325-38. ZHOU C, LIN CW. A Markov decision based rate adaption approach for dynamic HTTP streaming. In Visual Communications and Image Processing (VCIP) 2015 Dec 13 (pp. 1-4). ACM Transactions on xxxxxxxx, Vol. xx, No. x, Article x, Publication date: Month YYYY
https://mc.manuscriptcentral.com/tomm
Page 22 of 27
Page 23 of 27
Transactions on Multimedia Computing Communications and Applications 23
MART V, GARC N. Evaluation of Q-Learning approach for HTTP adaptive streaming. In IEEE International Conference on Consumer Electronics (ICCE) 2016 Jan 7 (pp. 293-294). HOUDAILLE, R. AND GOUACHE, S. 2012. Shaping http adaptive streams for a better user experience. In Proceedings of the 3rd Multimedia Systems Conference, ACM, 1-9. LI, Z., ZHU, X., GAHM, J., PAN, R., HU, H., BEGEN, A. AND ORAN, D. 2014b. Probe and adapt: Rate adaptation for http video streaming at scale. Selected Areas in Communications, IEEE Journal on 32, 719-733. NAGLE, J. 1984. RFC 896: Congestion control in IP. TCP internetworks (January 1984) . PETRANGELI, S., FAMAEY, J., CLAEYS, M., LATRÉ, S. AND TURCK, F.D. 2015. QoE-driven Rate Adaptation Heuristic for Fair Adaptive Video Streaming. ACM Transactions on Multimedia Computing, Communications, and Applications (TOMM) 12, 28. ZHOU, C., LIN, C., ZHANG, X. AND GUO, Z. 2013. Buffer-based smooth rate adaptation for dynamic HTTP streaming. In Signal and Information Processing Association Annual Summit and Conference (APSIPA), 2013 Asia-Pacific, IEEE, 1-9. YAO, J., KANHERE, S.S. AND HASSAN, M. 2012. Improving QoS in high-speed mobility using bandwidth maps. Mobile Computing, IEEE Transactions on 11, 603-617. CURCIO, I.D., VADAKITAL, V.K.M. AND HANNUKSELA, M.M. 2010. Geo-predictive real-time media delivery in mobile environment. In Proceedings of the 3rd workshop on Mobile video delivery, ACM, 3-8. RIISER, H., ENDESTAD, T., VIGMOSTAD, P., GRIWODZ, C. AND HALVORSEN, P. 2012. Video streaming using a location-based bandwidth-lookup service for bitrate planning. ACM Transactions on Multimedia Computing, Communications, and Applications (TOMM) 8, 24. HAO, J., ZIMMERMANN, R. AND MA, H. 2014. Gtube: Geo-predictive video streaming over http in mobile environments. In Proceedings of the 5th ACM Multimedia Systems Conference, ACM, 259-270. BROWN, R.G. 1957. Exponential smoothing for predicting demand. In Operations Research, INST OPERATIONS RESEARCH MANAGEMENT SCIENCES 901 ELKRIDGE LANDING RD, STE 400, LINTHICUM HTS, MD 21090-2909, 145-145. CHATFIELD, C. 1978. The holt-winters forecasting procedure. Applied Statistics 264-279. . SMOLA, A.J. AND SCHÖLKOPF, B. 2004. A tutorial on support vector regression. Statistics and computing 14, 199-222. ZADEH, L.A. 1975. The concept of a linguistic variable and its application to approximate reasoning—I. Information Sciences 8, 199-249. MAMDANI, E.H. 1974. Application of fuzzy algorithms for control of simple dynamic plant. In Proceedings of the Institution of Electrical Engineers, IET, 1585-1588. LIU, X. 2007. Parameterized defuzzification with maximum entropy weighting function—another view of the weighting function expectation method. Mathematical and Computer Modelling 45, 177-188. RIZZO, L. 1997. Dummynet: a simple approach to the evaluation of network protocols. ACM SIGCOMM Computer Communication Review 27, 31-41. REDBULLPlaySTreets, Available at: 2014. http://www-itec.uniklu.ac.at/ftp/datasets/mmsys12/RedBullPlayStreets/redbull_6s/ JAIN R, CHIU DM, HAWE WR. A quantitative measure of fairness and discrimination for resource allocation in shared computer system. Hudson, MA: Eastern Research Laboratory, Digital Equipment Corporation; 1984 Sep 26. YOUNG, I.T. Proof without prejudice: use of the Kolmogorov-Smirnov test for the analysis of histograms from flow systems and other sources. The journal of histochemistry and cytochemistry: official journal of the Histochemistry Society 25, 1977, 935-941. CONOVER, W.J. AND CONOVER, W. 1980. Practical nonparametric statistics. LIU Y, DEY S, GILLIES D, ULUPINAR F, LUBY M. User experience modeling for DASH video. In 20th International Packet Video Workshop 2013 Dec 12 (pp. 1-8). CLAEYS M, LATRE S, FAMAEY J, DE TURCK F. Design and evaluation of a self-learning HTTP adaptive video streaming client. IEEE communications letters. 2014 Apr;18(4):716-9. CARMEL, S., DABOOSH, T., REIFMAN, E., SHANI, N., ELIRAZ, Z., GINSBERG, D., AND AYAL, E. 2002. Network Media Streaming. US Patent 6,389,473 MOK RK, CHAN EW, CHANG RK. Measuring the quality of experience of HTTP video streaming. In12th IFIP/IEEE International Symposium on Integrated Network Management (IM 2011) and Workshops, 2011 May 23 (pp. 485-492). TONI, L., APARICIO-PARDO, R., SIMON, G., BLANC, A., & FROSSARD, P. Optimal set of video representations in adaptive streaming. In Proceedings of the 5th ACM Multimedia Systems Conference, 2014, March, (pp. 271282). Echostar. Available at: http://www.echostar.com/ProductsAndServices/VideoAndBroadcast/Delivery/Technology.aspx,2009. Netflix, Available at: https://www.netflix.com/ca/,2016. Iperf, Available at:http://iperf.sourceforge.net/,2005. PARK, JIWOO, AND KWANGSUE CHUNG. "Rate adaptation scheme for HTTP-based streaming to achieve fairness with competing TCP traffic." In 2015 International Conference on Information Networking (ICOIN), pp. 222-226. IEEE, 2015. JANSEN, J., COPPENS, T., & DE VLEESCHAUWER, D. Quality assessment of video streaming in the broadband era. In Proc. Workshop on Advanced Concepts for Intelligent Vision Systems (ACIVS’2002), 2002, (pp. 38-45)
ACM Transactions on xxxxxxxx, Vol. xx, No. xx, Article xx, Publication date: Month YYYY
https://mc.manuscriptcentral.com/tomm
Transactions on Multimedia Computing Communications and Applications
Page 24 of 27
Online Appendix to: A Video Bitrate Adaptation and Prediction Mechanism for HTTP Adaptive Streaming ASHKAN SOBHANI, University of Ottawa, Canada ABDULSALAM YASSINE, University of Ottawa SHERVIN SHIRMOHAMMADI, University of Ottawa, Canada A.
KAUFMAN’S ADAPTIVE MOVING AVERAGE (KAMA)
In this section, we provide the calculation of ∁(i) used in Eq. (2), which is given by 𝑆𝑇(𝑖) = (1 − ∁(𝑖)) × 𝑆𝑇(𝑖 − 1) + ∁(𝑖) × 𝑇(𝑖) In order to calculate ∁(i), first, the efficiency ratio (𝐸𝑅(𝑖)) has to be determined. 𝐸𝑅(𝑖) is defined as the ratio of the direction of the sampled throughput series to the amount of volatility in the throughput sample series. The equation for 𝐸𝑅 is shown in (10). 𝐸𝑅(𝑖) = |𝐷𝑖𝑟𝑒𝑐𝑡𝑖𝑜𝑛(𝑖) / 𝑉𝑜𝑙𝑎𝑡𝑖𝑙𝑖𝑡𝑦(𝑖)|
(10)
As explained in [Kaufman. 1995], the direction and volatility can be computed using (11) and (12). 𝐷𝑖𝑟𝑒𝑐𝑡𝑖𝑜𝑛(𝑖) = 𝑇(𝑖) − 𝑇(𝑖 − 𝑛) 𝑉𝑜𝑙𝑎𝑡𝑖𝑙𝑖𝑡𝑦(𝑖) =
∑𝑛𝑡=1|𝑇(𝑖
− 𝑡) − 𝑇(𝑖 − 𝑡 − 1)|
(11) (12)
where 𝑇(𝑖) is the measured throughput of the ith segment and 𝑇(𝑖 − 𝑛) is used to show the nth sampled throughput ago. It should be noted that n specifies the number of periods (samples) used for computing ER(i) so that ER(i) would be 1 if the measured throughput consistently goes up/down in n consecutive periods, and ER(i) would be 0, if the measured throughput is constant over n consecutive periods. Moreover, in order to have enough number of samples to extract volatility from the noise of an erratic movement, n is usually set to 10. Once a new segment is downloaded, the corresponding measured throughput is fed into the window storing the last 10 measured segment throughputs, and the last one is thrown away. As the predictor operates in pipeline fashion synchronized with segment duration i.e. 6 seconds, a new prediction is generated every 6 seconds. Therefore, as ER(i) is always between 0 and 1, and it can be thought of as the ratio of the direction. Afterwards, we establish boundaries including shortest and longest length of look-back samples, denoted by 𝐹𝑎𝑠𝑡𝑆𝐶 and 𝑆𝑙𝑜𝑤𝑆𝐶 respectively, for KAMA. To do so, we use the 2 evaluation of 𝛼 = at the values of 𝑙, which are the number of samples to be considered as 𝑙+1 the length of shortest and longest history for 𝐹𝑎𝑠𝑡𝑆𝐶 and 𝑆𝑙𝑜𝑤𝑆𝐶 , respectively. For instance, if 2 and 30 samples are used as shortest and longest of look-back samples respectively, 𝐹𝑎𝑠𝑡𝑆𝐶 and 𝑆𝑙𝑜𝑤𝑆𝐶 are computed as follows. 1 𝐹𝑎𝑠𝑡𝑆𝐶 = [ ] = 0.667 1 + 𝑙 𝑙=2 1 𝑆𝑙𝑜𝑤𝑆𝐶 = [ ] = 0.0645 1 + 𝑙 𝑙=30 Now, 𝐸𝑅(𝑖) can be used as a scale factor to compute the corresponding average smoothing constant (𝑆𝑆𝐶(𝑖)) in the range of 𝑆𝑙𝑜𝑤𝑆𝐶 and 𝐹𝑎𝑠𝑡𝑆𝐶 using equation (13). 𝑆𝑆𝐶(𝑖) = 𝐸𝑅(𝑖) × (𝐹𝑎𝑠𝑡𝑆𝐶 − 𝑆𝑙𝑜𝑤𝑆𝐶 ) + 𝑆𝑙𝑜𝑤𝑆𝐶
(13)
In this case, if the trend of the measured throughput has remained fixed, or fluctuated around a fixed value over the last n consecutive periods, ER(i) will be close to 0, and, as it can be inferred from equation (13), SSC(i) will be close to SlowSC . On the other hand, if the trend of the measured throughput has consistently either increased or decreased over the ACM Transactions on xxxxxxxx, Vol. xx, No. x, Article x, Publication date: Month YYYY
https://mc.manuscriptcentral.com/tomm
Page 25 of 27
Transactions on Multimedia Computing Communications and Applications
last n consecutive periods, ER(i) will be close to 1, and the value of SSC goes towards Fast SC . Finally, the smoothing factor (∁(i)) in equation (2) is determined using equation (14). ∁(𝑖) = 𝑆𝑆𝐶(𝑖)2
(14)
Fig.14 shows an example of sample throughputs (blue curve) along with three smoothed curves: slow and fast smoothed versions of EWMA (green and black curves) and the smoothed version using KAMA (red curve). The samples of (𝑙) used in EWMA are 2 and 15, corresponding to fast and slow EWMA curves. As illustrated in the magnified plot, it is obvious that the fast EWMA curve follows closely the original throughput curve while the slow one filters out the short-term variation. Moreover, when there is a steady trend in the original curve, the slow EWMA reacts with more latency than the fast EWMA, which is intuitive. Also, the KAMA curve reveals that although KAMA reacts much faster to the throughput variations than the slow EWMA, it cancels out the short-term fluctuations comparable to what slow EWMA does. This behavior of KAMA stems from using a variable smoothing factor which changes with respect to the network condition.
Fig. 14. An example of throughput trace along with different of smoothed ones
B. GREY PREDICTION MODEL
This section explains the steps of constructing the Grey model at each round, and how the model is evaluated in terms of the mean relative error (MRE). Also, the provided example demonstrates how the Grey model predicts the level of the buffer. We assume that the consecutive buffer levels, measured at time intervals, comprise a time series. We use GM(1,1) [Liu, et al. 2010], a time series predicting model, as a predictor, because it has a reliable performance with small sample sizes [Jain and Wu. 2009]. Furthermore, it can predict the future outputs of the system with acceptable accuracy. Assume that sequence 𝑋 (0) = (𝑥 (0) (1), 𝑥 (0) (2), … , 𝑥 (0) (𝑛)) is a sequence of recent buffer levels, sampled after n consecutive segment downloads. A first-order weakening operator as defined in (15) is applied to 𝑋 (0) to generate a sequence, denoted by 𝑋 (0) 𝐷 and shown in (16). 𝑋 (0) 𝐷 is slower than the original sequence, 𝑋 (0) , which means it decreases or increases slower than 𝑋 (0) . In the case of fluctuations, it fluctuates in a smaller range than 𝑋 (0) . 1 ∑𝑛𝑖=𝑘 𝑥 (0) (𝑖), 𝑘 = 1,2, … , 𝑛 𝑋 (0) (𝑘)𝑑 = (15) 𝑛−𝑘+1
𝑋 (0) 𝐷 = (𝑥 (0) (1)𝑑, 𝑥 (0) (2)𝑑, … , 𝑥 (0) (𝑛)𝑑)
(16)
(0)
In order to find the inclination in the weakened sequence, 𝑋 𝐷, GM(1,1) produces a new sequence with less randomness, called accumulation generated sequence (AGS) denoted by
ACM Transactions on xxxxxxxx, Vol. xx, No. x, Article x, Publication date: Month YYYY
https://mc.manuscriptcentral.com/tomm
Transactions on Multimedia Computing Communications and Applications
Page 26 of 27
-3-
𝑋 (1) = (𝑥 (1) (1), 𝑥 (1) (2), … , 𝑥 (1) (𝑛)). The one time accumulated generation operation (1-AGO), used for producing AGS, is defined in (17). 𝑋 (1) (𝑘) = ∑𝑘𝑙=1 𝑋 (0) (𝑙)𝑑 , 𝑘 = 1,2, … , 𝑛
(17)
Then, the background sequence, 𝑍 (1) = (𝑧 (1) (2), 𝑧 (1) (3), … , 𝑧 (1) (𝑛)), is generated by weighted average of the adjacent members in AGS as shown in equation (18). 𝑧 (1) (𝑘) = (𝑝 × 𝑥 (1) (𝑘) + (1 − 𝑝)𝑥 (1) (𝑘 − 1)) , 𝑘 = 2, 3, … , 𝑛
(18)
The coefficient p is selected from [0,1]. As pointed in [Jain and Wu. 2009], when the distribution of data is unknown, we use equal weight mean, that can be achieved by 𝑝 = 1/2. Now, by using a first order differential equation, a system can be modeled, as demonstrated in equation (19). This model is referred to as a basic form of the GM(1, 1) model. 𝑥 (0) (𝑘) + 𝜔𝑧 (1) (𝑘) = 𝜓
(19)
If we define 𝑥 (0) (2) (0) 𝑌 = 𝑥 (3) ⋮ [𝑥 (0) (𝑛)]
and
−𝑧 (1) (2) (1) 𝐵 = −𝑧 (3) ⋮ [−𝑧 (1) (𝑛)
(20)
1 1 ⋮ 1]
(21)
then parameters 𝜔 and 𝜓 can be calculated using the Least Square method as follows: 𝜔 [𝜓 ] = (𝐵𝑇 𝐵)−1 𝐵𝑇 𝑌 (22) Having the computed parameters 𝜔 and 𝜓 , the predicted value of 𝑥̂ (1) (𝑘 + 1) can be obtained using the solution of whitenization equation (23) of the GM(1,1), as in (24). 𝑑𝑥 (1) + 𝜔𝑥 (1) (𝑘) = 𝜓 𝑑𝑡
(23) 𝜓
𝜔
𝜔
𝜓
𝑥̂ (1) (𝑘 + 1) = (𝑥 (1) (1) − ) 𝑒 −𝜔𝑘 +
(24)
So the predicted buffer level at time interval 𝑘 + 1, 𝑥̂ (0) (𝑘 + 1), is given as follows: 𝜓 𝑥̂ (0) (𝑘 + 1) = 𝑥̂ (1) (𝑘 + 1) − 𝑥̂ (1) (𝑘) = (1 − 𝑒 𝜔 )(𝑥 (0) (1) − )𝑒 −𝜔𝑘 𝜔
(25)
Before using the predicted value of the buffer level, the constructed model must be evaluated to find out if the generated results are applicable. For doing so, different criteria can be used such as Mean Relative Error (MRE), Degree of Incidence, Ratio of Mean Square deviations, and Small Error Probability. Since MRE is commonly used, it is computed after each round in order to check the validity of GM(1,1). If 𝑋̂ (0) = (𝑥̂ (0) (1), 𝑥̂ (0) (2), … , 𝑥̂ (0) (𝑛)) is the corresponding sequence generated by the GM(1,1), the error sequence, 𝛦 (0) = (ε(0) (1), ε(0) (2), … , ε(0) (n)) , between the actual data and the predicted data is simply computed by (26). ACM Transactions on xxxxxxxx, Vol. xx, No. xx, Article xx, Publication date: Month YYYY
https://mc.manuscriptcentral.com/tomm
Page 27 of 27
Transactions on Multimedia Computing Communications and Applications
𝜀 (0) (𝑘) = (𝑥 (0) (𝑘) − 𝑥̂ (0) (𝑘))
(26)
Then the sequence of relative error, 𝛥 = (𝛥1 , 𝛥2 , … , 𝛥𝑛 ), is computed using (27). (0) (𝑘) ⁄ (0) | 𝛥𝑘 = | 𝜀 𝑥 (𝑘)
(27)
1 Finally, the average of these relative errors, 𝛥̅ = ∑𝑛𝑖=1 𝛥𝑖 , is used as a criterion so that the 𝑛 smaller 𝛥̅ indicates that the constructed model could predict the buffer level more accurately. In order to evaluate the model, the mean relative error (MRE) is compared with one pre-defined value called a critical value ( 𝑐𝑣 ). This critical value shows a level of accuracy so that if 𝛥̅ < 𝑙 then the model is accurate enough to be used; otherwise, the model is not accurate enough to be used. Table VII shows the frequently used levels of accuracy [Liu, et al. 2010].
Table VII. Definition of accuracy levels [Liu, et al. 2010] Level of Relative Error 1 2 3 4
Critical value (cv) 0.01 0.05 0.10 0.20
Afterwards, the predicted value by the validated model is given to the Fuzzy controller for decision making. Once the new sample of buffer level becomes available, the new Grey model is re-established and revalidated using the aforementioned accuracy check. In the case of accuracy check failure, the current level of the buffer would pass to the Fuzzy controller as an input. To demonstrate how the Grey model predicts the level of the buffer, an example is shown in Fig.15. The curves of actual and predicted values of the buffer level are depicted and the bars plotted under the curves shows the relative error levels, as defined in Table VII. As we can see from the figure, the Grey model for the most part is able to predict the behavior of buffer dynamics with acceptable range (according to Table VII). However, for some segments e.g. 10 and 40 the relative error level is not in the acceptable range. In this case the predictions will be ignored, and the FLC will take the current buffer level as an input. In this example, the relative error level was considered to be 3 (Table VII) so that the ̅ < 0.1 ) will be prediction results which have an average relative error less than 0.1 (Δ considered by the FLC.
Fig. 15. Prediction results of the GM(1,1) model and the corresponding relative error level along with the buffer level dynamic
ACM Transactions on xxxxxxxx, Vol. xx, No. x, Article x, Publication date: Month YYYY
https://mc.manuscriptcentral.com/tomm