include edge orientation and blob size histograms resulted from ... count people is based on change detection and blob tracking ... Figure 1 (d) shows the binary.
A Viewpoint Invariant Approach for Crowd Counting Dan Kong, Doug Gray and Hai Tao Department of Computer Engineering University of California, Santa Cruz Santa Cruz, CA 95064 (kongdan,dgray,tao)@soe.ucsc.edu
Abstract This paper describes a viewpoint invariant learningbased method for counting people in crowds from a single camera. Our method takes into account feature normalization to deal with perspective projection and different camera orientation. The training features include edge orientation and blob size histograms resulted from edge detection and background subtraction. A density map that measures the relative size of individuals and a global scale measuring camera orientation are estimated and used for feature normalization. The relationship between the feature histograms and the number of pedestrians in the crowds is learned from labeled training data. Experimental results from different sites with different camera orientation demonstrate the performance and the potential of our method. .
1. Introduction Estimating the number of people in an image is a practical machine vision task that is gaining popularity in the security and surveillance community. Many methods currently exist for estimating the size and density of a crowd using image processing techniques [2]. Texture analysis has proven to be a useful feature for identifying different levels of crowd density [4]. Feed forward neural networks have been trained to accurately estimate crowd size in real time with relatively simple image features [1][14]. The main shortfall of these methods is the lack of spatial information in the feature model. Since people who are farther away from the camera appear smaller, they generally contribute less to the aforementioned crowd estimates. Paragios and Ramesh have attempted to account for this factor by weighing each pixel based on a simple density estimator [6]. Another technique to count people is based on change detection and blob tracking [9][10][11]. These systems are mainly aimed
The 18th International Conference on Pattern Recognition (ICPR'06) 0-7695-2521-0/06 $20.00 © 2006
at classifying objects and activities by analyzing their shapes and trajectories. There are attempts made to use existing face and pedestrian detectors for estimating crowd size and density. In [13], a system is developed to detect crowd in real-time by looking at the motion patterns of crowds in the spatial-temporal domain. Lin has proposed using a perspective transform to estimate crowd size using the output of a face detection algorithm [3]. Local features including appearance and motion are also used to detect pedestrians [15]. However detection based methods all rely on the output of the detector, which can be of poor quality under viewpoint or illumination changes and are computationally expensive. In this paper, we developed a system to count pedestrians in crowds from a single camera and our contributions have two aspects. First, instead of using simple features such as a summation of edge or blob pixels, feature histograms are adopted. This representation is more powerful than simple features in terms of handling noise and can more accurately count pedestrians moving in groups. Second, unlike previous learning-based approaches, our method takes into account the feature normalization to deal with perspective projection and camera orientation. Thus, our system is trained to be viewpoint invariant and can be deployed with minimal setup.
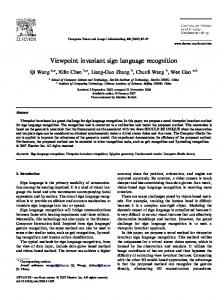
2. Feature Extraction and Normalization 2.1. Feature Extraction The features include foreground regions given by a background subtraction algorithm and the edge orientation map generated by an edge detector, as shown in Figure 1. The mixture-of-Gaussian based adaptive background modeling method [8] is used to generate foreground mask for each frame as shown in Figure 1(b). Unlike the multiple pedestrian tracking system proposed in [12], we do not explicitly segment
the foreground blobs. Instead, we compute a blob size histogram using the foreground mask. Let H b (i ) and B (i ) denote the count and size for bin i . The size of a foreground blob k is denoted as S (k ) . The blob size histogram is formed as follows: ½ H b (i ) = ® ¦ S (k ) | B(i ) ≤ S (k ) < B(i + 1) ¾ (1) ¯k ¿ This histogram serves two purposes. Firstly, it can model noise resulted from background subtraction. Secondly, the difference between individual pedestrian and group of pedestrians can be captured. For example, a single pedestrian may occupy 100 pixels. When two pedestrians are together, due to occlusion, there will be less than 200 pixels. The edge detection map is shown in Figure 1(c). We apply canny edge detector to each frame. Figure 1 (d) shows the binary edge map after the AND operation between (c) and the foreground mask (b). In [1], the total edges length is one of the features used to represent crowd density. In our system, we use an edge orientation histogram instead of a summation of edges. Such a representation can distinguish edges caused by pedestrians, which are usually vertical, with other scene structures such as noise, shadows and cars.
(a)
(b)
(c) (d) Figure 1: Features: (a) original image, (b) foreground mask image (c) edge detection map, (d) the edge map after the ‘AND’ operation between (b) and (c).
2.2. Density Estimation Two assumptions are made in our density estimation model. It is assumed that all the pedestrians in the scene have similar size, and that they all lie on a horizontal ground plane. In this paper, a simple cylinder model is adopted for the pedestrians. Due to perspectivity, the projected 2D height varied when the people move on the ground plane. Assume u 0 is the image projection of a point
The 18th International Conference on Pattern Recognition (ICPR'06) 0-7695-2521-0/06 $20.00 © 2006
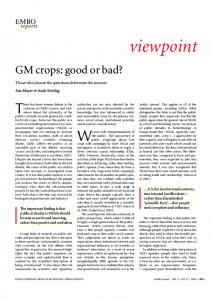
x0 on the ground plane. Point x = [ x, y, h]T is vertically above x0 . Then the measured 2D height is l =|| u 0 − u(h) || , where u (h) is the projection of point x . When people translates on the ground, we can measure the ratio of the projected height l1 / l2 . The ratio reflects the relative crowd density on the ground plane and accurate estimation of it requires camera calibration. In our system, it is approximated by estimating the homography between the ground plane and image plane. Once we estimate the homography H between the ground plane and the image, the next task is to compute the relative density d (u, v) for each pixel (u, v) in the ROI. To do this, we first pick a reference point r (u , v) in the ROI. Applying the inverse homography leads to the coordinate of the corresponding point r ( x, y ) = H −1r (u, v ) in the ground plane. We pick a square centered at r ( x, y) and warp the four corner points of the square back into the image plane using the homography. The area covered by the trapezoid in the image plane is computed and denoted as Ar . Then we repeat this process and compute the area A(u, v) for all the pixels inside the region of interest. For each pixel, the relative density is defined as d (u, v) = A(u, v) / Ar . This leaves the reference point has density equal to one. Figure 2 shows the region of interest (ROI) and the geometric weight image associated with it. The darker pixel values in the ROI correspond to more weight. It can be seen that the perspectivity is captured using the quasi-calibration information.
Figure 2: Density estimation. Left: region of interest in the image. Right: density map (weights)
Another geometric distortion we need to account for is different camera setup. To make the training invariant to different viewpoint, we adopt the following strategy. First, the standard height to width ratio of our cylinder model is defined as k = h / w . Then, for each training site, when pick the reference point for density estimation, we also measure the height to width ratio of pedestrian in the image at that point. Let it be k ' , then the scale for that training site will then be approximated as S = k / k ' . To see why
this scale factor captures the different camera orientation, we use a pin hole camera model for illustration. Let h ' and w ' be the projected height and width in the image. Under the cylinder model, the projected width will not be affected by the camera orientation. Using basic projective equation, the ratio k ' is computed as: h ' h × cos θ × f / z k'= ≈ = k cos θ (2) w' w× f / z Where f is the focal length, θ is the camera orientation and z is the distance from projection center to the people. It can be seen that the scale factor S = k / k ' = 1/ cos θ gives us an indirect measure of the camera orientation.
pedestrians walking together (highly occluded) would be different from those walking individually. To capture the nonlinear mapping between the input features and the crowd count from the training data, we use a single hidden layer neural network. In our system, the neural network model has a single hidden layer. The input layer has m + n input units, which corresponds to m + n bins of blob size and edge orientation histograms. There is only one output unit in our neural network, representing estimation of the crowd count. We train this network using standard back propagation (BP) algorithm with batch presentation. After the training has converged, we read out the weight matrix and bias vectors from the network and use them for online counting.
2.3. Feature Normalization
4. Experimental Results
Given d (u, v) and S , features are normalized with respect to relative density and orientation scale. The purpose of this feature normalization is to give us a measure of the features that is approximately invariant to the translations of pedestrians on the ground plane and under different camera viewpoint. Suppose binary edge orientation and blob map have been extracted from each frame. The edge and blob pixels are normalized with respective to the relative density and scale before constructing the histograms. For the edge orientation map, the normalization is: or '(u, v ) = or (u , v )* S d (u, v ) , where or (u, v) is the equal to one for edge pixels and zero for non-edge pixels. or '(u, v ) is the value after normalization. By doing this, we assume that the size of edge changes linearly with respect to the density and scale. For the change detection map, the normalization is: blob '(u , v) = blob(u, v )* S 2 d (u, v ) . Here we assume that the size of blob changes quadratically. The histograms are constructed from the normalized edge orientation and blob map.
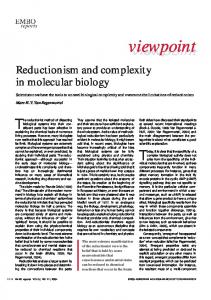
During training, we choose camera orientations ranging from horizontal to almost overhead. For each training sequence, we first pick the region of interest and specify the reference point in the first frame via the user interface. Then features are extracted and normalized every 20 frames. Histograms are computed based on the normalized features. In our implementation, edge orientation histogram has eight bins quantized from 0 to 180 degrees and blob size histogram has six bins with size 500 and uniform spacing is used. The trained system is first applied to count crowd from the same site with two different camera orientations, 30 and 70 degrees approximately. The counting is done offline so that we can compare the result with ground truth. The estimation results using linear fitting and neural network are shown in figure 3(a)(b). For comparison, we also show the counting results by simply using the edge length and total blob pixels. It can be concluded from figure 3 that for this two sequences, the linear fitting has comparable results to neural network. This may due to a lack of overcrowding in the training data. However, both methods have much better results than the one without using histograms. Figure 3(c) shows the estimation results for another site. The site is more crowded during the time we collected the data. We can see that neural networks have much better estimation results than a linear model for this example.
3. Training The goal of training is to find the relationship between the features and the number of pedestrian in the image. In our current system, the training is carried out in a supervised way and the training model we used is feed-forward neural network. For single camera pedestrian counting, accurate estimation becomes challenging with significant occlusion. Under such conditions, the pedestrian count and the features size does not have a simple linear relationship. For example, the blob size for a group of
The 18th International Conference on Pattern Recognition (ICPR'06) 0-7695-2521-0/06 $20.00 © 2006
5. Conclusions The main contributions of the paper are a novel feature representation and viewpoint invariant feature normalization for crowd counting. Instead of using raw edge and blob features, we use edge orientation and
blob size histograms. The viewpoint invariant feature normalization method is proposed to account for distortion introduced by perspectivity and different camera orientation. Our crowd counting system is trained offline in a supervised manner based on neural network. The experimental results from different sites with different camera setup demonstrate the accuracy and reliability of our system.
[2]
[3]
[4]
[5]
[6]
(a)
[7]
[8]
[9] [10]
(b)
[11]
[12]
[13]
(c) Figure 3: Crowd counting results (a) 30 degree sequences from site A. (b) 70 degree sequence from site A. (c) sequence from site B
7. References [1] S.-Y. Cho, T. W. S. Chow, and C.-T. Leung, “A neuralbased crowd estimation by hybrid global learning
The 18th International Conference on Pattern Recognition (ICPR'06) 0-7695-2521-0/06 $20.00 © 2006
[14]
[15]
algorithm,” IEEE Trans. Syst, Man, Cybern. B, vol. 29, pp. 535-541, 1999. A. C. Davies, J. H. Yin, and S. A. Velastin, “Crowd monitoring using image processing,” Electron. Commun. Eng. J., vol. 7 pp. 37 – 47, 1995. S. -F. Lin, J. -Y. Chen, H. -X. Chao, “Estimation of Number of People in Crowded Scenes Using Perspective Transformation,” in IEEE Trans. System, man, and cybernetics, vol. 31, No. 6, 2001 A. N. Marana, L. F. Costa, R. A. Lotufo, and S. A. Velastin, “On the efficacy of texture analysis for crowd monitoring,” in Proc. Computer Graphics, Image Processing, and Vision, 1998, pp. 354-361. D. Biliotti, G. Antonini, J. P. Thiran, “Multi-layer hierachical clustering of pedestrian trajectories for automatic counting of people in video sequences”, IEEE Workshop on Motion and Video Computing, 2005. N. Paragios, V. Ramesh, “A MRF-based approach for real-time subway monitoring,” In IEEE Int. Conf. on Computer Vision and Pattern Recognition (CVPR), 2003. T. W. S. Chow, J. Y. –F. Yam, S. –Y. Cho, “Fast training algorithm for feedfoward neural networks: application to crowd estimation at underground stations,” Artificital Intelligence in Engineering, vol. 13, pp. 301-307, 1999. C. Stauffer, W. Grimson, “Adaptive Background Mixture Models for Real-time Tracking,” In IEEE Conf. on Computer Vision and Pattern Recognition, Colorada, USA, 1999. M. Isard, J. MacCormick, “BraMBLe: A bayesian multiple-blob tracker,” in ICCV, v. 2, pp. 34-41, 1999 I. Haritaoglu, D. Harwood, L. S. Davis, “W4: Realtime surveillance of people and their activities,” In IEEE Transactions on Pattern Analysis and Machine Intelligence, vol. 22, No. 8, August 2000. R. Collins, A. Lipton, T. Kanade, “A system for video surveillance and monitoring,” American Nuclear Soc. 8th Int. Topical Meeting on Robotics and Remote Systems, 1999. T. Zhao, R. Nevatia, and F. Lv, “Segmentation and tracking of multiple humans in complex situations”, In CVPR01, 2001. Reisman, P. Mano, O. Avidan, S. Shashua, A. “Crowd detection in video sequences,” in IEEE Intelligent Vehicles Symposium, 2004. C. S. Regazzoni and A. Tesei., “Distributed data fusion for real-time crowding estimation,” Signal Process., vol. 53, pp. 47-63, 1996. Viola, M. Jones, and D. Snow. “Detecting pedestrians using patterns of motion and appearance”, In IEEE International Conference on Computer Vsion (ICCV’03), France, 2003.