Pattern Finder's query capabilities together with coupled ball-and- chain and tabular ... domain, these techniques apply equally well to other domains such as ...
A Visual Interface for Multivariate Temporal Data: Finding Patterns of Events across Multiple Histories Jerry Alan Fails
Amy Karlson
Layla Shahamat
Ben Shneiderman
Department of Computer Science University of Maryland
ABSTRACT Finding patterns of events over time is important in searching patient histories, web logs, news stories, and criminal activities. This paper presents PatternFinder, an integrated interface for visual query and result-set visualization for search and discovery of temporal patterns within multivariate and categorical data sets. We define temporal patterns as sequences of events with interevent time spans. PatternFinder allows users to specify the attributes of events, and time spans to produce powerful pattern queries that are difficult to express with other formalisms. We characterize the range of queries PatternFinder supports as users vary the specificity at which events and time spans are defined. Pattern Finder’s query capabilities together with coupled ball-andchain and tabular visualizations enable users to effectively query, explore and analyze event patterns both within and across data entities (e.g. patient histories, terrorist groups, web logs, etc.). CR Categories: H.5.2 [Information Interfaces and Presentation]: User Interfaces; H.5.2 [Information Systems]: Information Search and Retrieval — query formulation Keywords: Temporal query, information visualization, user interface 1
INTRODUCTION
Finding patterns of events is fundamental to understanding and reasoning in many domains. For example, in the medical field, time plays a critical role in assessing individual treatments based on personal medical history, as well as broader treatment success rates based on aggregate analysis of multiple case histories. Time also plays an important role in analyzing financial events that guide investment and in tracking travel events that could direct police intervention of terrorists. Despite a pervasive presence of temporal data, traditional database management systems support only SQL queries which are not convenient for temporal pattern search. Some research systems provide temporal access languages to support limited visual queries from end-users [1-4], but many of these suffer the same accessibility difficulties of SQL, namely that the languages are not known by nor are they welcoming to practitioners or require an understanding of the underlying database structure. Simply stated, to many practitioners these query languages are obscure. In contrast to some systems that support time-series data [5], we consider the multivariate and categorical nature of events. We define a temporal pattern as a sequence of point events separated by time spans. We describe PatternFinder and types of temporal patterns it supports. A representative task supported by PatternFinder would be finding and displaying patients who had A.V. Williams Building, College Park, Maryland 20742 {fails, akk, laylas, ben}@cs.umd.edu
high blood sugar on two consecutive blood tests within ten days. A pattern such as this would be challenging for average users to formulate using a query language, or to interpret as a text-based tabular result. Combining temporal query specification and visualization, PatternFinder enables exploration and discovery of patterns in temporal data. We approach this problem by focusing on visual query and exploration of temporal patterns within medical histories. Although our prototype and examples are grounded in the medical domain, these techniques apply equally well to other domains such as historical records (e.g., education registration, business), transaction-based data sets (e.g., web logs, finance), and police or intelligence investigation (e.g. money laundering, terror planning). 2
RELATED WORK
We divide the large body of related work into three general areas: time theory, databases, and visualizations. There is considerable overlap between these areas. Related research is vast, so only a few highlights are expressed along with their relevance to our work. 2.1 Time theory For ages theorists have mused about time. Much of the seminal work in computer science relating to time stems from artificial intelligence, time reasoning, and early natural language processing [6-8]. Time can be characterized by point or interval events. Snodgrass defines instance events as being absolute and intervals as being relative distances between two instances [9]. Allen introduces time intervals as the primitive for automated reasoning over temporally structured data [7]. He argues that all seemingly instantaneous events can be decomposed and thus all events can be modelled uniformly as intervals. He defines 13 mutually exclusive relations that hold between any two intervals: Equal, Before, After, During, Contains, Overlaps, Overlapped-by, Meets, Met-by, Starts, Started by, Finishes, and Finished-by. Allen also discusses how these can be hierarchically composed, however he does not implement an interface. PatternFinder supports intervals, including: start/stop event pairs, and as sets of events that share a user-defined characteristic, which together span an extent of time. Although overlapping queries are possible, we make the assumption that temporal sequence patterns will be the main focus of temporal queries, and therefore support them more directly. PatternFinder currently does not allow for hierarchical or recursive query definitions as Allen described, but it does implement a powerful interval-based query system. 2.2 Databases Over the years databases have progressed from theory, to small text files, to visual representations, to presently include research in spatial-temporal databases. In situating our work, this section focuses on visual interfaces and how databases deal with time.
2.2.1 Visual Query Interfaces to Relational Databases Traditional access to databases has been via SQL [10] a language designed specifically to create, organize and query databases. Due to the complexity of formulating SQL queries, several approaches have made database query more accessible to a broader spectrum of users. Query By Example (QBE) presents the structure of the database as skeleton tables, and is the visual query mechanism used in Microsoft’s Access [11]. Simple queries in QBE are formulated by users placing a mark in the data column they wish to be returned. Users enter constants to specify desired attribute values and variables to bind results across columns. Although visual query languages facilitate database query by avoiding SQL syntax, users must still understand the relational tables and formulate queries, using variables and other difficult concepts. PatternFinder presents users with visual constructs for querying the temporal relationships among events. 2.2.2 Time and Databases Numerous extensions to the relational model have been proposed to incorporate time, such as TSQL2 [4], an extension to the SQL-92 [10] language standard. TSQL2 provides a surrogate data type which can be used to support history identity and generalized range variables. A hybrid between QBE and Extended Entity-Relationship diagrams (EER) represents queries visually as EER objects for which attributes and variables can be instantiated [12]. In order to support temporal databases, each EER object and relation is associated with a temporal object describing its valid (when the event happened) and transaction (when it was recorded) times. Temporal queries are supported by temporal operator objects in the diagram including the qualifiers: before, during, after, start and end. This work was expanded by a conceptually equivalent approach which allows users to manipulate EER type objects and specify time constraints using a rich set of menus and toolbars [13]. This hybrid system allows users to look at snapshots (data representing a given time) or slices (data over time). Although both QBE-EER and hybrid approaches support queries over temporal events using a visual, direct-manipulation language, the temporal operators are an extension to a generalpurpose database query language. Thus neither attempt to visually encode temporal aspects and relationships in a succinct or orderly way to take advantage of the strictly ordered nature of time. MQuery is another approach for visual query via entity-relation style specification [14]. MQuery targets various types of streaming data, such as video footage and medical histories. Temporal features can be captured by before/after date specifications and left to right positioning of query objects, but it does not provide a higher level representation of the temporal aspects of the data or the query itself. 2.3 Related Visualizations This section discusses three different aspects of related visualization, visual query by time intervals, other temporal visualizations and concludes with related work 2.3.1 Visual Query by Time Interval Chittaro and Combi proposed three alternative visual metaphors for querying temporal intervals [15]. The authors based the expressivity of their visual language on Allen’s 13 relations between two intervals. Three semantically equivalent representations (elastic bands, springs and paint strips) depict horizontal bars whose ends can be constrained in such a way as to capture Allen’s interval relationships. Hibino and Rudensteiner introduced a forms-based direct manipulation Temporal Visual Query Language (TVQL) for
specifying interval endpoint constraints [16] to support Allen’s 13 relational primitives. Four double-sided sliders allow users to express the relationship between each pair of endpoints among two intervals. Users interact exclusively with the sliders, while a visual representation of the interval interaction is dynamically updated to provide users feedback on the meaning of the defined query. Although both of the above systems implement all 13 of Allen’s temporal relationships, the interfaces are difficult to conceptualize. We believe the simple timeline layout of queries and visualizations implemented in PatternFinder enable users to more readily conceptualize and discover temporal patterns. 2.3.2 Visualizing Temporal Patterns Interestingly, none of these proposals address the visualization of the returned results. However, applications such as TimeSearcher [5], Spirals [17], DataJewel [18], KNAVE [2] and LifeLines [19] offer visualizations that cluster results and highlight temporal patterns. TimeSearcher allows users to explore ordinal data by specifying queries using TimeBoxes, rectangular query operators that specify the regions in which the users are interested. Spirals uses each ring of the spiral to represent a periodic section of a time series. Color and line thickness are used to distinguish the data values. DataJewel tightly couples a familiar calendar visualization with database and algorithmic components for exploring temporal data patterns. Each calendar day displays the frequency of events using horizontal histograms such that month views offer a compact representation for users to visually detect patterns. 2.3.3 Patterns in Health Care In health care, patients may be assessed individually by nurses and physicians, or en masse by clinical researchers, public health officials, auditors, etc. LifeLines provides a compact hierarchical timeline visualization for personal histories organized by facets, such as doctor visits, lab tests, and medications [19]. LifeLines supports zooming, adjusting the time scale, filtering records and accessing details on demand. LifeLines supports both discrete time events, displayed as icons, and interval events, displayed as lines. Line thickness and color encode event attributes such as significance and relationship to other events. Lifelines primarily supports directed browsing with textual search, but does not offer a higher-level query mechanism for discovery across multiple records. Many systems have built on LifeLines. Bade et. al. presented different temporal visualizations for medical data including a temporal mural that captures high-frequency data while still allowing browsing of time and data [20]. Another patient history system, CareView, used enhanced visualizations with the goal of increasing the visibility of temporal trends in clinical narratives [21]. While both of these systems contribute informative new temporal visualizations, neither allow for temporal query nor provide views of multiple entities (i.e. patients). Although not directly related to the medical field a set of visualizations that build along the same vein as PatternFinder are those of Chen et. al [22]. Chen et. al. presented STV (SpatioTemporal Visualization) and CAN (Criminal Activities Network). STV uses coordinated visualizations including a geo-spatial representation (a map), a timeline, and a spiral periodic visualization, all of which change as a time slider is adjusted. CAN provides a visualization for network changes over time using spring-embedded block algorithms. Both systems incorporate time and use coordinated views as does PatternFinder, but do not allow query of temporal patterns.
Shahar proposes a Knowledge Based Temporal Abstraction model RÉSUMÉ [23] to enable domain knowledge sharing and summarization in a context sensitive manner. Knowledge-based Navigation of Abstraction for Visualization and Explanation (KNAVE) is the visualization and navigation module that operates over RÉSUMÉ to support physician decisions about treatment protocols. KNAVE offers semantic navigation for three types of tasks: domain ontology traversal, presentation adaptation according to changes in temporal granularity (e.g., aggregating daily blood sugar outcomes when viewed by year versus day), and context switching. While KNAVE supports clinicians by summarizing individual patient conditions in a disease protocol, it does not provide cross-patient query and discovery within a specified protocol nor context-free record overview or exploration. 3
PATTERNFINDER: VISUALIZATION
VISUAL
QUERY
AND
RESULTS
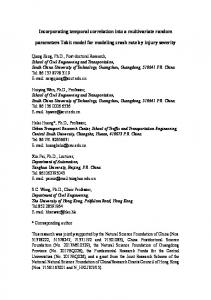
We emphasize that none of the systems discussed above enable query or visualizations of patterns across multiple entities (e.g. cross-patient query). This is one of the major contributions of PatternFinder, the combined power of temporal queries with graphical visualizations. 3.1 Data Set Description In the tradition of LifeLines, we created a mock data set of over 26,000 medical events for 950 patients. Each event has a type and a value. The type supports up to three levels of a hierarchy. For example a visit to the doctor’s office for a check-up would be specified by the three level hierarchy: Visit → Doctor Office → Checkup. Event values can be numeric, such as for a systolic blood pressure reading, or categorical, such as normal/abnormal blood sugar. For simplicity, in this version events are point events at the day granularity. 3.2 Temporal Patterns We define a temporal pattern as a sequence of events separated by time spans (Figure 1). In PatternFinder, users define patterns by setting constraints on Events and Time Spans. PatternFinder’s visual query interface maps Events and TimeSpans to form-based elements that support a rich set of pattern queries, presented formally in Section 4. Pattern matches are then displayed for
visual exploration. To support pattern discovery, the PatternFinder interface is divided into two main panels: the pattern design panel and the results visualization panel.
Figure 1: A Pattern is a sequence of events and time spans.
3.3 Visual Pattern Design The top half of the PatternFinder interface supports pattern design and specification (Figure 2). Users consider elements of the pattern design panel from left to right. Because patterns are applied within individual patient histories, the leftmost panel allows users to restrict the types of patients in the results set in the Person/People panel. Users can restrict patients by name, by selecting from a list of patients, or by entering a text string. Users can also restrict patient age range and sex. Changes to the Patient/People panel are dynamic queries [24] that update results immediately in the results visualization panel (Figure 4). The number of patients that meet the current patient selection criteria is also displayed in the panel. All double-sliders not only allow adjustments via the mouse, but clicking on the end buttons (or using key strokes to select it) allows for rapid textual entry of precise data values. The temporal pattern panel lies to the right of the Person/People panel, and allows users to chain Events together to form a pattern query. The timeline constraints and the left-to-right layout of Event boxes echoes cultural intuition that time flows in a left to right manner (e.g. Event Box 1 specifies an Event that occurs before the one in Event Box 2). Absolute start and end dates can be specified for the temporal query; by default the absolute dates reflect the maximal TimeSpan of Events in the underlying data set. Event Boxes initially present only the widgets for setting non-temporal attributes. As users select attributes from top to bottom, they define increasingly strict constraints on the types and values of related Events. Pull-down lists contain the labels that define a three level type hierarchy: the Event Type, Event Classification, and Event Name as defined within the underlying data set. By default only a top level Event Type is selected. If users select a specific Event Name, such as Systolic Blood
Figure 2: Pattern query panel. The Person/People panel at the left allows users to specify the types of patients to consider. The white temporal pattern panel on the right allows an arbitrary number of Events and TimeSpans to be defined. This pattern specification is any patient who received increasing dosages of Remeron followed by a heart attack within 180 days (along with the events constituting the temporal pattern match).
Pressure, the values associated with that Event will be made available for further selection and query specificity. Once all three event levels are specified, events with numeric values are presented with a double ended slider that defaults to the complete Event value range, while Events with categorical values are presented with a checkbox for each category. By default no Event boxes are displayed – only an “Add Constraints” widget, which adds a new Event to the right of the chain when clicked. Users can delete Events by selecting the delete button. Also, by default, each Event is assigned a unique color marker, shown as a circular color chip in the Event Box. This allows users to visually map each Event in the results visualization to the associated Event in the pattern definition panel. Users can customize the assigned color by clicking on the color chip. Event Box 2 (Figure 2) is an example of an EventSet, which provides users the ability to define constraints on multiple events of the same type. To define an EventSet, users select the “More >>” tab, which opens to reveal widgets for setting window, cardinality and relative value constraints. Selecting the Span checkbox between two Event Boxes places a time restriction between adjacent Events. The minimum TimeSpan in days is positioned at the upper left of the TimeSpan bar that connects Events, with the maximum span in days positioned at the lower right of the bar. For example, by opening the “More >>” tab a user could easily specify the following query: three blood pressure tests occurring within a one month period, each time the systolic pressure increase by at least 10 points. Another example query is: all patients who were prescribed decreasing dosages of the heart medication Plaxin over a six month period and later had a heart attack. For more details on the types of queries that can be specified and how to specify them in PatternFinder, see Section 4. 3.4 Result Visualization Although others have explored temporal query interfaces, most have ignored the display of the resulting matches. Conversely, medical systems [3, 19] have provided interfaces for browsing temporal patient data, but have rarely provided support for querying patient patterns, nor for comparison of patterns across patients. PatternFinder provides both pattern formulation and result exploration. The lower half of the interface (Figure 4) shows result visualization, designed according to the wellestablished information-seeking mantra: overview first, zoom and filter, then details-on-demand [25]. Although the visualization is not unique, its coupling with the pattern specification panel along with other features described below, make for a powerful combination enabling temporal pattern discovery.
SELECT P.* FROM Person P, Event E1, Event E2, Event E3, Event E4 WHERE P.PID = E1.PID AND P.PID = E2.PID AND P.PID = E3.PID AND P.PID = E4.PID AND E1.type = “Medication” AND E1.class = “Anti Depressant” AND E1.name = “Remeron" AND E2.type = “Medication” AND E2.class = “Anti Depressant” AND E2.name = “Remeron" AND E3.type = “Medication” AND E3.class = “Anti Depressant” AND E3.name = “Remeron" AND E2.value > E1.value AND E3.value >= E2.value AND E2.date > E1.date AND E3.date >= E2.date AND E4.type = “Visit” AND E4.class = “Hospital” AND E4.name = “Emergency" AND E4.value = "Heart Attack" AND E4.date >= E3.date AND 180 =MinValue or