models passed between a Java Servlet based back end and an Adobe Flash and. ActionScript front end. The Flash movie, integrated into a website, enables the.
VUMA: A Visual User Modelling Approach for the Personalisation of Adaptive Systems Melanie B. Sp¨ath and Owen Conlan School of Computer Science and Statistics Trinity College, Dublin, Ireland. {mspaeth, Owen.Conlan}@cs.tcd.ie, http://kdeg.cs.tcd.ie/
Abstract. Current approaches to explicit user modelling are generally time consuming and tedious for the user. Oftentimes poor usability and overly long questionnaires deter the end user from reusing such modelling tools, thus only facilitating explicit personalisation once as they enter the system. This paper proposes a visual approach to user modelling resulting in the VUMA (Visual User Modelling Approach) tool that can be used in a playful and dynamic manner repeatedly during a user’s engagement with a personalisation system. This work proposes and evaluates a visually empowering, usable, highly configurable and playful user modelling interface that is utilised to elicit user interests and preferences in a chosen knowledge domain. Key words: visual user modelling, user profiling, user interface, personalisation
1
Introduction
Appropriate user models are fundamental to the provision of personalisation in Adaptive Systems. A user model contains modelled assumptions that represent the characteristics of the user which have been deemed relevant to the system [5]. The validity of the assumptions is determined by the technique used to acquire the relevant information. Explicit modelling asks the user for information through direct questionnaires and tests [7]. Implicit approaches observe the user’s interaction with the system and analyses the information which they request from a database or repository [6] while they are using it in order to build a user model. Both approaches have their draw-backs and may lead to user frustration. Explicit approaches may involve the user spending a lot of time modelling their interests before using the system. Whereas all implicit approaches are ultimately predicated on intelligent guesses [4] with inaccurate guesses potentially causing frustration. In this paper an approach is proposed that targets the limitations of explicit modelling by designing an intuitive visual user modelling approach, embodied by the VUMA tool, that users can use in a playful manner to specify their interests and preferences. As a proof of concept, the VUMA tool has been adapted to a
sightseeing itinerary planner where the system’s purpose is to assist a tourist in planning their own personalised sightseeing day.
2
Design and Architecture
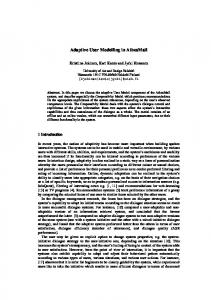
There are many text-based questionnaire approaches to modelling user interests, e.g. [1], but these approaches lack the potential for the user to play with their modelled information, i.e. make speculative changes to their model in order to see what the resulting personalizations might be. Several approaches also utilise concept maps as a means to construct user models, e.g. [2]. These approaches tend to built on ontology and topic map building tools, but do not generally represent, in a visual way, the goal of the modelling. As such, even though the modelling approach is explicit the goal is often implicit. These visual approaches definitely offer more playful potential. Approaches such as VIUM [8] offer the possibility for users to inspect large user models. Again the goal of the user model is implied, but the potential for scrutability is increased. The approach proposed in this paper assumes that the model being produced is centred around a single simple goal and that this goal will provide the focal reference point of the visual design. This design should enable the presentation of multiple options in a manner that allows the user to easily locate the desired information, and should allow the user to dynamically assign an interest and qualitative preferences to these choices in a playful and enjoyable way and should visually and intuitively reflect the choices being taken. Similarly, the limiting constraint, e.g. time, should also be represented visually. The realisation of the Visual User Modelling Approach tool has been achieved through intensive user-centric engagement at several stages of development. As part of VUMA individual items, both specific and abstract are represented as circles. In order to reduce visual clutter and information overload, a hierarchical concept of going from abstract to specific has been employed (Fig. 1a). Specific items can be retrieved through abstract items, i.e. by clicking on the circle that represents an abstract category. This would expand it to display a set of more specific items or sub-categories which could be further expanded and so forth. Abstract and specific items may be visually distinguished by background or colour. The area of the circles serves as an approximation for a constraint, such as money or time, i.e. the bigger the circle, the more of the constraint is available or consumed or desired, depending on the situation (Fig. 1b). The items can be configured to be resizable. The distance of a particular circle from a static reference point is used to represent an interest in that item (Fig. 1c). Once a circle is dragged past a boundary a level of interest will be associated with the item that is inversely proportional to its distance from the reference point, i.e. the nearer the item to the reference point, the higher the interest. Items outside this boundary have an interest of zero. The user can playfully register their interest and preference in any of the available items by dragging items nearer to or farther from the reference point. The reference point was chosen to be in the middle of the visualization, and
(a) Going from General to Specific
(b) Area/Constraint Metaphor
(c) Distance/Preference Metaphor
(d) Reference point and category choice locations on startup
Fig. 1: Visual Concepts and Metaphors
the potential choices are initially placed on an invisible circumference around this central reference point (Fig. 1d). The more items that are pulled towards the central reference point, the more crowded the area becomes, reflecting that more and more of the available constraint is being used up. When two or more circles within the interest boundary touch while one of them is being dragged, the touched circle(s) are pushed out of the way at the same distance from the reference point, or, when the area is too crowded, the least interesting touching item is pushed away from the reference point, thereby reducing its interest level and making space for the dragged incoming circle. The VUMA tool employs a client/server architecture based on XML data models passed between a Java Servlet based back end and an Adobe Flash and ActionScript front end. The Flash movie, integrated into a website, enables the user to manipulate their model in accordance with the visual metaphor described above and the changes are sent to a Java-based planner on the back end. The resultant plan is returned to the front end immediately giving the user feedback. The Google Map API is also employed to generate a Google Map output of the personalised sightseeing itinerary.
3
Use Case and Future Work
When using the VUMA tool a user is initially presented with a view, similar to that seen in Fig. 1d, of the categories of tourist activities such as Museums,
Art, Shopping etc. The user can browse through these categories by clicking on them and expanding them into sub-categories or specific items. They can then assign an interest in a whole category, sub-category or specific item by dragging it towards the reference point. If the user would like to delete an option from his selection, they simply drag the item out of the interest boundary until the connecting interest line breaks. In addition, the user can change the size of the circles to indicate that they would like to allow more or less time for the specific activity. On any change in their interest configuration or time preferences, the planner will update automatically and reschedule the tourist’s itinerary to reflect these changes. Finally, their personalised itinerary will be overlaid on Google Maps. The tourist can tweak and play with the interface to refine their planned day. To date a favourable trial and evaluation of the current tourism oriented prototype has been conducted. In order to provide a comparative evaluation, the VUMA tool is currently being adapted as the user modeling interface to a long-running personalized eLearning course [3]. This will form the basis of a trial that will comparatively analyse both a text-based questionnaire and a visual approach to modelling learner interests.
References 1. Ardissono, L., Goy, A., Petrone, G., Segnan, M., and Torasso, P.:INTRIGUE: Personalized Recommendations of tourist attractions for desktop and handset Devices. In Applied Artificial Intelligence: Special Issue on Artificial Intelligence for Cultural Heritage and Digital Libraries 17(8-9) (2003) 687–714 2. Carmichael, D. J., Kay, J., and Kummerfeld, R. J.: Personal Ontologies for feature selection in Intelligent Environment visualisations. In Baus, J, C Kray and R Porzel, AIMS04 - Artificial Intelligence in Mobile System, pp. 44-51. 3. Conlan, O. and Wade, V.: Evaluation of APeLSAn Adaptive eLearning Service Based on the Multi-Model, Metadata-Driven Approach. Proc. 3rd Intl Conf. Adaptive Hypermedia and Adaptive Web-Based Systems (AH 04), P. de Bra and W. Nejdl, eds. Springer, 2004, pp. 291295. 4. Espinoza F., Hook K.: An Interactive interface to an Adaptive Information System. In Proceedings of the User Modelling for Information on the World Wide Web, a mini-workshop at the Fifth International Conference on User Modelling. (1995) 5. Fink, J., Kobsa, A., Nill, A.: User-Oriented Adaptivity and Adaptability in the AVANTI project. In Designing for the Web: Empirical Studies, Microsoft Usability Group, Redmond (WA), (1996) 6. Kass, R. and Stadnyk, I.: Using User Models to Improve Organizational Information. In Proceedings of the 3rd International Workshop on User Modeling, Dagstuhl, Germany. (1992) 7. Kobsa, A.: User modeling: Recent Work, Prospects and Hazards. In Adaptive User Interfaces: Principles and Practice, M. Schneider-Hufschmidt, T. Khme, and U. Malinowski, (eds.), North-Holland: Amsterdam. (1993) 111–128 8. Uther, J. and Kay, J.: VIUM, a web-based visualisation of large user models. In, proceedings of the ninth international conference on User Modelling (UM2003), Brusilovsky, P. et al. (Eds.), Johnstown, PA, June 2003, pp. 198-202.