for using visualization to support this type of opera- tion have not been ..... 817, pages 202{213. Springer-Verlag, 1994. 3] Jerry Fowler and Willy Zwaenepoel.
Proc. of IEEE International Parallel Processing Symposium (IPPS’95), April 1995, pp. 640-645.
A Visualization-based Environment for Top-down Debugging of Parallel Programs� Joseph L. Sharnowski and Betty H.C. Chengy Department of Computer Science Michigan State University East Lansing, Michigan 48824
Abstract This paper describes a parallel debugging environment that applies visualizations in a top-down, structured approach for debugging. This environment, referred to as GOLD, uses visualizations in the traditional way for examining a program state, but it also extends the use of visualizations in two directions. First, a technique is described for using visualizations to guide the operation of setting a causal distributed breakpoint for a set of processes. Second, a strategy is introduced for coordinating the use of di�erent types of visualizations when examining a program state. 1
Introduction
Visualizations have been shown to be e�ective tools for facilitating parallel debugging [1, 2]. A shortcoming in using visualizations, however, is that guidelines for applying them in a debugging framework currently do not exist. For example, the ability to set a breakpoint distributed across a set of processes is a useful feature of a parallel debugger, yet guidelines for using visualization to support this type of operation have not been established. Instead, visualizations have been typically used by debugging tools solely for examining the state of a program, either at some particular point during the program execution or as the program state changes across time. Even in this case, di�erent types of visualizations are usually applied independently of each other. Previous techniques for the insertion of breakpoints distributed across a group of processes have been predominantly textually-driven. Although several di�erent approaches have been considered [3, 4, 5], graph� This
work is supported in part by the NSF Grants CCR9209873 and CCR-9407318. y Please address all correspondences to this author.
ical support was not included. The use of multiple types of visualizations for revealing di�erent aspects of a program's state has also been considered previously [6, 7]. However, in these cases, the separate types of visualizations were applied on an individual basis. This paper presents a structured, top-down approach for applying visualizations to the task of parallel debugging. The source of an error is initially investigated from a broad scope. As debugging proceeds, the scope narrows, such that the programmer may focus on the source of the error. The top-down procedure for debugging has been incorporated in a prototype debugging environment referred to as the Graphical On-Line Debugger (GOLD). GOLD applies visualizations within its debugging framework in two ways. First, the operations for setting breakpoints are visualization-based, such that graphical support is provided for assisting with these operations. Second, an integrated approach is taken in the application of di�erent types of visualizations for examining a program state, such that the di�erent types of visualizations complement each other. The remainder of this paper is organized as follows. Section 2 presents an overview of the debugging framework supported by GOLD. Section 3 discusses the visualization-based operation for setting a breakpoint distributed across a set of processes. The technique for coordinating the application of di�erent types of visualizations for examining a program state is discussed in Section 4. Conclusions and future work are brie y discussed in Section 5. 2
Overview of GOLD
GOLD is a graphically-based debugger for parallel programs. GOLD supports C message-passing programs written using PVM 3.3 [8] primitives, and has been developed for Sun workstations running either
SunOS 4.1.x or Solaris. In this section, the general structure of GOLD is discussed. GOLD is designed to support a top-down procedure for locating the source of an error. The basis for this procedure is to execute a program repeatedly, each time gathering more information to be used towards identifying the source of an error. The di�culty in using this type of approach for parallel debugging is that any attempt to monitor the behavior of a parallel program may actually change its behavior. In particular, the debugging routines could potentially cause the order of message-passing transactions between processes to change such that the erroneous behavior may be di�cult to reproduce. The basic operation of GOLD is based on a replay strategy. The basis of a replay strategy [9] is to record the communication order between processes during an initial program run. No additional debugging operations are performed during the initial run, thus minimizing the possibility that the erroneous behavior will be concealed. Any additional program runs are guaranteed to be equivalent by forcing the communication to occur in the same order as in the initial run. Since the replay-based operation ensures deterministic reexecution, GOLD has been constructed as an on-line debugger, where debugging operations are performed during the re-executions. A Central Operations Module (COM) is used to control the global activity during the execution of a parallel program. The interface for this module is depicted in Figure 1. Menu items for setting or removing a breakpoint distributed across the set of processes are accessible through the Central Operations Interface (COI). The interface also provides options for controlling the execution of the parallel program, as well as a Status line that indicates the current execution status for the set of processes.
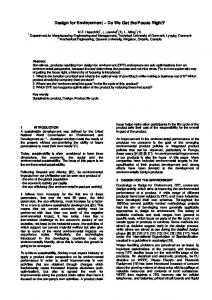
the COM sends an appropriate broadcast message to each of the LOMs. An overview of the architecture for the GOLD debugging environment is shown in Figure 2, where the relationship between the COM and the LOMs is illustrated. LOI (for Process 0) LOM (for Process 0)
Process 0
LOI (for Process 1) COI
LOM (for Process 1)
Process 1
COM
LOI (for Process n−1) LOM (for Process n−1)
Process n−1
= Always active during a GOLD debugging session = Activated on an optional basis by the programmer
Figure 2: The architecture of GOLD A local operations interface (LOI) is supplied for examining the execution of a single process, as shown in Figure 3. Options are provided for controlling the execution of the single process, and various elds indicate the current point of execution and the status of the process. Menu items are also available for setting or removing a local breakpoint, and call graphs and source code listings may be activated to examine the current state of the process.
Figure 1: The central operations interface The execution of individual processes is controlled by Local Operations Modules (LOMs), one per process. These modules communicate with the COM in order to coordinate the execution of the parallel program. For example, in order to initiate the execution,
Figure 3: The local operations interface The LOI for a process is activated as an option by the programmer, such that it remains deactivated by
default. By using this approach, the potential problem of ooding the windowing environment with a large quantity of active interfaces (windows) is avoided. In contrast, however, the COI remains active throughout the debugging session, as it is required for controlling the overall execution of the parallel program.
process is stopped by the causal distributed breakpoint. P
Visualization-based Breakpointing
The task of setting a distributed breakpoint for a set of processes has been considered previously [3, 4]. The novelty of our approach is the use of visualization for supporting the operation of setting a breakpoint. The discussion of distributed breakpoints is presented in two parts, where we rst present background information, and then discuss the visualization-based approach used by GOLD.
3.1 Background Information
The events that occur during the execution of a message-passing parallel program are partially ordered by the \happened before" relation, denoted \!" [10]: 1. If a and b are events in the same process, and b follows a, then a ! b. 2. If a is a send event in one process, and b is the corresponding receive event in another process, then a ! b. 3. If a ! b and b ! c, then a ! c.
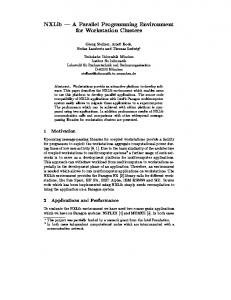
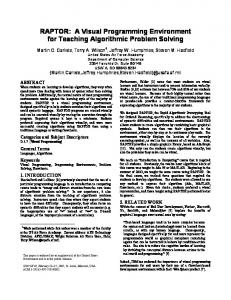
If a 6! b, b 6! a, and a 6= b, then a and b are referred to as concurrent events. The state of a collection of processes that have been stopped is referred to as the breakpoint state. A common technique for stopping the execution of a group of processes is to have a breakpoint located in a single process trigger the operation. We refer to this particular process as the triggering process, and the relevant breakpoint is known as the triggering breakpoint. The strategy we use for stopping the global execution of a group of processes is based on a causal distributed breakpoint [3]. This type of breakpoint is one in which a single process stops at a triggering breakpoint and the remaining processes are stopped at the last event that \happened before" the triggering breakpoint. A causal distributed breakpoint stops each process at the last point that had a causal e�ect on the execution of the triggering process. An example of a causal distributed breakpoint is shown in Figure 4. The triggering breakpoint is located at point \X" of process P , and the dashed line indicates where each
X : Message−passing event
Processes
Q
R
3
h
d
a
f b
g
: Location of breakpoint states
e
c
Time
Figure 4: Example of a causal distributed breakpoint GOLD computes a causal distributed breakpoint by rst executing the initial program run. At the end of the normal execution of the initial run, each process completes a post-processing stage before it terminates, where a dependency vector is recorded for each send and receive event performed by that process. The purpose of a dependency vector is to record the direct causal dependencies that exist at a particular event position. In order to compute a causal distributed breakpoint, however, transitive dependencies must also be considered. The visualization-based operation for setting a causal distributed breakpoint uses an algorithm that was speci cally designed to consider transitive dependencies during the computation of a causal distributed breakpoint [3].
3.2 Using Visualizations to Set Causal Distributed Breakpoints
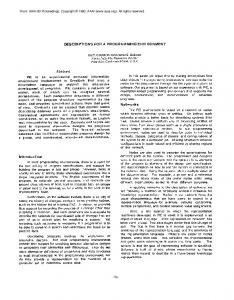
We refer to the operation of setting a breakpoint as the insertion of the breakpoint. The breakpoint menu from the COI (shown in Figure 1) may be used to activate the breakpoint insertion interface shown in Figure 51. A primary component of this interface is the communication graph, referred to as a space-time diagram [10]. A space-time diagram plots processes along one axis and time along the other, where messages are shown as lines between the relevant (process, time) pairs. In this particular case, the displayed communication events are those that were recorded in the replay data during the initial program run. The time of each event is not collected in the replay data, and thus the relative placement of the events in the spacetime diagram is based solely on the \happened before" relation, where the \time" of an event is based on its relative time. The time between a send event and its corresponding receive event is one time unit, and 1 The visualizations shown in Figures 5, 6, 7, and 9 were generated during the execution of a PVM 3.3 program for computing the eigenvalues of symmetric, tridiagonal matrices [11], with the execution occurring on a cluster of nine identical ethernetconnected SUN SPARCstation 10 workstations.
concurrent events are plotted at the same position in time.
point. An additional Remove option is provided for eliminating an inserted breakpoint. Setting causal distributed breakpoints based solely on a visualization of message-passing events may be di�cult, as it depends on the ability to locate relevant message-passing patterns. In order to simplify the task, we o�er an option for generating userde ned marker events when the replay data is captured. Speci cally, the source code may be instrumented with a GOLD-supported system call in appropriate places, where the corresponding events are then collected along with the replay data. When the space-time diagram is rendered, the marker events are depicted using shaded boxes, where di�erent colors are used to distinguish between marker events. For example, Figure 5 shows a case in which a marker event was used to highlight a call to the function sinknode. 4
Figure 5: Interface for causal distributed breakpoints A potential location for a causal distributed breakpoint may be evaluated by selecting an appropriate send or receive event in the space-time diagram. Upon selection of an event, a lled circle is placed at the position of the event to mark it as the location of the triggering breakpoint. The algorithm for computing the causal distributed breakpoint is then executed, where the result of this computation is depicted by placing an empty circle along each of the other process lines at the location of the last event that had a causal e�ect on the execution of the triggering process. For example, in Figure 5, the triggering breakpoint is at a receive event for process 1, and empty circles for depicting the causal dependencies have been drawn accordingly along the other process lines. The selection of an event in the space-time diagram gives the programmer an opportunity to evaluate the causal dependencies for a triggering breakpoint, but does not actually set the causal distributed breakpoint. In order to complete the insertion of the breakpoint, the programmer may select the Insert button. At that time, the COM will communicate with each of the LOMs in order to establish the low-level commands for stopping each process at the appropriate
Coordinated Use of Visualizations
Di�erent types of visualizations each have individual advantages, and so may be applied for di�erent purposes during debugging. In this section, we present guidelines for coordinating the use of di�erent visualizations for examining program states. We rst introduce the di�erent types of visualizations supported by GOLD, and we then discuss how they are applied in a top-down, integrated manner. The initial execution of a program using GOLD is dedicated to the collection of replay data, but the programmer may then run the program any additional number of times in order to examine speci c states. The di�erent visualizations used for examining program states may be categorized into four types. First, a space-time diagram is used to examine communication patterns during a program execution. (Previously, we described how a space-time diagram is used to facilitate the insertion of causal distributed breakpoints.) The space-time diagram used for state examination depicts message-passing events and marker events as they occur. Second, a call graph is used to depict the current location in the execution of a particular process. The function hierarchy is used to graphically represent the location, where the path from the root node to the node representing the current function is highlighted. An example of a call graph is shown in Figure 6, where the current function is cncq. A third type of visualization supported by GOLD is a source code listing. This type of visualization depicts the current location in the execution of a particular process via a listing of the relevant source code,
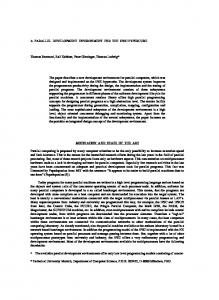
Figure 6: Example of a call graph where the current location is highlighted. Although source code listings have a textual format, as opposed to a graphical format, they are handled as a visualization since their use is consistent with the use of the graphically-based visualizations. Finally, data visualizations are used to inspect the contents of data structures. The values of one- and two-dimensional arrays are depicted graphically, while the values of other types of data structures are printed textually. For the former case, each array is depicted in a separate window. For example, a one-dimensional array is shown in Figure 7. In this case, the array values are plotted as a bar chart, where the length of a bar represents its relative magnitude. The precise value of a particular element may be examined by selecting the corresponding bar. In the case shown in Figure 7, the value of element 20 has just been probed.
The depiction of the space-time diagram used for state examination is handled by the COM. The LOMs notify the COM whenever a message-passing or marker event occurs, such that the space-time diagram may be updated. In contrast, the LOMs handle the rendering of the other three types of visualizations. The information that is contained in call graphs, source code listings, and data visualizations is con ned to a single process, and therefore communication with the COM is unnecessary. The di�erent types of visualizations are applied in a top-down manner for examining a program state. That is, a space-time diagram is used as the top-level visualization, where the application of the other types of visualizations is based on the selection of events from the space-time diagram. Events are selected at a breakpoint state, where the visualizations may be applied according to the hierarchy shown in Figure 8. The programmer is initially given options to activate either a call graph or a source code listing corresponding to the selected event, or to activate an LOI for the process that executed the event. For example, Figure 9 illustrates the popup that appears for selecting between these options, where the program is currently stopped at the causal distributed breakpoint that was illustrated in Figure 5. The LOI may, in turn, be used to activate a call graph or a source code listing. The advantage of activating the LOI in addition to a call graph or a source code listing is that the relevant process may be executed independently of the other processes for examining a sequence of states. Space−time Diagram
BROAD
LOW
Scope
Level of Detail
NARROW
HIGH
Local Operations Interface Call Graph
Source Code Listing
Data Visualization
Figure 8: Hierarchy for examining a breakpoint state
Figure 7: Example of a one-dimensional array
The hierarchy shown in Figure 8 indicates that additional levels of visualizations may be activated based on the selection of items in call graphs and source code listings. If a function node is selected in a call graph, then a source code listing corresponding to that function is displayed. Also, if a variable name is selected from the source code listing, then an appropriate data
References
Figure 9: Options for examining a breakpoint state from a space-time diagram visualization is depicted. The hierarchy for applying visualizations shown in Figure 8 is based on the scope of the di�erent visualizations. As the scope of the visualizations narrows, the level of detail revealed by them increases. For example, space-time diagrams depict global program activity (i.e., a broad scope), but they reveal only a low level of detail regarding the execution of each process. In contrast, a data visualization depicts detailed information regarding the contents of a data structure for a particular process, but its scope is consequently limited to that data structure. Therefore, we coordinate the use of numerous types of visualizations to obtain a top-down approach for the examination of a program state, where the examination initially proceeds from a broad scope, but where the scope narrows as the potential source of an error is investigated. 5
Conclusions and Future Work
This paper has discussed a visualization-based framework for top-down debugging of parallel programs, implemented in the prototype debugging environment GOLD. We have described how GOLD uses visualization techniques in two main ways to support the debugging of parallel programs. First, visualizations have been used to facilitate the operations for setting distributed breakpoints in a parallel program. Second, the use of di�erent types of visualizations for examining a program state is coordinated, such that the visualizations are applied in an integrated manner. Future work will focus on improving the scalability of the GOLD debugging framework. In particular, for executions involving a large number of processes, patterns of communication are di�cult to locate in a space-time diagram. In addition, arrays consisting of a large number of elements are di�cult to examine using the current array visualizations.
[1] Eileen Kraemer and John T. Stasko. The visualization of parallel systems: An overview. J. of Parallel and Distr. Computing, 18:105{117, 1993. [2] Joseph L. Sharnowski and Betty H. C. Cheng. A formal approach to modeling expected behavior in parallel program visualizations. In PARLE '94, Lecture Notes in Computer Science, vol. 817, pages 202{213. Springer-Verlag, 1994. [3] Jerry Fowler and Willy Zwaenepoel. Causal distributed breakpoints. In 10th Intl. Conf. on Distr. Computing Systems, pages 134{141, 1990. [4] Barton P. Miller and Jong-Deok Choi. Breakpoints and halting in distributed programs. In 8th Intl. Conf. on Distr. Computing Systems, pages 316{323, 1988. [5] Dieter Haban and Wolfgang Weigel. Global events and global breakpoints in distributed systems. In 21st Annual Hawaii Intl. Conf. on System Sciences, Volume II, pages 166{175, 1988. [6] Eric Leu and Andr�e Schiper. Execution replay: A mechanism for integrating a visualization tool with a symbolic debugger. In CONPAR 92 VAPPV, Lecture Notes in Computer Science, vol. 634, pages 55{66. Springer-Verlag, 1992.
[7] John May and Francine Berman. Creating views for debugging parallel programs. In Scalable
High-Performance Computing Conference (SHPCC), pages 833{840, 1994.
[8] Al Geist, Adam Beguelin, Jack Dongarra, Weicheng Jiang, Robert Manchek, and Vaidy Sunderam. PVM 3 user's guide and reference manual. Technical Report ORNL/TM-12187, Oak Ridge National Laboratory, May 1994. [9] Thomas J. LeBlanc and John M. MellorCrummey. Debugging parallel programs with instant replay. IEEE Trans. on Computers, C36(4):471{481, April 1987. [10] Leslie Lamport. Time, clocks, and the ordering of events in a distributed system. Communications of the ACM, 21(7):558{565, July 1978. [11] C. Tre�tz, P.K. McKinley, C.C. Huang, T.-Y. Li, and Z. Zeng. Design and performance evaluation of a distributed eigenvalue solver on a workstation cluster. In 14th Intl. Conf. on Distr. Computing Systems, pages 608{615, 1994.