A visualization tool for geographic information of NTP servers Jonatan Schroeder
[email protected]
Project proposal for CPSC533C - Information Visualization, course of the Graduate Program of the Department of Computer Science, University of British Columbia.
1
Domain Description and Related Work
Clock synchronization is an important and complex task in distributed systems. The Network Time Protocol - NTP - is a protocol created to build and maintain the synchronization of computer clocks with the world real time. To do so, the NTP implements a dynamic logical network, presenting characteristics of a peer-to-peer network, which keeps itself self-organized, from the initial insertion of the computers, by means of frequent exchange of messages between peers. The NTP uses the Internet as a communication media for network nodes, and it is the standard protocol for synchronization of computer clocks connected to the Internet [1, 2].
1.1
The NTP Survey
The work presented in [2, 3] conducted a research about the synchronization of Internet hosts under the NTP. This research included data query, collection and analysis from several hundreds of thousands of NTP nodes. Many aspects that define the quality of time-keeping were collected. The results are available for download in [4]. The survey was taken in two rounds. In the first round, a NTP spider requested three kind of data in every NTP host: system information, peer list and monitor list. The peer list was used to continue the research, by adding new servers to be consulted. The NTP spider started on August 30, 2005, querying an initial set of 263 public NTP servers listed on NTP Public Services Project. The collection finished on September 5, in the same year, discovering 1,278,834 unique IP addresses. A second round was conducted to get more reliable data. This run started on September 20, 2005 and finished on September 30, 2005, discovering 11,895 new IP addresses, totaling 1,290,819 addresses. After preliminary analysis, some servers where discarded for insufficient information, and the research ended up with 147,251 complete response.
1.2
Available Data
As mentioned above, data produced by the survey is available in [4]. There are several variables that were collected and are available, but only a small subset of variables is intended to be used; the remaining variables are not described in this proposal. 1
In order to clarify the meaning of some of the variables, some definitions have to be described. The stratum of an NTP server is the level of the server in the NTP server. Servers with stratum 1 obtain time information from a reliable out source, such as an atomic clock. Servers with stratum 2 obtain information from a stratum 1 server, and so on. The source server of an NTP server is the server from which it obtains its time data, while the root server of an NTP server is the corresponding stratum 1 server from which the original time data for the server is obtained. The dispersion of a server is the maximum error to be considered in time data. This dispersion is mostly based on RTT (round-trip time) information between source and destination servers. For each NTP server discovered in the survey, the following variables are available: • server: the NTP server IP address; • proc: text information about the server processor brand and model; • system: text information about the operational system run in the server; • stratum: level of the server in the topology; • rootdelay: calculated delay between server and its root server; • rootdispersion: calculated dispersion between server and its root server; • peer: identification of the server used as a source for time data (upper level in the hierarchy); • jitter: server calculated jitter delay; • stability: quality-related measurement of the server internal clock, i.e. the reliability of the time data in terms of time difference between two consecutive measurements. Each NTP server with a stratum higher than 1 uses information from another NTP servers, and chooses the best data as a source. Each of these data collections in the server is called association. The available data also provides information about the associations for each server. The following variables are available for each association: • srcaddr, dstaddr: the IP address of respectively the source server and the destination server; • stratum: stratum information about the association; • rootdelay: calculated delay between source server and its root server; • rootdispersion: calculated dispersion between source server and its root server; • offset: offset between source and destination servers; • delay: calculated delay between source and destination servers; • dispersion: calculated dispersion between source and destination servers; • jitter: calculated jitter delay between source and destination servers.
2
1.3
Tasks
The papers that addressed the survey showed some results on the overall structure of the NTP network, such as delay overall distribution and distribution per stratum, overall dispersion and jitter. There was no specific information about servers in a specific network, autonomous system or geographic region. In this project I propose a solution to some specific tasks related to provide details on NTP servers in specific geographic or network locations, i.e., servers within a specific region or that belong to a certain network. The solution is proposed to fulfilled the following tasks: • Show an overall visualization of the geographic topology of the NTP network, so that one can have a better understanding on how NTP servers are distributed worldwide; • Find deficient NTP servers, i.e. servers with high delay or dispersion, and identify in these servers, through a detailed view, the reason why these servers have a high delay or dispersion – reasons can vary from high local delay or jitter and accumulated delay on upper level servers to topology issues such as high stratum or bad selection of associations; • Show an overall topology and find deficient NTP servers in a specific geographic region; • Show an overall topology and find deficient NTP servers in a specific IP range or list of ranges;
2
Personal Expertise
I have worked with some research on networking field, but I was not directly involved in this survey. I have worked indirectly helping in the development of the spider used for the survey, as the author of the Master Thesis based on this survey is a personal friend and colleague in both undergrad and grad studies in UFPR, Brazil. The thesis was presented in February this year, while I was still at UFPR, as a lecturer.
3
The Proposed Solution
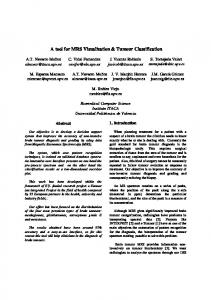
The visualization software proposed in this project will have a main window containing two main areas, as shown in figure 1. The top area will contain a representation of the region in focus as a map. For each subregion contained in the main region (countries in the world or in a continent, states in a country, etc.), a rectangular object will be included. This object will represent both the number of NTP servers contained in that subregion, using size-coding, and the distribution of delay of the servers, using color-coding in a range from yellow (lower delay) to blue (higher delay). The bottom area of the main window will contain a histogram of all servers in the current region. In this histogram, the horizontal axis represents the delay, while the vertical axis represents the number of servers with the corresponding delay range. The horizontal axis will also use a color range corresponding to the same colors used in the geographic visualization, in order to ease the association between relative data in both visualizations. In both areas described above, the use of delay can be replaced by dispersion, stratum or stability. When this option is changed, the horizontal axis of the histogram and the color-coding of the geographic visualization will be changed to represent the corresponding variable. 3
(A)
(B) Figure 1: The proposed visualization main window, showing (A) all NTP servers and (B) servers in Brazil.
4
Subregions of:
United States
Filter:
A*
Alabama Alaska Arizona Arkansas
Cancel
OK
Figure 2: Window for selection of a specific subregion IP range:
200.201.202.0
to
200.201.202.0
/
200.201.202.255
or Network IP:
24
Cancel
OK
Figure 3: Window for selection of an IP range
3.1
Main Window Manipulation
The initial set of nodes used in the software comprehends the entire set of servers in the whole world. The user can select a different set of nodes using one of the following options: • By clicking in a specific subregion (e.g. country, state) on the map, only servers in that specific subregion are selected. The map is zoomed into the subregion, and details are provided to subregions of the selected region. The histogram is changed to refer to the specific region. The same functionality can be obtained through a option in the window menu, in which a list of subregions is given and the user can select the desired subregion, as shown in figure 2. • By clicking in an “UP” option, when a specific region is selected, the selection is changed to the region in which the original region is contained (e.g. if the selected region is statelevel, the selection is changed to country level). The map is zoomed out to the new region, and the histogram is changed properly. • By dragging the mouse over the histogram, the user can filter a range of servers with a specific delay range. The region of the map is not changed, but the information for each subregion is adapted to comprehend only servers with the specified range. The histogram highlights the selected region, while changes the other ranges to gray.
5
Server:
200.201.202.203
OK
Cancel
Figure 4: Window for selection of a specific NTP server Filter:
200.*
200.201.202.203 200.192.135.3 200.111.222.3 200.1.11.111 200.11.22.33 200.101.192.144 200.141.42.43
OK
Cancel
Figure 5: Window for selection of a NTP server from a list of servers • By calling a specific option in the menu, users can filter servers in a specific IP range, through a window similar to the one shown in figure 3. The map is zoomed in or out to the lowest level of region that comprehend all servers in the specified IP range. Map objects and histogram are changed properly. Zoom and pan options are available that do not change the selection of servers. Zoom is available through the mouse wheel, while pan is available to dragging the mouse over the map.
3.2
Detailed View of a Server
There are two kinds of approaches for the visualization of the details for a specific server. The first is focused on users who have the IP address of the server or the DNS name. The second is focused on users who want details about a specific server identified by filtering data using the tools provided above. For users looking for details of a specific previously known server, an option in the main window menu is called, and a small window, shown in figure 4, asking for the identification of the server is shown. After informing the IP address, the detailed view of the specified server is shown, as described below. Someone using the filters described in the previous section may be interested in looking at specific servers identified in the filtering. In this case, the user will click on the specific bar in the histogram that contains the desired servers. Alternatively the user may click on a menu option that selects all servers in the current selection. In both cases, a list of servers that match the criteria similar to the one illustrated in figure 5 is shown, and the user can select the one that should be shown in details. After a specific server is selected, a new window is opened, as shown in figure 6. In this window, the specified server is shown as a node in the bottom middle of the screen. Associations 6
200.1.1.1
200.201.202.1
200.201.202.2
200.201.202.203
200.201.202.3
Root Delay: 50 ms Root Dispersion: 100 ms ...
Figure 6: Window containing the detailed view of an NTP server for the servers are shown as nodes above the server, and the used association is highlighted. The root server is shown in the top of the window. In all nodes, color-coding similar to the one used in the main window is used to show delay. Edges connecting nodes are also colorcoded using the association delay instead of root delay. Additional information is shown in text mode. Color coding can be changed to dispersion, stratum or jitter with or without changing the corresponding coding in the main window. In the detailed view, if another node is clicked, such as the association server or the root server, the detailed view is changed to refer to the selected server.
4
Implementation Approach
The proposed solution will be developed in Java, using Swing library for the visualization [5]. Maps, color and size codings, histograms and node detail informations will be drawn using Java2D drawing methods, while windows requesting information, such as IP ranges, manual country selection or specific NTP server selection, will use Swing default components. Information about geographic location of specific IP addresses will be obtained using GeoLiteCity [6]. This tool has location information about IP ranges in the levels of countries, states and cities. The free version of this tool provides 98% accuracy at the country level, and more than 70% accuracy at the city level for hosts in the United States, with similar accuracy in some other countries. Maps used in the geographic visualization will be drawn using Java2D polygons, based on geographic boundary data available in specialized sites, such as [7, 8]. These data provide country and state-level boundaries in terms of longitude and latitude of each point of the polygon that describes a region. These latitude and longitude points are then converted to a specific location on screen and drawn as Java2D polygons.
7
5
Milestones
The following steps should be followed towards the completion of the project. Each step is followed by an estimate completion date. Development of the basic geographic framework, map drawing, zoom, pan Oct 31 and basic animation Implementation of a module for filtering IP by location, based on GeoNov 4 LiteCity Organization of NTP data and implementation of the association between Nov 7 servers and locations Implementation of country based size and color coding for NTP servers data Nov 14 over the geographic framework Implementation of the delay/dispersion histogram Nov 21 Implementation of the detailed view for a specific server Nov 28 Implementation of server list linking histogram and detailed view Dec 1 Implementation of specific data filters, such as IP range and manual country Dec 5 selection Final presentation and report Dec 12
References [1] David L. Mills. Internet time synchronization: The network time protocol. In Zhonghua Yang and T. Anthony Marsland (Eds.), Global States and Time in Distributed Systems, IEEE Computer Society Press. 1994. [2] Pedro R. Torres Jr. Caracteriza¸c˜ao da Rede de Sincroniza¸c˜ao na Internet. Master’s thesis, Universidade Federal do Paran´a - UFPR, Curitiba, February 2007. [3] Cristina D. Murta, Pedro R. Torres Jr., and P. Mohapatra. Characterizing quality of time and topology in a time synchronization network. In 49th IEEE Global Telecommunications Conference, IEEE GLOBECOM, San Francisco, CA, November 2006. [4] Pedro R. Torres Jr. and Cristina D. Murta. NTP Survey 2005. http://www.ntpsurvey. arauc.br. [5] Java Technology. http://java.sun.com. [6] MaxMind LLC. GeoLite City. http://www.maxmind.com/app/geolitecity. [7] Royal Botanic Gardens, Kew. TDWG World Geographical Scheme for Recording Plant Distributions. http://www.kew.org/gis/tdwg/. [8] Biodiversity Information Standards (TDWG). TDWG Homepage. http://www.tdwg.org.
8