Environmental Modelling & Software 62 (2014) 221e229
Contents lists available at ScienceDirect
Environmental Modelling & Software journal homepage: www.elsevier.com/locate/envsoft
A visualization tool to support decision making in environmental and biological planning ~ ach a, *, Mark McKelvy a, Craig Conzelmann b, Kevin Suir b Stephanie S. Roman a b
U.S. Geological Survey, Southeast Ecological Science Center, 3205 College Ave., Fort Lauderdale, FL 33314, USA U.S. Geological Survey, National Wetlands Research Center, 700 Cajundome Blvd., Lafayette, LA 70506, USA
a r t i c l e i n f o
a b s t r a c t
Article history: Received 18 February 2014 Received in revised form 18 August 2014 Accepted 10 September 2014 Available online
Large-scale ecosystem management involves consideration of many factors for informed decision making. The EverVIEW Data Viewer is a cross-platform desktop decision support tool to help decision makers compare simulation model outputs from competing plans for restoring Florida's Greater Everglades. The integration of NetCDF metadata conventions into EverVIEW allows end-users from multiple institutions within and beyond the Everglades restoration community to share information and tools. Our development process incorporates continuous interaction with targeted end-users for increased likelihood of adoption. One of EverVIEW's signature features is side-by-side map panels, which can be used to simultaneously compare species or habitat impacts from alternative restoration plans. Other features include examination of potential restoration plan impacts across multiple geographic or tabular displays, and animation through time. As a result of an iterative, standards-driven approach, EverVIEW is relevant to large-scale planning beyond Florida, and is used in multiple biological planning efforts in the United States. Published by Elsevier Ltd. This is an open access article under the CC BY-NC-ND license (http:// creativecommons.org/licenses/by-nc-nd/3.0/).
Keywords: Everglades NetCDF Data visualization Decision support tool
Software availability The EverVIEW Data Viewer is freely-available for Windows, Mac OS X, and Linux operating systems from the Joint Ecosystem Modeling (JEM) website: http://jem.gov. Also available on the JEM website are the CERP NetCDF metadata conventions and supporting Java NetCDF libraries. All desktop applications require the Java Runtime Environment. Users wanting to stay informed of software updates and releases can sign up to the email distribution list on the website.
1. Introduction The development of decision support tools (DST) and decision support systems (DSS) has been ongoing for several decades to help with the structuring of problems and decision making in a complex natural world (Rizzoli and Young, 1997). Decision theory calls for
* Corresponding author. U.S. Geological Survey, Southeast Ecological Science Center, 3205 College Ave., Davie, FL 33314, USA. Tel.: þ1 754 264 6060. ~ ach),
[email protected] E-mail addresses:
[email protected] (S.S. Roman (M. McKelvy),
[email protected] (C. Conzelmann),
[email protected] (K. Suir).
the identification of objectives before developing and evaluating alternative plans of action (Keeney, 1992). Decision analysis, when applied, includes optimization routines to provide best solutions against specified objectives. Decision support does not necessarily provide optimization for best solutions but can provide means to organize, display, and manipulate information used in decision making (Diez and McIntosh, 2011). Regardless of its form, an effective DST or DSS should be tailored to the decision problem (Sojda et al., 2012) and developed for and with targeted end-users (Lautenbach et al., 2009). Florida's Greater Everglades (hereafter “Everglades”), a broad wetland ecosystem of national and international importance, has a history of more than a century of human intervention (Davis and Ogden, 1994). In the early 1970s, concern rose within the scientific community over deteriorating environmental conditions as a result of such intervention (Chimney and Goforth, 2001). By the 1990s, planning was underway to remove almost 400 km of levees and canals, and return the 28,000 km2 wetland ecosystem to its natural state (Gunderson et al., 1995). This ongoing restoration effort is expected to continue for decades and cost billions of dollars (National Research Council, 2008). Water patterns and their effect on habitat are a major driving force in Everglades restoration. To aid in selection for
http://dx.doi.org/10.1016/j.envsoft.2014.09.008 1364-8152/Published by Elsevier Ltd. This is an open access article under the CC BY-NC-ND license (http://creativecommons.org/licenses/by-nc-nd/3.0/).
~ ach et al. / Environmental Modelling & Software 62 (2014) 221e229 S.S. Roman
222
implementation among alternative restoration plans, scientists have collected data on the Everglades ecosystem and developed ecological models to forecast potential impacts of restoration on ~ ach et al., species of interest (e.g., DeAngelis et al., 1998; Roman 2011). Running these models against hydrologic patterns that represent alternative restoration plans allows decision makers to explore the impacts restoration plans might have on important components of the ecosystem. As more data are collected and more models are developed, a subsequent challenge has emerged to effectively use the vast amount of available information in the plan selection process. In response to the need to compare alternative restoration plans against restoration objectives, natural resource managers and decision makers from various agencies (e.g., South Florida Water Management District, US Fish and Wildlife Service, National Park Service) in the Everglades became interested in the development of a DST that would allow them to evaluate the potential effects of plan implementation. Specifically, interest was expressed in the ability to view and interrogate ecological simulation model outputs on a user's personal computer. In the past, where visualizations of model outputs were available, they were often in the form of static maps which illustrated results for one species at a single point in time. Decision makers found this format to be ineffective, resulting in a limited understanding of the impacts a proposed restoration plan might have over a spatially and temporally dynamic wetland with a suite of restoration objectives. Several factors impeded the adoption of existing software as a common DST for the Everglades community. By the late 2000s, many modelers in the Everglades had begun using the Network Common Data Form (NetCDF) (Rew and Davis, 1990) file type for their model output. At the time, several visualization applications and frameworks existed (e.g. Unidata Integrated Data Viewer [Murray et al., 2003], GRASS GIS [Neteler and Mitasova, 2008], uDig [Ramsey, 2006], and Ncvtk [Pletzer et al., 2005]) that fully supported NetCDF, and others (e.g. ArcGIS, ParaView, MATLAB) only partially supported NetCDF through supplementary converters, or were too technical for most users. None of these tools, however, enabled accurate comparison of ecological and hydrologic model outputs produced from alternative restoration plans. Additionally, no existing software was available to be rapidly developed and iteratively updated in response to active end-user feedback. Finally, the lack of formal agreement over NetCDF metadata conventions hindered collaboration among scientists and presented another barrier to widespread acceptance of a common DST. 1.1. The role of EverVIEW The EverVIEW Data Viewer (hereafter “EverVIEW”) was developed as a DST to aid restoration planners in evaluating alternative restoration plans. Many organizations (such as federal and state agencies, local municipalities, and universities) and individuals have been involved in Everglades restoration planning. A subset of individuals, including scientists and decision makers, developed a set of ecological objectives that define a restored Everglades (Doren et al., 2009). Performance metrics were assigned to those objectives
to allow decision makers to evaluate restoration success. In keeping with decision theory, alternative restoration plans were designed to help achieve restoration objectives (Keeney, 1992). Ecological models were developed by agency and university scientists to help illustrate the potential consequences of each restoration plan. EverVIEW is designed to minimize the challenges associated with adoption of a common Everglades DST by enabling decision makers to visualize model outputs and consequences of alternative restoration plans, and to select a plan that best meets restoration objectives (Fig. 1). The software helps bridge the information gap between ecological modelers and restoration planners (see Liu et al., 2008; Thackway et al., 2013; Matzek et al., 2014) by enabling model output from widely varied sources to be readily consumed and made available for evaluation of alternative plans in the decision making process. The modular architecture underlying EverVIEW enables rapid feature development based on end-user feedback. Support in EverVIEW for community-adopted NetCDF metadata conventions ensures consistent visualization output for end-users and reinforces community adherence to conventions. This paper explores the success of EverVIEW as a DST, its core features, limitations, and examples of use in the context of Everglades restoration planning. 2. Development and features of EverVIEW EverVIEW is a cross-platform desktop application that helps decision makers easily compare output from ecological and hydrologic models (as ecological model inputs) on their own computers (Joint Ecosystem Modeling, 2009). As a DST, EverVIEW has features that enhance and improve the decision-making process while leaving decisions to the informed end-user. 2.1. Challenges and development cycle In a position paper by McIntosh et al. (2011), the authors provide a list of challenges and recommendations for the development of a successful Environmental Decision Support System (EDSS). Their recommendations come from challenges related to (1) engagement of end-users and stakeholders, (2) adoption and use of the EDSS, (3) cost and technology related to making the EDSS sustainable in the long-term, and (4) evaluation and measures of success of the EDSS. These same challenges apply to the development of a DST like EverVIEW. One of the most critical tasks in successful DST or DSS development is ensuring use by targeted end-users (Lautenbach et al., 2009; McIntosh et al., 2011). Identification of potential end-users for an Everglades DST was relatively straightforward because many agencies and individuals in the Everglades modeling community had similar needs. Furthermore, the prior development and subsequent adoption of the Comprehensive Everglades Restoration Plan (CERP) NetCDF metadata conventions highlighted the need within this community for tools which facilitated deeper comparison of alternative plans and easier communication of findings to restoration decision makers. The exact functional specifications for the proposed DST (now known as EverVIEW) were not readily
Fig. 1. EverVIEW is used as a DST to evaluate performance of alternative restoration plans and guide the decision process. Figure adapted from Keeney (1992), Fig. 6.1.
~ ach et al. / Environmental Modelling & Software 62 (2014) 221e229 S.S. Roman
223
apparent to developers, as it was unclear exactly which aspects of available data were most critical to Everglades restoration planning. Thus, engagement with targeted end-users became a necessary component early in the development of EverVIEW to understand the decision problem and how the DST would be used (Volk et al., 2010). In advance of the development of EverVIEW, a series of inperson meetings were held with ecological simulation model developers from the various agencies involved in restoration (e.g., National Park Service, U.S. Fish and Wildlife Service, South Florida Water Management District) who wanted a tool to present their model outputs, and with decision makers who wanted to examine model outputs on their desktops. In meetings with targeted end-users, several foundational functions were repeatedly described as high priority. These functions include performing spatial and temporal comparisons among data sets; identifying and operating within a region of interest; controlling visual and numerical parameters of data presentation, such as legend colors and data ranges; and facilitating easy collaboration, such as sharing data sets, views, color ramps, and map layouts with others. While these are not the only features available to EverVIEW end-users, they are considered the core of the DST. The implementation of EverVIEW uses a cycle of engagedevelop-repeat to efficiently prototype and test elements of the software while supporting the needs of a diverse user community. After the initial meetings, developers began work on a prototype, implementing a subset of the functionality that was identified. Once the prototype was complete, further end-user engagement and testing occurred to advance the discussion about future development, which in turn drove the direction of the next prototype. This cycle of engage-develop-repeat offers several benefits to both developers and end-users (Fig. 2). First, consistent and repeated engagement promotes investment and feedback from the end-user community. Second, iterative and incremental development cycles encourage the use of modular software architecture principles to support rapid development and reuse of program code, resulting in a highly structured, flexible and maintainable code base. This architecture also made EverVIEW more easily adaptable to changing user requirements and novel use, positioning the DST for future growth and continued funding from a wider range of organizations. Third, frequent communication with the end-user community minimizes the chance of wasted effort for overly complex or unused features. 2.2. Software design EverVIEW is a software platform that combines off-the-shelf frameworks and libraries with in-house development that integrates them and extends their functionality. The Eclipse Rich Client Platform (McAffer and Jean-Michel, 2005), which forms the basis for the EverVIEW application, makes it possible for plug-ins from multiple providers to be linked together to form a single application and adds automatic software update functionality. The NASA World Wind Standard Development Kit (NASA, 2007) provides EverVIEW a 3D globe to display spatially-accurate image overlays created from modeling data. Several other libraries enable EverVIEW to read grid cell values from NetCDF files, display a spreadsheet-style table control for inspection of cell values, and draw time-series charts for certain locations over time. The architecture of EverVIEW is structured according to the Model-View-Presenter (MVP) software pattern. This pattern introduces a separation of concerns between the user-facing visual components, the model state, and the logic that processes user events and performs validation and numerical computation (Potel, 1996). The code structure suggested by the pattern results in lower
Fig. 2. The development cycle of EverVIEW frequently involves the feedback of its enduser and stakeholder communities. Once a decision problem is identified, an implementation plan is designed and new features are added to the software. Revisions to the plan are incorporated into the development cycle to promote flexibility in responding to unfolding requirements.
coupling between independent components of EverVIEW, which affords the flexibility to accommodate changing end-user requirements and the addition of new features. Input is accepted primarily in the form of one or more NetCDF files that adhere to the CERP NetCDF metadata conventions (Joint Ecosystem Modeling, 2010, 2012), which are a subset of the widely-used Climate and Forecast metadata conventions (Eaton et al., 2003). 2.3. Software features EverVIEW empowers decision makers with spatial and temporal comparison features to assess multiple scenario outputs and rapidly identify where scenarios agree or disagree across a region of
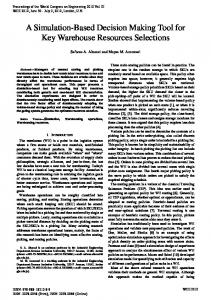
224 ~ ach et al. / Environmental Modelling & Software 62 (2014) 221e229 S.S. Roman Fig. 3. EverVIEW configured with four spatially synchronized globes, each with the same data set and polygon identify object. Top left and bottom right globe views show the same region at different points in time. Top right shows a chart view. At bottom left, a table view shows output color coded to match the globe view, with gray cells highlighting the data cells inside the polygon identify object.
~ ach et al. / Environmental Modelling & Software 62 (2014) 221e229 S.S. Roman
interest. Side-by-side displays of input data on 3D globes give scientists and model developers the freedom to explore modeling inputs alongside the resulting outputs, allowing for a smoother research and development period. Users can view data on as many as four globes on one screen (Fig. 3), with a maximum of eight active globes split across two, tabbed pages. The spatial and temporal synchronization features “lock,” or synchronize, multiple globes on a specific region or date. When globes are spatially locked, a user pans or zooms into a particular region of interest and all other open globes move synchronously. The temporal lock feature allows a user to select a date, and all globes will synchronize to that or the closest possible date in the corresponding data set. Identify objects offer the capability in EverVIEW to define points, multi-points, multi-lines, and polygons to track the values of data cells across time. Each identify object can be given a custom name for ease of identification and, depending on the type, calculate basic statistics such as the coverage area and the average, minimum, or maximum value of the identified cells. Identify objects can either be drawn by users directly on a globe for one-time use, or imported (and exported) via ESRI shapefile, KML, or an EverVIEW-specific XML format for repeated use when examining multiple model outputs (Fig. 3). Enabling spatial synchronization copies identify objects created in one globe section to every other synchronized globe section, helping users keep track of the same area of interest across data sets (Fig. 3). Users may then select to step through time with temporal synchronization, or to calculate statistics (e.g., average population size or habitat suitability score) within a polygon displayed on synchronized globes, facilitating comparison among species outcomes for alternative restoration plans. EverVIEW takes a hybrid approach to data display by offering side-by-side globe and table views. In many cases, users may want to see not only the visual display of model output on a globe, but also the numerical values from which the display was produced. Table view enables users to see the values in a coordinate-based grid format that matches color-coded cells to the colors used in the globe view (Fig. 3). EverVIEW promotes collaboration through consistent visualization across user sessions and among multiple users. State configuration files enable users to save information about the current setup of EverVIEW, including paths to currently loaded data sets, globe synchronization choices, identify objects, and color ramps in a simple text file. These files can be used by EverVIEW to quickly reload a previous configuration, and can be easily transmitted among collaborators using email or any other file transfer mechanism. Multiple users who load the same state configuration file in EverVIEW will see an identical representation of data, reducing the chance for confusion when users are not looking at the same display. 3. Results from EverVIEW use Previous work shows that one of the keys to end-user adoption is to develop a DST that makes it easier for end-users to complete tasks they are already required to do as part of their jobs (Rauscher, 1999). The primary utility of EverVIEW in Everglades restoration and other planning projects is to allow side-by-side comparisons of competing restoration project configurations, a task that restoration teams perform routinely to help them select among restoration plans. 3.1. Everglades planning and restoration Prior to the development of EverVIEW, the reliance on paper maps to investigate alternative restoration plans often caused
225
unnecessary conflict due to errors in visual interpretation. Static maps were placed side-by-side on tables at meetings for stakeholders and decision makers to examine and discuss. Team members were asked to visually compare, for example, a wet year, a dry year, and an average year for each of four competing plans. These visual comparisons were repeated for many ecosystem components, such as simulation model results for water depth, water flow pattern, soil oxidation, probability of wildfire, and more. Features of EverVIEW that were developed to aid in restoration planning led to intense use during the Central Everglades Planning Project (CEPP). The CEPP (led jointly by the U.S. Army Corps of Engineers and the State of Florida's South Florida Water Management District) was designed to select the next round of restoration projects. To determine which projects to select, CEPP decision makers chose seven ecological forecasting models to use as planning tools in the process. EverVIEW allowed for evaluation of these model outputs and comparison of outputs side-by-side for examination of impacts on multiple species at once. The spatial and temporal synchronization features in EverVIEW allowed consistent comparison of competing restoration plans by stepping through and animating dates to examine how species of interest might respond under given conditions. Decision makers also examined predicted habitat responses between different times of year (e.g., wet vs. dry seasons). In the Everglades, decision makers are often interested in what might happen in areas of particular concern (e.g., the area surrounding a structure that impedes water flow which is proposed to be removed). By using “identify objects,” end-users exploring simulation model output are able to focus on an area of proposed structural removal to evaluate whether expected improvements in species population numbers or habitat quality may be realized. Tracking changes in model output in a defined area of interest can aid not only decision making, but also validation and verification of model output. For example, an ecological modeler in the Everglades may have interest in examining current water depth data on a daily basis as part of a model verification process. EverVIEW allows a shapefile of known water management area polygons to be imported, so the modeler can quickly load these polygons and calculate simulated water depths for the same areas each day, without needing to re-draw each polygon by hand (Fig. 4). EverVIEW's color ramp customization features have allowed decision makers to view model outputs in consistent and familiar color schemes. Decision makers in the Everglades selected the “stoplight” format of presenting aggregated results as a universally understood method of communicating the status of ecological health; green represents “good” values, yellow represents areas that “need attention”, and red represents “serious problems” (Doren et al., 2009). Ranges of values for each color class differ among species and desired outcomes, as determined by subject matter experts. Once value ranges are assigned for each “stoplight” color class, an EverVIEW user can create a color ramp to visualize model output in these ranges. Colors can be compared across species and geographic areas to illustrate how well or poorly species are doing across the landscape. EverVIEW color ramps can be saved and shared enabling a consistent representation of data and quick identification spatial regions with “good” or “poor” suitability values. When the stoplight color scheme is combined with the table viewer, the end-user is able to see, for example, the values for particular green and yellow color-coded cells corresponding to habitat scores of 0.71 for a green cell and 0.69 for a yellow cell, helping reach more informed conclusions when evaluating model output. EverVIEW allows decision makers to easily visualize where alternative plans differ through the creation of difference maps (Fig. 5). Output cell values from one potential restoration plan are
226
~ ach et al. / Environmental Modelling & Software 62 (2014) 221e229 S.S. Roman
Fig. 4. EverVIEW displaying place names read in from a shapefile.
subtracted from the corresponding output cell values in another restoration plan, yielding a data set that shows not only where differences occur between the two model outputs, but to what degree they differ. Everglades restoration teams were able to quickly see where one plan might provide better results compared to another.
3.2. Coastal Louisiana modeling and planning These capabilities of producing difference maps and tracking values through time were extremely helpful during the Mechanical and Technical Review of modeling inputs and outputs for Louisiana's Comprehensive Master Plan for a Sustainable Coast. Louisiana's 2012 Coastal Master Plan was a State-led effort by the Coastal Protection and Restoration Authority (CPRA) of coast-wide risk reduction and restoration projects with goals ranging from hurricane protection and reducing economic losses from flooding, to providing habitats suitable for a variety of commercial and recreational activities (Coastal Protection and Restoration Authority of Louisiana (2012)). EverVIEW's core features, including side-byside comparison and the ability to isolate specific data cells with identify objects, were extensively used by CPRA personnel in reviewing large volumes of eco-hydrology, wetland morphology, trophic level, and ecosystem service model outputs. Difference maps were often created to determine the impact of a project on land gain or loss and flood risk reduction across multiple projected climate scenarios, for example, or to measure the change in a species' habitat suitability over 50 years. Because most model outputs were produced as, or easily converted to, CERP NetCDF metadata conventions-compliant NetCDF files, the State benefitted
from the extensive visualization framework of EverVIEW to quickly and easily assess those data. 3.3. Conservation practices in Mississippi Another project that benefited from EverVIEW use is the Conservation Effects Assessment Project (CEAP), a national initiative from the USDA's National Resources Conservation Service. CEAP aimed to better understand how conservation practices and programs affect environmental quality and to broaden the role of science in agricultural landscape management. The EverVIEW platform was used by CEAP modelers to analyze total carbon and forest age data for vegetation samples along the Mississippi River Alluvial Valley. Decision makers used side-by-side, synchronized globe views to visualize the relationship between forest age and total carbon through time, and identify objects to track the degree to which forest age contributed to total carbon in specific areas. 4. Discussion In the Everglades restoration planning community, EverVIEW has met decision support needs to evaluate alternative restoration plans and assess impacts on key species. Everglades restoration includes multiple participating agencies and institutions and requires a collaborative environment to achieve success. Adoption of the NetCDF file type and the CERP NetCDF metadata conventions have empowered modelers and decision makers alike to create and share data in a standard format. Working from these standards, EverVIEW gives end-users the ability to visualize any compliant data set at their disposal. By providing ongoing feedback into the
~ ach et al. / Environmental Modelling & Software 62 (2014) 221e229 S.S. Roman
Fig. 5. A difference map (right panel) shows the resulting values from data in the bottom left panel being subtracted from data in the top left panel.
227
228
~ ach et al. / Environmental Modelling & Software 62 (2014) 221e229 S.S. Roman
iterative development of EverVIEW, end-users benefit from the addition of those decision-support features they need most (Fig. 2). 4.1. Assessing success The success of EverVIEW in its role as a DST for Everglades restoration planning is empirically evidenced by its use in the decision making process, its continued use by modelers and decision makers in related projects, and its adoption for similar restoration needs in other geographical regions (Goeller, 1988; McIntosh et al., 2011). Quantifying success in DST use can be challenging and is complicated by the imprecise nature of measuring the influence of information in a decision making process, as well as the long-term nature of change induced by these decisions (McIntosh et al., 2011). To address this challenge, McIntosh et al. (2011) offer a set of criteria for performing a more concrete evaluation of a DST, divided into three roles: (1) policy and management decision making support, (2) science and engineering analysis support, and (3) software capacities. An evaluation of EverVIEW against these criteria points to success in all three roles. EverVIEW supports policy and management decision making in terms of analysis (performance and presentation of results), application (how the tool is being used), and outcome (the impact on decision making). With respect to analysis, the visual representation of modeling results across space and time is understandable to end-users, as is the familiar grid-like representation of the numerical values underlying the visual representation. Endusers are supported in performing analyses with EverVIEW through a set of user-requested features to customize visualization parameters, an extensive built-in help system, and open communication between end-users and developers. Though EverVIEW does not make recommendations to the end-user about which of several restoration plans is optimal, the ability to view data sets in a side-by-side configuration and to perform basic statistical calculations on the underlying values helps end-users select a plan that best meets their objectives. Application success is evident in the continued use and funding of EverVIEW, in the Everglades and elsewhere, for both modeling and restoration planning efforts. Although exact numbers of endusers using EverVIEW are not tracked, continual interactions with end-users both in and beyond the Everglades indicate consistent use and a widening end-user base over time. Indirect measurements of use include just over 6500 unique visitors in the past year to the website where EverVIEW is available for download (http:// jem.gov); and over 10,000 hits in the past four years to the dedicated update site for EverVIEW, which is contacted automatically when the software starts up. EverVIEW has proven useful not only for decision making, but also for science and engineering analyses. The visual representation of data in a spatial context provides the means for end-users to fairly quickly evaluate whether model outputs conform to expectations and identify problems in model logic. End-users can also load input data sets alongside outputs to validate model results through visual inspection or statistical analyses. EverVIEW does not contain functionality to run simulation models, only to visualize modeling data, and so it does not directly address uncertainty in model results. If uncertainty outputs are available, however, then they can be evaluated alongside other data as part of the decision making process. In terms of underlying software capacities, EverVIEW clearly meets the criteria for success established by McIntosh et al. (2011). Because of its modular architecture and generalizable feature design, along with thorough help documentation, the foundational functions of EverVIEW are transferable to a large array of applications and decision making contexts. These reasons also account for
the extensibility and maintainability of the software, supporting rapid adaptation to change or novel feature requests. A built-in software update system ensures end-users have access to the latest bug fixes and feature additions whenever an internet connection is available. Although EverVIEW can be ranked as successful in all three roles defined above, these criteria are regularly reevaluated in conjunction with end-user engagement to ensure best success for future use. 4.2. Limitations While EverVIEW provides a rich visualization and analysis environment, it is merely a link in the decision making chain and cannot produce explanations for the model results. Beyond compelling and easy-to-understand visualizations, some decision makers want the software to provide interpretation or an optimal solution, such as a preferred restoration plan. Although EverVIEW visualizations provide greater understanding of the consequences of selecting a particular plan, there is too much other contextual information relevant to decision making of which EverVIEW is unaware. Ecological model results are intended to guide decision making, not to provide answers about which plan may be the best considering a number of species and variety of conditions. As such, EverVIEW does not offer any specific decision making capabilities, leaving the informed end-user to interpret the visualized outputs. Even though EverVIEW includes many features focused on informing the decision making process, it does not meet the needs of all end-users. Some end-users have indicated that layering multiple data sets atop one another helps to identify areas which may not stand out when viewed as independent layers. For example, the layering of output from several species habitat suitability models could bring focus to regions shared by the different models where high or low quality habitat exists, which could in turn result in focusing resources to the regions in question. Other end-users want to examine tabular output on their desktops and use more traditional approaches such as calculating averages or maximum and minimum values across an entire data set. Although these capabilities are not yet found in EverVIEW, the software relies on a framework that supports the development of these kinds of extensions in the future. Many ecological modelers use data formats other than NetCDF, and certain modeling processes ignore spatial context or produce data without a spatial context. EverVIEW was developed to address the problem of visualizing complex time-series data in a spatial context and, therefore, cannot currently interact with data sets that do not contain the necessary metadata. This limitation is not arduous, however, as the CERP NetCDF library offers the tools necessary to develop programs that convert data into a CERPcompliant NetCDF file and add spatial context. 4.3. Solutions to business and cost challenges As development of EverVIEW has progressed and its end-user community expanded, the development team has often dealt with competing concerns: how to efficiently deliver requested features to new stakeholders while ensuring sufficient generality to the broader end-user community. Balancing these concerns not only helps to engender goodwill from new and existing partners, but also creates funding opportunities to support ongoing development of EverVIEW. Mutual agreement over software structure and priorities bolsters team cohesion and minimizes one of the many challenges in building and maintaining a DST. Development of EverVIEW continues with multiple projects supported by external agencies (e.g., for use in Louisiana's 2017 Coastal Master Plan).
~ ach et al. / Environmental Modelling & Software 62 (2014) 221e229 S.S. Roman
5. Conclusions As EverVIEW has gradually matured into a stable and reliable platform, its development has naturally slowed from rapid prototyping to more modest and incremental changes in keeping with the suggestions of McIntosh et al. (2011). To sustain interest in the future growth and use of EverVIEW, the development team organizes periodic meetings with organizations using the software. These meetings offer end-users a way to learn about new features and to provide feedback or suggestions. Additionally, end-users are presented with a consistent point of contact on the website where EverVIEW is made available for download. Because EverVIEW helps end-users influence the decision making process in the Everglades, they remain engaged in the discussion of the trajectory of the software development effort (Twery et al., 2005). Future development of EverVIEW will focus on continuing to close the gap between restoration science and decision making by addressing the needs of the end-user community and improving the end-user experience. One concern is the development and public release of an application programming interface (API) that will permit end-users to tap into the extensible framework of EverVIEW. Using this API, community members will be able to develop and share programs that extend the features of EverVIEW. Several extensions will be integrated into EverVIEW, adding features such as data conversion and advanced charting capabilities. End-user engagement, community growth, and decision theory principles will continue to drive the direction of EverVIEW's development as a DST for use both in and beyond the Everglades. Acknowledgments Major funding for software development was provided by U.S. Geological Survey's Greater Everglades Priority Ecosystem Science. Use of trade, product, or firm names does not imply endorsement by the US Government. We are grateful to three, anonymous reviewers whose thoughtful comments have improved this manuscript. References Chimney, M.J., Goforth, G., 2001. Environmental impacts to the Everglades ecosystem: a historical perspective and restoration strategies. Water Sci. Technol. 44, 93e100. Coastal Protection and Restoration Authority of Louisiana, 2012. Louisiana's Comprehensive Master Plan for a Sustainable Coast. Coastal Protection and Restoration Authority of Louisiana, Baton Rouge, LA. Davis, S., Ogden, J.C., 1994. Everglades: the Ecosystem and its Restoration. St. Lucie Press, Delray Beach, FL, 826 pp. DeAngelis, D.L., Gross, L.J., Huston, M.A., Wolff, W.F., Fleming, D.M., Comiskey, E.J., Sylvester, S., 1998. Landscape modeling for everglades ecosystem restoration. Ecosystems 1, 64e75. Diez, E., McIntosh, B.S., 2011. Organisational drivers for, constraints on and impacts of decision and information support tool use in desertification policy and management. Environ. Model. Softw. 26 (3), 317e327. Doren, R.F., Trexler, J., Gottleib, A., Harwell, M., 2009. Ecological indicators for system-wide assessment of the greater everglades ecosystem restoration program. Ecol. Indic. 9, S2eS16. Eaton, B., Gregory, J., Drach, B., Taylor, K., Hankin, S., 2003. NetCDF Climate and Forecast (CF) Metadata Conventions. http://helene.llnl.gov/cf/documents/cfconventions/1.0/cf-conventions-multi.html (last accessed 08.08.14.). Goeller, B.F., 1988. A Framework for Evaluating Success in Systems Analysis (No. RAND/P-7454). RAND CORP, Santa Monica CA.
229
Gunderson, L.H., Light, S.S., Holling, C.S., 1995. Lessons from the Everglades. BioScience S66eS73. Joint Ecosystem Modeling, 2009. EverVIEW Data Viewer. Available at: http://www. jem.gov/modeling (last accessed 18.06.14.). Joint Ecosystem Modeling, 2010. Orthogonal NetCDF Standard. Available at: http:// www.jem.gov/Standards (last accessed 18.06.14.). Joint Ecosystem Modeling, 2012. Unstructured Grid NetCDF Standard. Available at: http://www.jem.gov/Standards (last accessed 18.06.14.). Keeney, R.L., 1992. Value-focused Thinking: a Path to Creative Decisionmaking. Harvard University Press. Lautenbach, S., Berlekamp, J., Graf, N., Seppelt, R., Matthies, M., 2009. Scenario analysis and management options for sustainable river basin management: application of the Elbe DSS. Environ. Model. Softw. 24 (1), 26e43. Liu, Y., Gupta, H., Springer, E., Wagener, T., 2008. Linking science with environmental decision making: experiences from an integrated modeling approach to supporting sustainable water resources management. Environ. Model. Softw. 23, 846e858. Matzek, V., Covino, J., Funk, J.L., Saunders, M., 2014. Closing the knowingedoing gap in invasive plant management: accessibility and interdisciplinarity of scientific research. Conserv. Lett. 7 (3), 208e215. McAffer, J., Jean-Michel, L., 2005. Eclipse Rich Client Platform: Designing, Coding, and Packaging JAVA Applications. Addison-Wesley. McIntosh, B.S., Ascough, J.C., Twery, M., Chew, J., Elmahdi, A., Haase, D., Harou, J.J., Hepting, D., Cuddy, S., Jakeman, V., Chen, S., Kassahun, A., Lautenbach, S., Matthews, K., Merritt, W., Quinn, N.W.T., Rodriquez-Roda, I., Sieber, S., Stavenga, M., Sulis, A., Ticehurst, J., Volk, M., Wrobel, M., van Delden, H., ElSawah, S., Rizzoli, A.E., Voinov, A.A., 2011. Environmental decision support systems (EDSS) developmenteChallenges and best practices. Environ. Model. Softw. 26, 1389e1402. Murray, D., McWhirter, J., Wier, S., Emmerson, S., 2003. 13.2 the integrated data viewer: a web-enabled application for scientific analysis and visualization. In: 19th International Conference on Interactive Information and Processing Systems for Meteorology, Oceanography, and Hydrology. NASA, 2007. World Wind Java SDK. Available at: http://worldwind.arc.nasa.gov/ java/ (last accessed 08.08.14.). National Research Council, 2008. Progress toward restoring the everglades: the second Biennial review. In: Committee on Independent Scientific Review of Everglades Restoration Progress (CISRERP). National Academies Press. The National Academies Press, Washington, DC, pp. 71e107 (Chapter 3). Neteler, M., Mitasova, H., 2008. Open Source GIS: a GRASS GIS Approach, third ed. Springer, New York, NY. 406 pp. Pletzer, A., Ziemlinski, R., Cohen, J., 2005. Ncvtk: a program for visualizing planetary data. In: Computational ScienceeICCS. Springer, Berlin Heidelberg, pp. 838e841. Potel, M., 1996. MVP: Model-view-presenter the Taligent Programming Model for Cþþ and Java. Taligent Inc. Ramsey, P., 2006. uDig desktop application framework. In: Presentation at FOSS4G 2006 Conference, Lausanne, Switzerland. Rauscher, H.M., 1999. Ecosystem management decision support for federal forests in the United States: a review. For. Ecol. Manag. 114, 173e197. Rew, R.K., Davis, G.P., 1990. NetCDF: an interface for scientific data access. IEEE Comput. Graph. Appl. 10, 76e82. Rizzoli, A.E., Young, W.J., 1997. Delivering environmental decision support systems: software tools and techniques. Environ. Model. Softw. 12 (2), 237e249. ~ ach, S.S., Conzelmann, C., Daugherty, A., Lorenz, J.L., Hunnicutt, C., Roman Mazzotti, F.J., 2011. Joint Ecosystem Modeling (JEM) Ecological Model Documentation Volume: Roseate Spoonbill (Platalea ajaja) Landscape Habitat Suitability Index v1.0.0. U.S. Geological Survey Open-File Report 2011e1273, p. 23. Available at: http://pubs.usgs.gov/of/2011/1273 (last accessed 18.06.14.). Sojda, R.S., Chen, S.H., El Sawah, S., HA, J., Guillaume, A.J., Lautenbach, S., McIntosh, B.S., 2012. Identifying the decision to be supported: a review of papers from environmental modelling and software. In: International Congress on Environmental Modelling and Software. Thackway, R., Lymburner, L., Guerschman, J.P., 2013. Dynamic land cover information: bridging the gap between remote sensing and natural resource management. Ecol. Soc. 18, 2. Twery, M.J., Knopp, P.D., Thomasma, S.A., Rauscher, H.M., Nute, D.E., Potter, W.D., Hoffman, R.E., 2005. NED-2: a decision support system for integrated forest ecosystem management. Comput. Electron. Agric. 49, 24e43. Volk, M., Lautenbach, S., van Delden, H., Newham, L.T., Seppelt, R., 2010. How can we make progress with decision support systems in landscape and river basin management? Lessons learned from a comparative analysis of four different decision support systems. Environ. Manag. 46 (6), 834e849.