A Voltage Regulation Method Using Distributed Energy Storage Systems in LV Distribution Networks Yu Wang1,2, Student Member, IEEE, Ben Fei Wang2, Student Member, IEEE and Ping Lam So2, Senior Member, IEEE 1. ERI@N, Interdisciplinary Graduate School, 2. School of Electrical and Electronic Engineering Nanyang Technological University Singapore 639798 Email:
[email protected] Abstract—This paper proposes a voltage regulation method using distributed energy storage systems (ESSs) in low-voltage (LV) distribution networks with high penetration of rooftop photovoltaics. The impact of renewable based distributed generation units on feeder voltages is investigated in detail. The voltage regulation method consists of two stages. The distributed control is proposed in stage one to coordinate distributed ESSs for voltage regulation. The power allocator is developed in stage two to determine the real and reactive power output of each ESS, so that the voltage regulation is achieved within the allowable operation ranges. The entire control structure makes sure that the voltages along distribution network are within the voltage limits while avoids depletion or saturation of ESSs under different operation conditions. The proposed method is tested in a LV distribution feeder and the simulation results validate the performance of the proposed method. Index Terms—Energy storage systems, distributed control, voltage regulation, distribution networks.
I. INTRODUCTION In the last few decades, the rapid developments of renewable technology have led to a significant growth in the amount of distributed generation (DG) in distribution networks. The increasing penetration of DG units will cause two major voltage problems. With high penetration of rooftop photovoltaics (PVs), PV generation may largely exceed customer load demand in the midday. The reverse power flow can potentially cause unacceptable voltage rise along the distribution network [1]. On the other hand, the massive charging of plug-in hybrid electric vehicles (PHEVs) will introduce additional power demand, which may result in unacceptable voltage drop along the distribution network [2]. The voltage deviations beyond acceptable limits will lead to poor power quality and even equipment failure. Traditional voltage regulation methods include installing voltage regulators/capacitors and changing the set points of tap-changing transformers [3], [4]. However, existing voltage regulation equipment is inherently designed for distribution This research work was supported by the School of Electrical and Electronic Engineering, Nanyang Technological University, Singapore, and was also supported by A*STAR under the Smart Grid Project (SERC Grant No.: 112 120 2022). 978-1-4673-8463-6/16/$31.00 ©2016 IEEE
networks with unidirectional power flow. For distribution networks with DG units and bidirectional power flow, the increased number of operation of these components will reduce their lifetime dramatically. Therefore, methods utilizing DG units for voltage regulation in distribution networks have been proposed [5], [6]. Reactive power compensation of distributed PV inverters has been developed for voltage regulation in [5]. However, the large R/X ratio in residential networks makes this method less effective than in transmission networks. Other researchers propose to curtail real power feed-in from PV at peak generation period [6]. The disadvantage of this method is that it reduces the efficiency of the PV generation. Energy storage systems (ESSs) have been widely reported to mitigate PV/wind fluctuations, perform frequency and voltage regulation and achieve peak shaving in distribution networks [7], [8]. Previously, the cost is the major barrier to the deployment of energy storage devices. However, battery prices have declined notably in recent years, which make ESSs a promising solution for voltage regulation in distribution networks. In this paper, the voltage regulation method is performed by controlling both the real and reactive power output of distributed ESSs. As distributed control scheme is an effective control structure for multi-agent system, so it is applied to coordinate distributed ESSs through communication link between them. The proposed voltage regulation method consists of two stages. In stage one, the distributed control using consensus algorithm is proposed to coordinate distributed ESSs in the distribution network. In the stage two, the power allocator is developed to determine the real and reactive power output of each ESS, so that the voltage regulation is achieved within the allowable operation ranges. The entire control structure ensures that the voltages along distribution network are within the voltage limits without violating the ESS allowable operation ranges. The rest of the paper is organized as follows. The analysis of voltage rise/drop issues is presented in Section II. In Section III, the proposed voltage regulation method is introduced in detail. Results and discussions are presented in Section IV. Finally, Section V draws the conclusion.
voltage relationship between (i-1)th bus and ith bus can be expressed as: ∗
Si = V i ⋅ I inj ,i
N
Sn
n =i
k =i
Vn
I i = I inj , n =
(2)
N
∗
V i = V i −1 + I i ( Ri + jX i )
Vmax ( Ri + jX i ) I i
S DG ,i Si
Vi −1 Ii
Vi
Vmin
Vi −1
S L ,i
Si
S DG ,i
Ii
(4)
∗
where Vi and Vi are the voltage vector and its conjugate at
Fig. 1. Radial distribution feeder with multiple buses.
S L ,i
(3)
Vi
( Ri + jX i ) I i
Fig. 2. Voltage rise and drop issues. (a) Power injection at peak PV generation period. (b) Voltage rise issue. (c) Power absorption at peak load period. (d) Voltage drop issue.
II. VOLTAGE RISE/DROP ISSUES Fig. 1 shows a typical radial distribution feeder with several customers. Each customer comprises a PV source, an ESS and an AC load, which are connected to a local bus. The combination of PV and ESS at the DC part forms a dispatchable DG unit which is convenient to control in both grid-connected and islanded operation [9], [10]. Depending on the direction and amount of power flow, the customers along the feeder will encounter voltage rise/drop issues. Especially at the end of the feeder, the voltage may exceed the limit at peak generation or load period. This problem is further illustrated as follows. The power injection of DG units and absorption of the loads are defined as positive and negative value, respectively. The complex power inject/absorb at the ith bus is Si = ( PDG ,i − PL ,i ) + j (QDG ,i − QL ,i )
(1)
where PDG ,i + jQDG ,i and PL ,i + jQL ,i are the complex power of the DG unit and the load at the ith bus respectively.
Using power flow analysis, the current flow I i and
the ith bus respectively, Ri + jX i is the impedance between (i-1)th bus and ith bus. The phasor diagram shown in Fig. 2 is used to illustrate the voltage rise/drop issues in the distribution feeder. During the daytime, the PV generation is usually larger than load demand. Thus the total power injects into the distribution network as shown in Fig. 2 (a). As shown in Fig. 2 (b), the current flow from customers to the grid will cause voltage rise between two adjacent buses. Thus the voltage rise from the transformer to the last customer may be beyond the upper voltage limit. The condition is opposite during the peak load period in the evening. Each customer absorbs power from the distribution network as shown in Fig. 2 (c). As shown in Fig. 2 (d), the current flow from grid to the customers will lead to voltage drop between two adjacent buses. Thus the voltage drop from the transformer to the last customer may be below the lower voltage limit. The dot line shows the possible operating ranges of DG units and loads. According to the analysis above, a mechanism that can reduce the power imbalance between PV generation and load demand can help to mitigate the voltage rise/drop issues. This goal is achieved by utilizing energy storage devices at customer side in this paper. The function of ESSs is to reduce the net power injection at each bus during the daytime and reduce the power absorption during the night. Therefore, the current flow in the distribution feeder will be reduced so that the voltage at the end of the feeder will be within the voltage limits. III. VOLTAGE REGULATION METHOD The objective of this paper is to regulate the feeder voltages utilizing energy storage devices under various operation conditions. The proposed voltage regulation method includes two stages which are distributed control and power allocator to achieve this goal. As shown in Fig. 3, in stage one, the control signal ui is generated by the distributed control to regulate the feeder voltages. In stage two, with distributed control signal and real time state of charge (SoC) of each ESS, the power allocator determines how much real and reactive power should be provided by each ESS for voltage regulation. The details of the proposed voltage regulation method are explained in the following subsections.
SoC1 (t )
u1 (t ) u2 (t − ts )
P1ref (t ), Q2ref (t )
u1 (t − ts )
Fig. 4. State transitions diagram for N buses distribution feeder.
SoCi (t )
s11 (t ) s12 (t ) s (t ) s (t ) 22 S (t ) = 21 sN 1 (t ) sN 2 (t )
ui (t )
u N (t − ts )
Pi ref (t ), Qiref (t )
u N −1 (t − ts )
SoCN (t )
u N (t )
ref N
ref
ref N
P (t ), Q (t )
u (t )
VN (t )
Fig. 3. Entire control structure of the proposed voltage regulation method.
A. Stage One: Distributed Control The stage one of the proposed voltage regulation method is to coordinate distributed ESSs for voltage regulation. A distributed control using consensus algorithm is applied for distributed ESSs to regulate the feeder voltages within the voltage limits. Consensus algorithm is achieved by sharing variable of interest, called the information state among all available units [11], [12]. For radial distribution feeder with multiple buses as shown in Fig. 1, the last bus is the critical bus which has the highest/lowest voltage in the feeder. Therefore, the last bus is chosen as a virtual leader to initiate the distributed control. The information state of the leader uref for ESS charging process is updated as follows:
u ref (t − ts ) + k1 (1.05V0 − VN (t )) if VN (t ) > 1.05V0 u (t ) = u ref (t − ts ) if 1.03V0 < VN (t ) < 1.05V0 0 if VN (t ) < 1.03V0 ref
(5) where VN is the voltage of the last bus, V0 is the voltage of the transformer bus, which is set to 1.0p.u. in this paper. Parameters k1 is the control gains, and ts is the sampling interval. For ESS charging process, if the voltage of the last bus VN goes beyond 1.05V0, uref will be increased. If the voltage of the last bus VN goes below 1.03V0, uref will become 0. In between, uref will be equal to the former value. The condition is similar for the ESS discharging process, which is not further illustrated here. The information state uref provided by the virtual leader is then communicated to available ESSs through communication links. The instantaneous communication topology can be represented by the following matrix:
s1N (t ) s2 N (t ) sNN (t )
(6)
where sij denotes the communication link between the ith and jth ESSs. sii = 1 for all i, sij = 1 if the information state of the jth bus is received by the ith bus at time t, and sij = 0 if otherwise. In this paper, it is assumed that ESSs can only communicate with their neighbor, which means all s(i)(i-1) = 1 and s(i)(i+1) = 1. The utilization ratio for the ith ESS is updated as follows: N
ui (t ) = dij (t )u j (t − ts ) + diN (t )u ref (t − ts )
(7)
j =1
where dij(k) is the (i, j) entry of a row stochastic matrix (i.e., row sum of 1) D(t) which can be found in each discrete time data exchange as follows: dij (t ) =
ωij sij (t − ts ) N
ωik sik (t − ts )
(8)
k =1
where the weights ωij are set to 1 in this paper to share the required real power equally among distributed ESSs and sij are the entries of communication matrix, given in (6). The ith ESS will know the ith row of matrix D(t) to perform the consensus operation. The row stochastic matrix D(t) for the N buses radial feeder with ESSs communicate with their neighbor can be presented using state transitions diagram as shown in Fig. 4. B. Stage Two: Power Allocator The stage two of the proposed voltage regulation method is to determine the real and reactive power output of each ESS and operate the ESS in allowable ranges. The power allocator located at each ESS is designed for this purpose. The operation of the ESS should take power and energy constraints into account. The power limits and SoC limits of the ESS during operation can be described by (9) and (10) respectively − Pcmax ≤ PESS (t ) < Pdmax
(9)
SoC min < SoC (t ) < SoC max
(10)
SoC max
SoC up
SoC low
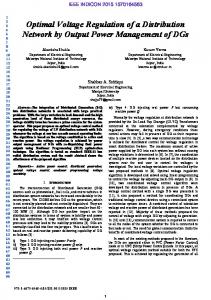
Fig. 6. Single line diagram of the radial test feeder.
SoC min Pdmax
− Pcmax Fig. 5. Operation ranges determined by power allocator.
where Pcmax and Pdmax is the maximum charging and discharging power of the ESS respectively. SoC max and SoC min are the maximum and minimum SoC limits of the ESS. Considering the SoC limits and power limits of the ESS, the power allocator is designed as follows: Based on the SoC limits, parameter λi of the ith ESS is defined by 1 if SoCi (t ) < SoC up up λi (t ) = SoC max− SoCi (upt ) if SoC up < SoCi (t ) < SoC max SoC − SoC if SoCi (t ) > SoC max 0 (11) where SoC up is the upper SoC reference of the ESS. Finally, with parameter λi and distributed control signal ui, the ith ESS power output for ESS charging process is determined by Pi (t ) = λi (t )ui (t ) P ref max Qi (t ) = (1 − λi (t ))ui (t )Q ref
max c
if
ref max Pi (t )i = λi (t ) Pc ref max Qi (t ) = [(ui (t ) − 1) + (1 − λi (t ))]Q
0 ≤ ui (t ) < 1 (12) if
ui (t ) > 1
where Pi ref and Qiref are the real and reactive charging power calculated by the ith power allocator. Q max is the maximum reactive power capacity of the inverter-based DG system. The condition is similar for the ESS discharging process. The operation ranges of the ESS determined by power allocator are shown in Fig. 5. It can be seen that Fig. 5, in the red area, both the ESS power and the SoC are in the normal operation range. Therefore, real power of the ESS is enough to regulate the feeder voltages. In the yellow area, both real and reactive power must be applied for voltage regulation, and it is represented by complex power voltage regulation. The blue area is where SoC is beyond the maximum limit. Therefore, only reactive power can be utilized for voltage regulation in the distribution networks.
Fig. 7. Influence on feeder voltages of bus number and power injection. TABLE I PARAMETERS OF SIMULATION SYSTEM Feeder Length Bus to Bus Distance Conductor Size MV/LV Transformer Size PV Size ESS Rating Maximum Voltage Deviation
500m 100m 0.549 + j0.072Ω/km 100kVA, 22/0.4kV 10kWp 20kWh/5kW 6%
IV. RESULTS AND DISCUSSIONS A distribution feeder with N=5 is implemented in Matlab/Simulink to verify the performance of the proposed method. The overhead residential feeder supplies electricity to five customers by a 100kVA, 22/0.4kV transformer. The distance between each bus is 100m. The single line diagram of the radial test feeder is shown in Fig. 6. The PV system at the residential households is operated at unity power factor and has the capacity of 10kWp. The ESS rated at 20kWh/5kW is integrated with the rooftop PV system of each customer which is a typical size for residential rooftop PV applications [13]. The voltage at the secondary of the transformer is set at 230 V (1.0p.u.). This paper allows a maximum 6% voltage deviation in the distribution network. The parameters of the simulation system are presented in Table I. Fig. 7 shows the influence on feeder voltages of bus number and power injection of the test feeder. As shown in Fig. 7, the last bus has the largest voltage deviation in the feeder for the same power injection at each bus. Moreover, the last bus is more sensitive to the power injection changes in the test feeder. Two test cases have been conducted and discussed in the following subsections.
Fig. 8. PV generation and load profiles for test case 1.
Fig. 12. PV generation and residential load demand for test case 2.
Fig. 9. Voltage profiles without regulation for test case 1.
Fig. 13. Voltage profiles without regulation for test case 2.
Fig. 10. Voltage profiles with the proposed method for test case 1.
Fig. 11. Real and reactive power charged by ESS at bus 5.
A. Test Case 1 In test case 1, the proposed voltage regulation method is verified with ideal PV and load profiles of each bus as shown in Fig. 8. The voltage profiles of each bus without and with voltage regulation are shown in Fig. 9 and Fig. 10 respectively. Fig. 11 shows the real and reactive power charged by ESS at bus 5 (ESS 5). The time sequences of the operation are described as follows: 1) 0≤t