A wavelet-packet census algorithm for calculating vortex statistics Andrew Siegela) and Jeffrey B. Weissb) Program in Atmospheric and Oceanic Sciences, Department of Astrophysical, Planetary, and Atmospheric Sciences, University of Colorado at Boulder, Boulder, Colorado 80309
~Received 26 November 1996; accepted 3 March 1997! A generalized wavelet-packet based technique for decomposing signals into coherent and noncoherent parts is presented. The method is tested on the vorticity field of numerical simulations of weakly decaying two-dimensional turbulence. The easily recognizable coherent vortex structures that emerge are systematically filtered from the solution. Once extracted, various properties of the vortices, such as their number, size, circulation, and peak value are computed. The results compare well with a similar study @J. Fluid Mech. 219, 361 ~1990!; Phys. Fluids 5, 608 ~1993!#, which employs a complex pattern recognition technique based exclusively on a priori knowledge of the properties of the solution—that is, the features typical of the resulting vortex structures. The similarity of the results is encouraging, suggesting that the wavelet packet technique, by absorbing much of the complexity into the mathematical features of the transform itself, can provide an efficient, standardized tool that is readily extendible to more complex problems in two and three dimensions. © 1997 American Institute of Physics. @S1070-6631~97!03206-6#
I. INTRODUCTION
Recent high-resolution numerical integrations of the Navier–Stokes equations have allowed us to investigate the coherent structures of high Reynolds number turbulence. Such simulations, together with laboratory experiments, have provided ample evidence that most important turbulence properties are carried by a few typical ‘‘objects’’ that dominate the flow.1–7 The turbulent transport of heat and momentum in the atmospheric boundary layer, for example, seems to occur in intermittent, nonperiodic bursting events associated with convective thermals and the leading edge of microfronts.3,8 In rotating Boussinesq convection the heat transport is believed to be dominated by well-defined plume structures that originate as vortices at the surface and propagate upward through the domain.9 The vorticity field in strictly two-dimensional as well as three-dimensional quasigeostrophic simulations organizes itself into coherent, typically axisymmetric monopole structures that occupy a relatively small fraction of the domain while containing the majority of the enstrophy.10,11–14 High-resolution direct numerical simulations of fully three-dimensional homogeneous turbulence have given evidence of similar small-scale intermittency in the vorticity field, though with apparently more complex topology ~e.g., Ref. 6!. Advances in computer visualization technology have enabled us to view flow evolution and make important observations of typical coherent structure behavior. Such analyses have undoubtedly enhanced our general understanding of turbulence, but their usefulness for model development is somewhat limited by their qualitative nature. A more quantitative analysis would augment these general observations with calculations of coherent structure properties—for example, their number, size, shape, mean amplitude, etc., as a function of time. The discovery of the properties of the coa!
Electronic mail:
[email protected] Electronic mail:
[email protected]
b!
1988
Phys. Fluids 9 (7), July 1997
herent structure evolution may then make it possible to construct a simplified model of the turbulence dynamics in terms of mutual interactions of the coherent structures that obey the empirically determined constraints ~e.g., Refs. 15–17!. The principle obstacle to such quantitative analyses is the difficulty of finding a meaningful way to decompose the flow into its coherent and noncoherent parts. Here we present a technique for carrying out such a decomposition. Our algorithm is cast purely in terms of the two-dimensional turbulence problem, but its fundamental design is intended to make it easily generalizable to a range of more complex problems. A. Structures in two-dimensional turbulence
Two-dimensional turbulence—i.e., high-Re solutions to the two-dimensional incompressible Navier–Stokes equations—has been a popular subject of research since Batchelor’s pioneering work.18 Batchelor’s interest lay primarily in using the two-dimensional 2-D solutions as a simplified paradigm for fully 3-D turbulence. His perspective was to sacrifice the vorticity stretching dynamics implied by the 3-D equations for a computationally feasible problem that manifested similar unpredictability and nondiffusive transport. At the same time, another class of investigators became interested in the properties of the 2-D solutions for their relevance to certain large-scale atmospheric and geophysical phenomena. The relevance arises from thinking of the 2-D equations as the limiting form of anisotropic 3-D turbulence.19,20 This approach has proved useful in explaining the form of low-wave number atmospheric spectra,21 modeling the circumpolar vortex,22,23 predicting stratospheric advection,22 and developing inverse-cascade theories for synoptic and mesoscale structures.24,25 Several important properties of 2-D turbulence can be deduced either directly or indirectly from the governing equations: a net inverse cascade of energy to large scales resulting in zero energy dissipation in the infinite Re limit,
1070-6631/97/9(7)/1988/12/$10.00
© 1997 American Institute of Physics
and a cascade of enstrophy to small scales via enstrophygradient amplification.18 Additionally, before the earliest computer simulations Batchelor hypothesized that a 2-D flow would evolve into a collection of coherent vortex structures.26 Visualizations of high-Re 2-D solutions have supported Batchelor’s speculation and provided further qualitative insights into the role of the coherent structures in the turbulent dynamics. Random initial conditions selforganize into a collection of coherent vortices, which subsequently evolve through dissipative vortex interactions.10,5,27 Same-sign vortex mergers result in a larger vortex and filaments that dissipate significant enstrophy. A relatively small vortex can be annihilated by the velocity shear induced by a larger vortex.23 A typical axisymmetric vortex, being stable to many perturbations, can be deformed by large-scale shear and then relax to axisymmetry.28 Through this process the vortices can develop sharp gradients at their edges by a process known as vortex stripping, which, at least in the finite Re case, results in diffusion at the vortex edges.23,29 A quantitative analysis of vortex behavior requires some method of decomposing the solution into vortex and nonvortex components. Traditional nonlocal decompositions, such as the Fourier transform, are clearly inadequate for this purpose since the vortices are localized in physical space. When a collection of vortices is Fourier transformed, it is highly unlikely that any subset of Fourier modes will correspond to an individual vortex. Perhaps the most obvious approach is to identify a vortex as a region of anomalously high vorticity, and to select some threshold for the physical-space field, considering the above-threshold part of the signal as the vortex component, and the remainder as the background. A simple connectivity algorithm can then extract an individual structure ~e.g., Ref. 30!. This technique, though useful for rough first analyses, is nonetheless fundamentally deficient in several aspects: ~1! the vortices are stripped of any vorticity beneath the cutoff values, which may be a significant amount during a filamentation event, for example; ~2! the cutoff threshold must be adjusted a posteriori from time step to time step to ensure adequate results; ~3! there is no clear way to generalize the technique to more complex problems, such as filtering multipole structures, or extracting noisy structures. The first systematic effort to improve upon simple thresholding was carried out by McWilliams.10 His vortex census algorithm operated by scanning the solution at a given time for certain defining criteria specific to the 2-D problem. The criteria are based on properties that an ‘‘objective observer’’ might associate with a vortex. However, there is potential hazard with basing the decomposition so strongly on an a priori knowledge of the solution: when the selection criteria are overly strict, all of the properties of the extracted structures are already implicit in the selection criteria. Both at early times when the vortex population is large, and any time when merging and shearing events are common, what should or should not qualify as a vortex is far from unambiguous. Nonetheless, given the properties upon which McWilliams bases his definition of a vortex, the results he achieves are undoubtedly reasonable, and they led to the formulation of a scaling theory for decaying 2-D turbulence.15,16 Phys. Fluids, Vol. 9, No. 7, July 1997
An alternative approach is an algorithm that absorbs much of the complexity of the feature education into a more general, systematic, and standardized set of operations. Such an algorithm is attractive because it may be more easily applicable to the wide variety of coherent structures seen in various turbulent flows. One general way to approach the question is from the perspective of data compression, by assuming that a basis that concentrates the information in the fewest number of modes simultaneously yields information on the type of structures that comprise the signal. In this view compression and pattern recognition are dual aspects of the same problem. While it is unlikely that each element in the new basis will correspond to a single coherent structure, it is hoped that a structure can be described by a small number of basis elements. For this to be true requires choosing basis elements that share certain properties with the coherent structures, for example, in terms of locality and symmetry. In this paper we develop and test a technique based on the above philosophy. The algorithm is set in the context of the two-dimensional vortex identification problem primarily because, given the relative topological simplicity of the coherent vortices, it is an obvious first step. However, we have designed the algorithm with an eye toward the more general question of coherent structure extraction in turbulence, since the core of the algorithm can be generalized to treat more complex problems, including three-dimensional structures. II. DECOMPOSITION ALGORITHM
The idea of the wavelet packet transform ~WPT! vortex decomposition algorithm is based on the empirical observation, reported by Farge et al.31 and Wickerhauser et al.,32 that a small number of the largest wavelet packet coefficients correspond to the coherent vortices of 2-D turbulence. We emphasize that the validity of this assumption rests on the quality of the results that it produces rather than a rigorous mathematical proof. However, the assumption is certainly reasonable, since we expect that by selecting the appropriate basis functions that maximize compression, the coherent structures will be efficiently captured by the highestamplitude coefficients in the transform space. A. Wavelets and wavelet packets
A detailed explanation of the the wavelet packet transform and its relation to the wavelet transform is given in Ref. 33. Here we limit our discussion to issues that are important to the present application. The general concept of the wavelet transform is to represent a function in a localized basis, i.e., one that is nonzero only over some concentrated fraction of the domain. Wavelets thus contrast with the Fourier transform, where the sinusoidal basis elements extend over the entire domain. Use of the wavelet transform also requires specifying a particular localized basis from a rather large and growing library of choices. One appealing feature of the wavelet transform is that, like the Fourier transform, all elements of the basis are derived from a single prototype function. With Fourier transforms this is accomplished through dilations of complex exponentials, while with wavelets, it is accomplished by both A. Siegel and J. B. Weiss
1989
dilations and translations of the so-called wavelet mother function. Requiring that the composition be complete and thus invertible puts limitations on which localized functions qualify as wavelet bases. An often unappealing feature of the nonorthogonal wavelet transform is that it is overcomplete: a discretely sampled signal of n points results in a transform with O @ n 2 # coefficients. This oversampling is avoided by using the orthogonal wavelet transform, which gives n wavelet coefficients for n data points. Though a localized transform will in general decompose an intermittent signal more efficiently than a global transform, a shortcoming of the orthogonal wavelet transform is that the precise location of each basis element is rigidly fixed a priori. If a structure is poorly aligned with the location of the nearest basis element, the reconstruction of the structure can require a large number of wavelet modes, many of which are included simply to cancel the artifacts produced by the rigid sampling locations. When the reconstruction relies too heavily on cancellation, we are no longer likely to find that the largest coefficients correspond to structures. This is because the coefficients involved in cancellation might very well be of a smaller magnitude than the modes corresponding to the noncoherent background ‘‘noise.’’ This problem is resolved by turning to the wavelet packet transform,33 a recently developed generalization of the wavelet transform. The WPT begins with a mother wavelet and forms a basis with certain dilations and translations of the template function. However, the WPT at the same time considers dilations and translations of an entire class of other basis functions with varying supports and numbers of oscillations. When the signal is decomposed into the WPT basis, as might be expected, the resulting information is overcomplete. It can then be shown that certain subsets of the information correspond to complete basis representations in terms of subset groups of the basis functions described above. The entire decomposition is often called the wavelet packet analysis, and the nonredundant, complete basis subset that is chosen is called the wavelet packet transform. The choice of basis subset is determined by minimizing a cost function, which can be different for different applications. The new basis functions involved in the WPT are derived in a simple, natural way from the mother function. Readers interested in precisely how this is accomplished should consult Wickerhauser.33 Here we wish to emphasize the main consequence of the WPT: the domain of the signal can be cut up much more precisely, and localized structures can be decomposed without significant artifacts due to misalignment with the location of the local basis. B. Global decomposition
We denote the WPT of a scalar function of vector argument z (x), with respect to an arbitrary wavelet packet basis as W z ~ x! 5˜ z s ~ l,x! ,
~1!
where W is the WPT operator, and ˜ z denotes the resulting wavelet packet coefficients, which depend on a scalar scale l, physical space location x, and a basis subset s, which is 1990
Phys. Fluids, Vol. 9, No. 7, July 1997
selected according to some cost-function criterion. Since we wish to keep only the largest coefficients we introduce a truncation operator, T m , Tm f 5
H
f, 0,
u f u >m, u f u ,m.
According to our initial hypothesis, for some value m the coherent part of the field, z c , is given by
z c 5W 21 T m˜ z,
~2!
where W 21 is the inverse WPT operator. Evidently, the reconstructed function z c (x) depends on the precise choice of the truncation value m. This dependence would be acceptable if either ~1! z c is relatively insensitive to some range of choices of m, or ~2! a quasiobjective method could be developed to choose a value of m. To answer question ~1! we performed a series of tests on numerically generated 2-D turbulence fields, applying Eq. ~2! for a range of m, and found an unacceptably high degree of scatter. For example, choosing values of m ranging from 1%– 15% of the maximum value of ˜ z gives vortex statistics that vary by as much as 20%. This scatter can be reduced dramatically by a posteriori empirical adjustments, but these adjustments make the algorithm too problem specific. Regarding the second point, we consistently encounter the problem that, no matter how we fix m, the results are not universally satisfying across all times in the flow evolution. We emphasize, however, that for the proper choice of m at each time step the results were very encouraging. This indicates that our initial hypothesis is valid, but underscores the fact that we need to systematically quantify the choice of cutoff parameter value at each time step. To remove the dependence on the truncation parameter, we borrow an idea from a generalized denoising scheme first developed by Wickerhauser ~see Chap. 11 in Ref. 33!. Wickerhauser suggests that extracting the coherence from an arbitrary signal should be an iterative process, first reconstructing the signal using a fraction of the wavelet packet coefficients @i.e., as in Eq. ~2!#, and subsequently testing to see if any coherence might remain to be extracted. We have adapted his ideas to construct an iterative WPT-based algorithm to extract the coherent part of a field z. At each step n in the algorithm the field has a coherent part z nc (x) and a remainder z nr (x), where
z nc 5W 21 T m W z n21 , r
~3!
z nr 5 z n21 2 z nc . r The initial field z is considered to be completely incoherent, i.e., z 0c 5 0, z 0r 5 z . The reconstruction described by ~2! takes z 1c as the entire coherent part of the signal. The iterative algorithm allows for the possibility that the remainder z 1r contains coherent parts. This algorithm still leaves open the choice of m, which we discuss in detail in the following section. However, its precise value does not affect the overall outcome very much, since subsequent steps in the iteration compensate for a poor initial choice of the truncation parameter. For example, if A. Siegel and J. B. Weiss
m is chosen too small, then z 1r will still have significant coherence that will be be extracted in further iterations of the algorithm. To complete the iterative algorithm we add a criterion to stop the algorithm at the Nth step when z Nr does not have a significant amount of coherence. Thus, we must introduce a new parameter, d, which sets a threshold for stopping the algorithm. The precise measure of coherence of z nr is discussed below. The total coherent field is now given by the sum of the coherent parts, N
z c5
(
n51
z nc .
~4!
Conceptually, it is helpful to think of the above iterative process as successive ‘‘peeling off’’ of coherent layers of the signal until only the background incoherent part remains. Wickerhauser suggests such a technique as a method of noise reduction. In our case, the background vorticity does not constitute noise in the traditional sense, but we expect it to be seen as incoherent with respect to an appropriate wavelet basis.
cient, but we expect the results to be essentially the same. However, if too many coefficients are initially retained, then the algorithm stops after the first iteration and some of the noncoherent parts of the signal are erroneously extracted. It is therefore important to select a value of m at each step in the iteration that we are confident does not constitute an overestimate of the coherent part of the signal. The safest choice is to retain only the single largest coefficient at each step, but then the number of iterations would be enormous and the algorithm extremely inefficient. Slightly more efficient is to take some fixed, relatively small number of the largest coefficients. This would probably give reasonable results for the proper choice of cutoff, but it is still liable to force the algorithm to go through an unnecessarily large number of iterations. Our choice is to adjust the value of the cutoff at each step depending on properties of the remainder signal itself. A good way of adjusting m is to consider the entropy of the wavelet coefficients of the signal at each level of the iteration. The entropy H of an arbitrary sequence f (k) is denoted by N
H~ f !5 C. Parameter choices
1
( p ~ k ! log p ~ k ! , k51
~5!
The iterative algorithm requires three specific choices: ~1! the truncation value m, which is related to the fraction of wavelet packet coefficients used at each step in the reconstruction; ~2! the stopping criterion d; and ~3! the wavelet packet basis. The initial noniterative algorithm appears simpler in that it involves only m and the choice of basis; however, we could find no systematic way to select a value of the truncation m. The advantage of adding an additional parameter is that most of the arbitrariness of the algorithm is now absorbed in the stopping criterion d, which, as we will argue, is both more robust than the cutoff threshold and easier to establish based on heuristic arguments. We make no pretense of mathematical rigor and precision in the establishment of the parameter values, as the problem of coherent feature extraction itself is very ill defined mathematically. Instead, we rely on heuristic arguments and an a posteriori analysis of the results.
where p(k) 5 u f (k) u 2 / i f i 2 is the normalized squared amplitude of the kth element of the sequence f , and N is the number of elements. Exponentiating the entropy gives the theoretical dimension of f , d( f ) 5 e H( f ) . Some simple theorems show that the value of d can be interpreted as a measure of the number of significant coefficients in the sequence ~e.g., see Ref. 33!. Our experience shows that reconstructing using d coefficients tends to underestimate the coherent part of the signal. According to the above arguments, this is the only criterion that needs to be met for the truncation parameter. Furthermore, if we also use the entropy H as the cost function in our WPT decomposition ~see Sec. II A!, then we have a single consistent measure of significance throughout the algorithm. We therefore consider it a reasonable choice to base the value of m on H.
1. Truncation parameter
2. Stopping criterion
The sense in which the results of the algorithm are no longer very sensitive to the choices of m can be seen intuitively by first considering the limiting case: if at each step we retain only the single largest wavelet packet coefficient, then z 1r differs only slightly from z. At step two, then, the stopping criterion is presumably not met, since the signal is still coherent, and the iteration proceeds. If at each successive iteration the program continues to select only the single largest coefficient, then the algorithm proceeds through many iterations until all the coherent parts of the signal are extracted. If on the other hand some slightly larger number of coefficients is retained at each step, then fewer iterations are required to extract the total coherent part of the signal. In this sense retaining a smaller number of coefficients is less effi-
At each step in the decomposition we need a method of determining when the remainder z nr is no longer coherent and the algorithm ceases. Intuitively, we take this to be when z nr is no longer efficiently explained by a small number of high-amplitude wavelet coefficients, i.e. when its wavelet packet coefficients have high entropy. ‘‘High entropy’’ implies some relation to a reference entropy H ref . We considered the following three choices of H ref , the motivation for which is explained below:
Phys. Fluids, Vol. 9, No. 7, July 1997
H ref5log N2 e ,
~6!
H ref5H ~ z nr ! 2 e ,
~7!
H ref5H ~ z ! .
~8! A. Siegel and J. B. Weiss
1991
In ~6! and ~7! e is an arbitrary parameter whose value is small compared to log N. The decomposition proceeds until H(W z nr ) . H ref , for whichever value of H ref is used, so that the stopping criterion d is given by d 5 H ref . The rationale for choosing ~6! is that log N constitutes the upper bound for the entropy of any process. If H(W z nr ) . log N 2 e, then we are justified in saying that z nr is represented poorly by the wavelet basis and there is no more coherence left to extract. Choice ~7! amounts to the statement that no more coherence remains in the signal when little is gained in a compression sense by transforming the remainder. This criterion is much less strict than the previous since it can terminate the algorithm, even for values of entropy H ! log N 2 e. Choice ~8! sets the threshold of incoherence with respect to the original signal z. We call the remainder, z nr , incoherent when it is represented less compactly in wavelet packet space than the original signal itself in physical space. This amounts to saying that the algorithm should be terminated when the truncation parameter requires us to retain more coefficients than are significant in the original signal. We tested the three criteria above and found that ~6! is far too strict. The consequence of an overly strict criterion is that the algorithm terminates after too many iterations, and considerable filamentation is admitted into the coherent part of the decomposition. Choices ~7! and ~8! yield very similar results for reasonable choice of e in ~7!. With e 5 0 expression ~7! tends to be overly strict, since only after many iterations does the WPT fail to obtain any compression at all on the remainder signal. We choose to use criterion ~8! since it consistently yields very reasonable results without the need for an arbitrary parameter, and hopefully has some universal applicability over a range of problems. 3. Choice of wavelet basis
To this point we have spoken generically of the WPT and ignored the issue of the particular choice of basis functions. This choice, however, influences the outcome of the procedure. We would like to choose a basis function that is identical to the structures in the signal, in this case elliptical vortex monopoles, so that one mode in the decomposition space corresponds to an individual coherent structure. Strict limitations on what mathematically constitutes a complete orthogonal basis, however, dictate that we compromise among a certain set of often desirable qualities such as locality, smoothness, isotropy, and other symmetries. No one wavelet basis has them all. In this analysis we choose to work with a Haar basis, which is simply a step function, defined as 2 1 over the interval @ 2 1,0# and 1 over the interval @0,1#. In our experience the final results do not vary significantly for a broad class of reasonable basis choices. Haar is appealing because of its localization properties in physical space: the sharpedged vortices are most efficiently decomposed by a compact basis function. Additionally, the symmetry properties of the Haar are similar to a prototypical vortex in that both are invariant to rotations of p /2. Less importantly, the WPT algorithm is significantly more efficient with a highly localized basis. A shortcoming of using the Haar basis is that its sharp 1992
Phys. Fluids, Vol. 9, No. 7, July 1997
edges result in relatively slow convergence to the final, smooth vortex profile, a problem that can be circumvented, if it becomes significant, as we explain later. D. Extracting individual vortices
The iterative algorithm discussed above globally extracts the coherent part of a signal but is not designed to isolate individual structures. Adding this capability first requires some quantitative definition of a structure. A natural choice in this context takes advantage of the locality of the wavelet packet basis, relating a structure to any isolated cluster of wavelet packet coefficients in the coherent part of the signal. This is accomplished by first finding the location and support of each wavelet basis element, given by a square of center x0 and size s, and locating other wavelet basis elements with overlapping or neighboring support. Specifically, if we begin with an arbitrary wavelet packet basis element c, then its immediate neighbors are defined as any other wavelet basis elements whose domain of support has at least any one of the following properties: ~1! it borders the domain of support of c; ~2! it is a subset of the domain of support of c; ~3! it is a superset of the domain of support of c. The wavelet packet transform itself excludes the possibility of overlapping supports that are not either subsets or supersets. One then begins with an arbitrary wavelet coefficient and locates its immediate neighbors. Each of the immediate neighbors is then tested to see if they have any immediate neighbors that were not in the initial group. This process continues until an entire isolated cluster of wavelet coefficients is obtained. This isolated cluster is considered a coherent structure. At each step of the iterative algorithm we carry out the process described above, and the coefficients are assigned either to pre-existing vortices, or, if they are not the immediate neighbors of any preexisting vortex, to a new vortex. An ambiguity can arise if a coefficient at step n of the vortex is an immediate neighbor of two pre-existing vortices from the first n 2 1 steps. This situation is very rare and can occur only if two vortices are very close to one another. Since the effect on the final result is negligible, and there seems to be no strongly compelling physical rationale for choosing to associate the coefficient with one vortex rather than the other, we arbitrarily assign the ambiguous coefficient to the vortex that shares the larger boundary. We exclude the possibility that the cluster constitutes a single vortex based on the assumption that, using the entropy thresholding criterion, the first level of the decomposition captures the majority of the coherence of the signal. A second complication concerns the effect of the stopping criterion on the definition of a structure. If the algorithm proceeds through several iterations, our experience shows that at the final stage a very small amount of filamentation may ‘‘erroneously’’ be included in the coherent part of the signal. This small addition will have a negligible effect on the global decomposition. However, if the filamentation constitutes an isolated cluster, then it is counted as an individual structure. To limit this effect, we may alternatively define a structure as any isolated cluster that emerges after only the first p iterations. This definition is based on the assumption that later stages in the decomposition serve only as succesA. Siegel and J. B. Weiss
sive refinements of the coherent structures. The results shown in this paper use a value of p 5 2. We find that using a different value of p has only a minor affect on the details of the results, and none whatsoever on conclusions about vortex scaling. Finally, if the original structures in the field are smooth but the reconstructed structures are poorly resolved by a singular basis, it is always possible at the end of the algorithm improve the reconstruction by including all the remaining small-amplitude basis elements whose support lies within what the algorithm has defined as a structure. In the current analysis, this latter operation has an insignificant effect on the vortex statistics. III. RESULTS
The WPT census algorithm described above was applied to the output of the McWilliams 2-D barotropic vorticity code.10,15,5 The WPT coefficients were computed using a minimum entropy best-basis search as described in Wickerhauser,33 after first expanding the fields from 4502 to 5122 using zero padding in Fourier space. The numerical algorithm used by McWilliams is a standard pseudospectral integration of the 2-D incompressible vorticity equation, using a hyperviscous dissipation operator in order to increase the effective Reynolds number, i.e.,
z t 1J ~ C, z ! 52 n ¹ 2 ~ ¹ 2 z ! ,
~9!
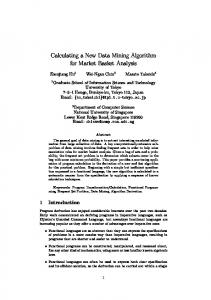
where C(x,y) is the streamfunction, z 52¹ 2 C is the vorticity, J(a,b)5a x b y 2 a y b x is the Jacobian, and n is the coefficient of hyperviscosity. The domain is a doubly periodic square with side 2p, n 5 3.531029 , the resolution is 4502 , and the initial condition is a narrowly distributed energy spectrum with random phase and total energy of 0.5. Further details of the integration are explained in Ref. 10. To gain a sense of the WPT decomposition when applied to the simulation results, Fig. 1 shows a typical example of the final globally decomposed vorticity fields at an intermediate time. Each individual vortex in the global coherent field is labeled independently and can be extracted after the global field is filtered. Using a standard SGI workstation, the total procedure takes only several seconds per vorticity field. Given the computer-intensive nature of typical pattern recognition routines with an abundance of nested ‘‘if’’ statements,34 this speed is encouraging. The first reconstruction uses from several percent of the wavelet packet coefficients at the earliest times to less than one percent at later times. In general, only several iterations are required until the stopping criterion is met, and the subsequent refinement stages retain several percent of the remainder coefficients at all times. In Fig. 1 the algorithm appears to yield a qualitatively satisfying decomposition, with the exception of small artifacts around the edges of the vortices, which are the result of the anisotropy and singularity of the basis functions. While such artifacts due to the singularity of the basis functions are undesirable, Fig. 2 shows the negative consequences of using a smoother wavelet basis. Because of the oscillations of the Coiflet 12 wavelet, rippling is introduced around the perimeter of the reconstructed vortices. The ripPhys. Fluids, Vol. 9, No. 7, July 1997
pling artifact is not reduced at subsequent steps in the iteration, and the final decomposed field potentially gives misleading information on the statistical properties of the background filamentation. The advantage of the Coiflet is that it produces smoother vortices on the first iteration, but since the algorithm generally goes through at least two iterations, this is not an advantage with the present technique. A. Comparison with thresholding
We made reference to the shortcomings of using physical-space thresholding, even in the relatively simplistic 2-D vortex problem. Here we illustrate a particular example. A typical measure of the intensity of coherence in a signal is the fraction of some relevant quantity contained in the coherent structures. Figure 3 compares the physical-space thresholding and WPT results for the fraction of the enstrophy contained in the vortices as a function of time, i.e., where V c (t)5 * xz c (x,t) 2 dx and V c (t)/V(t), 2 V(t)5 * xz (x,t) dx. The figure shows that the coherent vortices obtained with the WPT algorithm at all times account for at least 90% of the total enstrophy, with values approaching 98% at later times. On the other hand, the different cutoff thresholds, chosen as a percentage of the maximum vorticity amplitude at the given time step, all show a local central maximum with otherwise relatively small values for the vortex enstrophy. Note also the very gradual shift in amplitude as the cutoff value is adjusted. Intuitively, at late times we expect V c /V to asymptote to a value of unity, when the nonlinear terms become small and all of the enstrophy is eventually carried by the final dipole structure. When this occurs, though, the vortices are relatively expansive, and the thresholding technique apparently fails to include a significant fraction that lies on the perimeter of the vortex. In Fig. 3 we see a hint of this behavior of the thresholding decomposition as V c /V begins to decrease at intermediate times. At the earliest times, the WPT algorithm evidently selects many small-amplitude structures as coherent vortices that are eliminated in the physical-space thresholding because of their small amplitude, regardless of shape. This observation is meant to underscore the dramatically different results that can be obtained from the two types of algorithms, even in what appears to be a relatively simple topology. B. Temporal vortex scaling
In Ref. 10, McWilliams published the results of his vortex census code for the time evolution of certain vortex properties. These included vortex number N(t), mean vortex radius r a (t), mean vortex amplitude z a (t), mean vortex circulation G a (t), and total enstrophy V(t), where the subscript a denotes the average over the entire vortex population at a given time. In Ref. 16 the authors developed a scaling theory for the time evolution of the above vortex properties. The theory is based on the assumption that, in addition to the total energy E, a second conserved quantity appears in 2-D flows: the vorticity amplitude inside the vortex cores z e , which is shielded from the dissipation and deformation that occurs elsewhere in the flow. The scaling theory thus derived is a A. Siegel and J. B. Weiss
1993
FIG. 1. At time t 5 30 using the WPT algorithm, contour surface of ~a!. The total vorticity field z; ~b! the coherent part of the vorticity field z c ; ~c! the absolute value of the background, noncoherent part of the vorticity field z r . In ~a! and ~b! the selected gray levels are identical.
‘‘mean vortex theory,’’ based on the conservation of the population average of z e , denoted as z a (t). With this assumption dimensional considerations show that, if N(t) decreases algebraically with scaling exponent 2j, then r, G, and V have algebraic time dependence as well, with scaling exponents of j/4, j/2, and 2j/2, respectively. Both in Refs. 15 and 16 the authors applied the McWilliams census algorithm to the simulation data described 1994
Phys. Fluids, Vol. 9, No. 7, July 1997
above in an attempt to verify the scaling hypothesis. Their overall results reasonably supported the theory. In this section we test the performance of the WPT census algorithm on the same data, both to further test the scaling hypothesis as well as give a detailed comparison of the performance of the two vortex extraction methods. Figure 4 compares the vortex number N(t) for the WPT and McWilliams algorithms, together with their ratio d N(t) A. Siegel and J. B. Weiss
FIG. 2. The coherent part of the vorticity field z c using a Coiflet 12 basis.
[ N WPT(t)/N McW(t). Using a least-squares fit, the scaling exponent for the wavelet count was computed as 0.72, which is identical to the value obtained using the McWilliams algorithm.15 As might be expected, the largest discrepancy occurs at the earliest time in the vortex emergence, when it is most difficult to determine subjectively what should qualify
FIG. 3. The fractional vortex enstrophy V c /V as a function of time. The solid lines are obtained by using physical-space thresholding to extract the vortices, each line representing a different cutoff value ranging from 1% to 20% of the maximum value of z at the given time. The dashed line is the result obtained from the WPT algorithm. Phys. Fluids, Vol. 9, No. 7, July 1997
FIG. 4. Lower part: Vortex counts N(t) using the McWilliams algorithm ~triangles! and the WPT algorithm ~squares!. The solid line is the leastsquares fit with a slope j 5 0.72. Upper part: d N(t), the adjusted ratio of the WPT count to the McWilliams count, as defined in the text.
as a structure. From t 5 6 through t 5 30, the values of N WPT and N McW differ by less than 5%, with the WPT algorithm, in general, selecting a slightly higher number. This difference seems to result from a relatively small number of structures that the McWilliams code rejects based on a lack of symmetry about the monopole center, which the code uses as an a priori selection criteria. Of the few cases where the wavelet algorithm counts a smaller number of vortices, the one interesting case occurs when two contiguous, like-sign vortices ~according to McWilliams’ results! are counted as an individual structure by the wavelet code. From times t 5 30 to t 5 40 the discrepancies in the results of the two algorithms grows to 5%–10% before decreasing significantly at late times. We attribute this local maximum at intermediate time to the domination of annihilation and merger events relative to the total number of vortices in the field. It is important to emphasize that there is no objective test for the more correct interpretation of the vortex field. The philosophy of the wavelet packet algorithm is to have the decomposition itself decide what a structure is, based on the similarity of the basis function to the vortex structures, hopefully objectifying the entire process to a greater extent and facilitating comparisons with other results. In any case, it is encouraging that the assumption of algebraic scaling for the vortex number appears to be reasonably verified in either case. Figure 5 compares both the average vortex radius r a (t) and circulation G a (t) for the two algorithms, together with A. Siegel and J. B. Weiss
1995
FIG. 5. Lower part: Average vortex radius r a WPT ~triangles! and r a McW ~diamonds!; average vortex circulation G a WPT ~asterisks! and G a McW ~plusses!. The solid lines have slope j /2 and j /4. Upper part: d r a ~squares! and d G a (t) ~circles!, the adjusted ratios of the WPT results to the McWilliams results, as defined in the text.
the ratios dG and d r. Note that the WPT results for r a and G a appear follow similar scaling laws, but have a slight amplitude shift. Thus, to give a more meaningful comparison of the results we choose to plot their ratio by first adjusting the time averages: d r [ (r a WPT 2 r a WPT 1 r a McW)/r a McW and d G [ (G a WPT 2 G a WPT 1 G a McW)/G a McW. For the WPT algorithm r a (t) was computed by measuring the fraction of the total area that each vortex occupied, and, assuming a circular domain for each vortex, dividing by p and taking the square root of the result. Thus we take advantage of the natural definition of area implicit in the wavelet algorithm, which produces as output the exact domain of each vortex. If we instead choose to mimic McWilliams and define vortex size as some fraction of the peak value, then the results of the WPT algorithm would differ by very little from the McWilliams algorithm. However, since the WPT vortex size is already defined by the algorithm, introducing some arbitrary threshold to determine where the vortex ends is philosophically unsatisfying. As Fig. 5 shows, the scaling theory is still reasonably verified, with some fairly significant discrepancies at the earliest times. Overall, the wavelet algorithm defines a vortex to be slightly larger than McWiliams’ definition, which is still consistent with scaling theory since the scaling addresses only the slope of the line. The average circulation G a (t) was computed in a straightforward manner by calculating the circulation in each vortex and dividing by 1996
Phys. Fluids, Vol. 9, No. 7, July 1997
FIG. 6. Lower part: Average vortex peak values z a WPT ~triangles! and z a McW ~squares!, normalized by their respective maximum values. Upper part: d z a (t), the adjusted ratio of the WPT result to the McWilliams result, as defined in the text.
the number of vortices. As is expected from the previous plot, since the vortices are larger, the value of their circulation is slightly higher, but the scaling does not differ significantly. Figure 6 compares the peak vorticity value for the two algorithms. In this case z a WPT(t) tends to be slightly less than z a McW(t), which we attribute the fact that some filtering is being done in the WPT case, where a small amount of vorticity is lost. Overall, the differences are not very significant, and the values of z a (t) remain roughly constant in time. Since dimensional analysis cannot distinguish between powers of averages and averages of powers, the above scaling theory implicitly assumes that the two have the same scaling, e.g., r m ~ t ! 5c m @ r ~ t !# m ,
~10!
where the overbar indicates an average over the vortex population at a given time, e.g., r a (t) [ r(t). 15 This turns out to be equivalent to a constraint on the probability density function of the various vortex quantities. Taking the vortex radius as an example, ~10! implies a self-similar form of r (r,t),
r ~ r,t ! dr5 r
S D
r dr 5 p ~ x ! dx. r a~ t ! r a~ t !
~11!
In Fig. 7 we attempt to gauge the validity of the assumption by showing the quantity p(x) at a number of times in the flow evolution. Given the statistical limitations due to a relatively small number of vortices, it is difficult to make a deA. Siegel and J. B. Weiss
FIG. 7. Probability density function p(x) vs x for times 5, 15, 25, 40, and 120.
finitive statement on the accuracy of assumption ~11!, but our results seem to support the finding that p(x) has no apparent trend.2 C. Reinterpreting traditional scaling
In his 1969 paper,18 Batchelor made several important predictions on the scaling behavior of decaying, isotropic 2-D turbulence. The first of these concerned the inertialrange scaling of the enstrophy spectrum. Using arguments similar to Kolmogorov 1941,35 Batchelor hypothesized the existence of a range of scales for high-Re flows, where the statistical quantities of the turbulence depend only on two quantities: the enstrophy dissipation rate x and the wavenumber k. Dimensional arguments then show that the enstrophy spectrum V(k) in this range must scale as V ~ k ! 5C x a k b ,
~12!
with a 5 32 and b 5 21. It is well known that the value b521 significantly underestimates the spectral slope observed in direct numerical simulations ~e.g., Refs. 5 and 36!. The reason for this failure is understood to be related to the emergence of the coherent vortices, not explicitly taken into account by ~12!, which arrest energy and enstrophy transfers in physical space and have significantly nonlocal interactions in Fourier space. If the majority of the enstrophy is carried by localized structures in physical space, then we expect a broad band of the enstrophy spectrum to be dominated by the totality of the contributions from the individual localized vortices.37 Thus, a number of authors have proposed revised theories for the value of b based on the spectrum resulting from a collection of quasisingular functions ~Ref. 38 and references therein!. In addition to formulating a more accurate prediction of b based on the presence of the coherent structures, it is also possible to reinterpret and test Batchelor’s ideas in terms of the vortex decomposition. To do so we need to first consider the concept of a ‘‘scale’’ more generally, rather than as simply an individual Fourier mode.39 Traditionally, we associate the Fourier enstrophy spectrum at wave number k with the Phys. Fluids, Vol. 9, No. 7, July 1997
FIG. 8. The radially averaged Fourier enstrophy spectrum of the background field V r (k) multiplied by wave number k. Times range from t 5 5 to t 5 40 in increments of 3, as well as time t 5 120. The different curves are shifted in amplitude for clarity, with time increasing upward.
enstrophy of a structure of size 1/k. In the case of twodimensional turbulence the vortex structures are broadband in wave number space. Thus, a more accurate picture of the enstrophy of structures of size 1/k can be obtained from the decomposition z 5 ( z ic 1 z r , where the z ic are the structures, and the enstrophy V ic of a structure of radius R i constitutes one point on the discrete coherent structure ‘‘enstrophy spectrum.’’ In an intuitive sense we consider these coherent vortices to be ‘‘noninertial,’’ since they are relatively close to the spectral peak, have significant lifetimes, and carry most of the enstrophy of the flow. The background z r is incoherent and not very intermittent, so we naturally hypothesize that it has the inertial range scaling predicted by ~12!. Testing this hypothesis requires that we compute the Fourier spectrum after first having eliminated the coherent vortices from the signal, since otherwise the ‘‘noninertial’’ vortices will contaminate the spectrum. Borue40 made a similar computation using a thresholding decomposition for the case of forced 22D turbulence. His calculations clearly verified the existence of a 25/3 inverse-cascade scaling regime. Figure 8 shows the background radially averaged spectra V r (k), computed using the WPT algorithm. The plot shows evidence of a b 5 21 scaling regime for a number of different times in the flow, which lends evidence to the fact that the background incoherent part of the flow behaves like an inertial range. We mention in passing that the coherent enstrophy spectrum V c (k) is qualitatively very similar to the full enstrophy spectrum V(k), which has been published elsewhere.5 Next we consider the form of the coherent-structure ‘‘spectrum’’ discussed above. Its form was predicted by Benzi et al.,27 based upon a self-similar form of the vorticity and streamfunction of an arbitrary vortex, i.e.
z ic ~ r ! 5 z 0i f ~ r/R i ! ,
~13!
c ic ~ r ! 5 c 0i g ~ r/R i ! , A. Siegel and J. B. Weiss
1997
There appears to be a broad region of 22 scaling at the large-scale end, supporting the hypotheses of Benzi et al. For smaller vortices, however, the enstrophy appears to fall off more rapidly, suggesting that either one or both of the hypotheses above is not strictly valid. Since the authors themselves established very convincingly the self-similar form of the typical vortex, it seems reasonable to assume that the smaller vortices tend to be of lower amplitude than the larger ones. Figure 9 shows this explicitly in a plot of vortex amplitude as a function of 1/R i for a wide range of times. While the large vortices have approximately constant amplitude with R i , there is a noticeable falloff for smaller radii. IV. CONCLUSION
FIG. 9. Vortex enstrophy V ic and vortex amplitude z 0i as a function of inverse vortex radius 1/R i . The different curves correspond to the vortices chosen from different times, ranging from t 5 5 to t 5 40 in increments of 3. Time t 5 120 is also plotted. The straight line has a slope of 2 2. Here z 0i is scaled by a factor of 5 to make the plot less crowded.
where z 0i and c 0i are the amplitudes of the vorticity and streamfunction associated with the ith vortex, R i is the vortex radius, and c ic is the vortex streamfunction. The functions f and g are presumed to be universal with no explicit time dependence. Equations ~13! imply that the ratio of the enstrophy to the squared circulation of an individual vortex must scale as R 22 i , a fact that was well supported by the calculations in Benzi et al. Another consequence of ~13! is that the enstrophy of an individual vortex, V ic , scales as R 2i ; that is V ic 5
E
Ri
0
z ic ~ r ! 2 dr5C V z 20i R 2i ,
~14!
where C V is independent of R i . Evidently, if z 0i depends only weakly on R i , then a plot of V i versus scale 1/R i should decay as R 22 i . Neither this scaling relation nor the hypothesis of weak dependence of z 0i was tested explicitly by the authors. Since Eq. ~14! relates the enstrophy of the flow to the size of the structure containing the enstrophy, we prefer to think of ~14! as predicting the form of the enstrophycontaining range of the enstrophy ‘‘spectrum.’’ Of course, this will look much different from the low-wave number part of the Fourier enstrophy spectrum, since the vortices are localized in physical space and therefore spread enstrophy over a broad band of wave numbers. The ‘‘spectrum’’ in terms of coherent structures, on the other hand, corresponds more directly to typical conceptual pictures such as ‘‘the enstrophy of eddies of size R i ,’’ upon which a number of traditional turbulence theories have been based ~e.g., Ref. 35!. We reiterate this point here only to emphasize that the importance of relation ~14! goes beyond its implied ability to test the hypotheses of self-similar vortices and weak dependence of z 0i on R i . In Fig. 9 the vortex enstrophy is plotted as a function of inverse scale 1/R i for a number of different times in the flow. 1998
Phys. Fluids, Vol. 9, No. 7, July 1997
We have attempted to use the compression properties of the recently developed wavelet packet transform ~WPT! to develop a generalizable algorithm that extracts individual coherent structures in turbulent flows. The motivation for developing a WPT-based algorithm comes from the realization that data compression and feature education are not independent concepts; rather, the details of the signal’s compression can yield information on its coherent components. Our general idea is simple: to choose an appropriate basis for the decomposition and retain only a small subset of the largest coefficients in the transform space. The need for a more systematic algorithm via the elimination of ad hoc parameter adjustments leads us to a few simple refinements of the fundamental idea. As the algorithm currently stands, we have little doubt that it can be gainfully applied to the results of any twodimensional fluid simulation as an efficient and standardized method of computing vortex statistics. Much of our confidence on this matter comes not only from our general experience with manipulating the results, but from the favorable comparisons to McWilliams’ vortex properties, which we documented in Sec. III. In this sense those tests constitute an important first step in the use of the algorithm. Furthermore, we were able to apply the global decomposition to test traditional theories on the behavior of the inertial and energy-containing regions of the flow. We found that a region of Batchelor k 21 scaling seems to exist when the spectra are computed after first extracting the vortices from the flow. Additionally, the low-wave number energycontaining range of the turbulence can then be interpreted as a coherent structure ‘‘spectrum,’’ whose scaling closely follows the predictions of Benzi et al.27 Finally, we must consider the important question of generalizing the WPT algorithm to operate on a more complex set of problems, particularly those in three dimensions. We believe that the feasibility of success of such an extension depends greatly on the topology of the structures in question, since this exactly determines the selection of the wavelet basis function. Certainly, the rudiments of the WPT algorithm are readily extendible to three dimensions, as the WPT itself becomes no more complex, and retains its high degree of efficiency. Nor are the other elements of the algorithm specific to two dimensions. However, we are currently limited mathematically by the nature of the functions that are proven to qualify as wavelet bases. In the case of the twoA. Siegel and J. B. Weiss
dimensional problem there were only relatively minor problems in finding a suitable archetypal basis, but we expect these problems to become more significant as the structures become more complex. Our perspective is that the 3-D quasigeostrophic vortex field is the logical next step, and is most likely tractable within the present state of mathematical knowledge. ACKNOWLEDGMENTS
The authors are grateful to James McWilliams for supplying his 2-D simulation data and automated vortex census results, and to Juri Toomre for helpful discussions and comments on the text. We would also like to acknowledge the support of National Science Foundation Grants No. GER9355046 and No. ESC-9217394. A. A. Townsend, The Structure of Turbulent Shear Flow ~University Press, Cambridge, 1956!. 2 J. Laufer, ‘‘New trends in experimental turbulence research,’’ Annu. Rev. Fluid. Mech. 7, 307 ~1975!. 3 L. Mahrt and J. F. Howell, ‘‘The influence of coherent structures and microfronts on scaling laws using global and local transforms,’’ J. Fluid Mech. 260, 247 ~1994!. 4 C. Basdevant and Y. Couder, ‘‘Experimental and numerical study of vortex couples in two-dimensional flows,’’ J. Fluid Mech. 173, 225 ~1986!. 5 J. McWilliams, ‘‘The emergence of isolated coherent vortices in turbulent flow,’’ J. Fluid Mech. 146, 421 ~1984!. 6 J. Bridges, H. S. Husain, and F. Hussain, ‘‘Whither coherent structures,’’ in Whither Turbulence: Turbulence at the Crossroads ~Springer-Verlag, New York, 1989!, p. 535. 7 O. Me’tais and M. Lesieur, Turbulence and Coherent Structures ~Kluwer Academic, Dordrecht, 1991!. 8 J. C. Kaimal, ‘‘Measurement of momentum and heat flux variations in the surface boundary layer,’’ Radio Sci. 4, 1147 ~1969!. 9 K. Julien, S. Legg, and J. Werne, ‘‘Penetrative convection in rapidly rotating flows: Preliminary results from numerical simulation,’’ Dyn. Atmos. Oceans 24, 237 ~1996!. 10 J. C. McWilliams, ‘‘The vortices of two-dimensional turbulence,’’ J. Fluid Mech. 219, 361 ~1990!. 11 J. McWilliams, ‘‘The vortices of geostrophic turbulence,’’ J. Fluid Mech. 219, 387 ~1990!. 12 J. McWilliams, ‘‘Geostrophic vortices,’’ in Proceedings of the International School of Physics of Enrico Fermi, 1990, edited by J. C. Gille and G. Visconti ~Elsevier, New York, 1990!, p. 579. 13 J. C. McWilliams J. B. Weiss, and I. Yavneh, ‘‘Anisotropy and coherent vortex structures in planetary turbulence,’’ Science 264, 410 ~1994!. 14 J. C. McWilliams, and J. B. Weiss, ‘‘Anisotropic geophysical vortices,’’ CHAOS 4, 305 ~1994!. 15 J. B. Weiss and J. C. McWilliams,‘‘ Temporal scaling behavior of decaying two-dimensional turbulence,’’ Phys. Fluids 5, 608 ~1993!. 16 G. F. Carnevale, J. C. McWilliams, Y. Pomeau, and W. R. Young, ‘‘Evolution of vortex statistics in two-dimensional turbulence,’’ Phys. Rev. Lett. 66, 2735 ~1991!. 17 R. Benzi, M. Colella, M. Briscolini, and P. Santangelo, ‘‘A simple point vortex model for two-dimensional decaying turbulence,’’ Phys. Fluids 3, 1036 ~1992!. 1
Phys. Fluids, Vol. 9, No. 7, July 1997
18
G. K. Batchelor, ‘‘Computation of the energy spectrum in twodimensional turbulence,’’ High Speed Comput. Fluid Dyn. Suppl. II, 233 ~1969!. 19 D. Lilly, ‘‘Numerical simulation of two-dimensional turbulence,’’ Phys. Fluids Suppl. II, 240 ~1969!. 20 J. C. McWilliams, ‘‘On the relevance of two-dimensional turbulence to geophysical fluid motions,’’ J. Theor. Appl. Mech. Num. Spec. 2, 83 ~1983!. 21 J. Charney, ‘‘Geostrophic turbulence,’’ J. Atmos Sci. 28, 129 ~1971!. 22 D. Waugh, R. A. Plumb, and R. J. Atkinson, ‘‘Transport of material out of the stratospheric arctic vortex by Rossby wave breaking,’’ J. Geophys. Res. 99, 1071 ~1994!. 23 A. Mariotti, B. Legras, and D. Dritschel, ‘‘Vortex stripping and the erosion of coherent structures in vortex flows,’’ Phys. Fluids 6, 3954 ~1994!. 24 T. C. Chen and A. Wiin-Nielsen, ‘‘Nonlinear cascades of atmosphere energy and enstrophy in a two-dimensional spectral index,’’ Tellus 30, 313 ~1978!. 25 K. N. Federov and A. I. Ginsburg, ‘‘Vortex dipoles in the ocean and in a laboratory tank,’’ Ann. Geophys. B 4, 507 ~1986!. 26 G. K. Batchelor, Homogeneous Turbulence ~University Press, Cambridge, 1958!. 27 R. Benzi, S. Patarnello, and P. Santangelo, ‘‘Self-similar coherent structures in two-dimensional decaying turbulence,’’ J. Phys. A 21, 1221 ~1988!. 28 A. J. Bernoff and Lingevitch, ‘‘Rapid relaxation of an axisymmetric vortex,’’ Phys. Fluids 6, 3717 ~1994!. 29 D. Dritschel, ‘‘Strain-induced vortex stripping,’’ in Mathematical Aspects of Vortex Dynamics, edited by R. Caflisch ~Society of Industrial and Applied Mathematics, Philadelphia, 1989!, p. 107. 30 R. Benzi, S. Paternello, and P. Santangelo, ‘‘On the statistical properties of decaying turbulence,’’ Europhys. Lett. 3 ~7!, 811 ~1986!. 31 M. Farge, M. Holschneider, and J. F. Colonna, ‘‘Wavelet analysis of coherent structures in two-dimensional turbulent flows,’’ in Topological Fluid Mechanics, edited by A. Tsinober ~Cambridge University Press, Cambridge, 1992!. 32 M. V. Wickerhauser, ‘‘Efficiency comparison of wavelet packet and adapted local cosine bases for compression of a two-dimensional turbulent flow,’’ in Wavelets: Theory, Algorithms, and Applications ~Academic, New York, 1994!, p. 509. 33 M. V. Wickerhauser, Adapted Wavelet Analysis From Theory to Software ~Peters, Wellesley, MA, 1994!. 34 I. Aleksander and H. Morton, An Introduction to Neural Computing ~International Thomson Computer Press, London, 1995!. 35 A. N. Kolmogorov, ‘‘The local structure of turbulence in incompressible viscous fluids for very large Reynolds numbers,’’ C. R. Acad. Sci. URSS 30, 1221 ~1941!. 36 R. Benzi, G. Paladin, and A. Vulpiani, ‘‘Power spectra in two dimensional turbulence,’’ Phys. Rev. A 42, 3654 ~1990!. 37 K. Okhitani, ‘‘Nonlocality in a forced two-dimensional turbulence,’’ Phys. Fluids A, 2, 1529 ~1990!. 38 M. Farge and M. Holschneider, ‘‘Interpretation of two-dimensional energy-spectrum in terms of quasi-singularity in some vortex cores,’’ Europhys. Lett. 15, 737 ~1991!. 39 H. Tennekes, ‘‘Fourier-transform ambiguity in turbulence dynamics,’’ J. Atmos. Sci. 33, 1660 ~1976!. 40 V. Borue, ‘‘Inverse energy cascade in stationary two-dimensional homogeneous turbulence,’’ Phys. Rev. Lett. 72, 1475 ~1993!. 41 I. Daubechies, Ten Lectures on Wavelets ~SIAM, Philadelphia, 1992!.
A. Siegel and J. B. Weiss
1999