A Web-based Decision Support System for Managing Durum Wheat Crops. 3 ... A web site eliminates the need for software at the user level and provides a ...
1 A Web-based Decision Support System for Managing Durum Wheat Crops Vittorio Rossi, Pierluigi Meriggi, Tito Caffi, Simona Giosué and Tiziano Bettati
Università Cattolica del Sacro Cuore, Piacenza, Horta Srl, Piacenza, CRPA, Reggio Emilia, Italy 1. Introduction One important goal in agricultural crop production is to develop less intensive and integrated farming systems with lower inputs of fertilizers and pesticides, and with restricted use of the natural resources (water, soil, energy, etc.). The main objectives of these systems are to maintain crop production in both quantitative and qualitative terms, maintain or preferably improve farm income, and at the same time reduce negative environmental impacts as much as possible. Achieving all of these objectives is a prerequisite for sustainable agriculture (Geng et al., 1990; Jordan & Hutcheon, 1996). Integrated Production (IP) (Boller et al., 2004) and Integrated Farming (IF) (EISA, 2001) have been developed as holistic concepts that involve all crop and farming activities and that shape these activities according to the individual site and farm. The Thematic Strategy on the Sustainable Use of Pesticides adopted in 2006 by the European Commission aims to establish minimum rules for the use of pesticides in the Community so as to reduce risks to human health and the environment from the use of pesticides. A key component of this Strategy is implementation of Integrated Pest Management (IPM), which will become mandatory as of 2014. In the context of IPM, the EU will develop crop-specific standards, the implementation of which would be voluntary. According to ENDURE (2009), IPM creates synergies by integrating complementary methods drawing from a diverse array of approaches that include biocontrol agents, plant genetics, cultural and mechanical methods, biotechnologies, and information technologies, together with some pesticides that are still needed to control the most problematic pests and to manage critical situations. Concepts of IPM, IP, and IF are based on dynamic processes and require careful and detailed organisation and management of farm activities at both strategic and tactical levels. This means that time must be invested in management, business planning, data collection and detailed record keeping, and identification of required skills and provision for appropriate training to ensure safe farm operation. In IPM, IP, and IF, farm managers must also know where to obtain expert advice, and they must be willing to accept scientific and technical advances that benefit the environment, food quality, and economic performance, and that therefore can be integrated into the crop management as soon as they are reliable (EISA, 2001). Source: Decision Support Systems, Advances in, Book edited by: Ger Devlin, ISBN 978-953-307-069-8, pp. 342, March 2010, INTECH, Croatia, downloaded from SCIYO.COM
2
Decision Support Systems, Advances in
Decision Support Systems (DSSs) collect, organize, and integrate all types of information required for producing a crop; DSSs then analyse and interpret the information and finally use the analysis to recommend the most appropriate action or action choices (Agrios, 2005). Expert knowledge, management models, and timely data are key elements of DSS and are used to assist producers with both daily operational and long-range strategic decisions (Sonka et al., 1997). Computer-based DSSs have gained increasing importance since the 1980s, and a large number of DSSs have been developed to assist extension agents, consultants, growers, and other agricultural actors in crop management. Despite their promise, DSSs have contributed little to practical IP in field because of a series of problems (Parker et al., 1997). For example, many simple DSS tools are not widely used because they address only specific problems, whereas agricultural producers must manage a wide range of problems generated by the entire production system. Other obstacles to the practical use of DSSs have been discussed by Magarey et al. (2002). In this work, a web-based, interactive DSS for holistic crop management of high-quality durum wheat in the Po Valley (North Italy) is described. This interactive DSS incorporates solutions for overcoming possible obstacles for its practical use. Durum wheat is a case study of particular interest. This crop traditionally accounts for 8% of total EU wheat production; the major producers of durum wheat in the EU are Italy, Spain, France, and Greece, which typically produce about 48, 22, 18, and 10%, respectively, of total EU durum output. Italy and Canada are the main producers worldwide. Durum wheat is traditionally grown in central and southern Italy, but the hectares cropped with durum wheat have recently increased in North Italy. In Emilia-Romagna, for instance, the area has increased by 45% in 2008 (about 67,000 hectares, with a production of about 400,000 tons) compared with 2007 (46,000 hectares) and by more than 100% compared with 2006 (32,000 hectares). This increase is mainly caused by positive trends in the national and international pasta markets; in 2008, the internal consumption of pasta was greater than 1.5 million tons (more than 2.8 x 10⁹ euros), and the export was about 1.6 million tons (about 1.9 x 10⁹ euros) (UNIPI, 2008). Another important factor has been the willingness of the Italian pasta industries to reduce the import of durum wheat. To increase the supply of domestic durum wheat, an important project involving industries, grower associations, and local governments was started for producing high-quality durum wheat in North Italy (Rabboni, 2009). Quality of durum wheat, particularly the protein content and gluten quality, is strictly dependent on cropping choices and cultivation practices, from soil preparation to harvest.
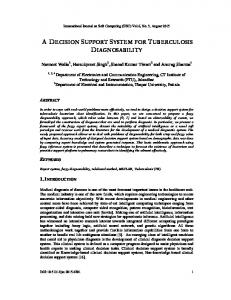
2. Structure of the DSS The DSS described in this work was designed to overcome most of the obstacles that usually limit DSS use in practical crop management. Magarey et al. (2002) depicted a twenty-first century DSS as a tool that incorporates total management solutions for growers, and they referred to this DSS as the “super consultant”. For durum wheat, the management solutions to be addressed are shown in Figure 1; they include the pre-cultivation strategic choices, the tactical decisions made during the cultivation phase (including harvest), and several postharvest decisions. Many parts of this “super consultant” have already been developed, but these components need to be integrated to produce a holistic system. Pre-cultivation and cultivation decisions are important because they cannot be postponed, are often irreversible, represent a substantial allocation of resources, and have a wide range of consequences that impact the farm business for years to come; all of these possible
3
A Web-based Decision Support System for Managing Durum Wheat Crops
consequences must be considered by using economic and environmental indicators. These decisions are also difficult because they are complex (they involve many interacting factors and have trade-offs between risk and reward) and/or involve uncertainty (mainly due to the erratic climate) (Clemen, 1990). Pre-cultivation
Post harvest
Selection of: 9land 9crop (cultivar) 9cultivation contract
Cost-benefit analysis
Cultivation
Decisions on: 9quality control 9storage conditions 9marketing Harvest
Decisions on: 9soil preparation 9sowing rate and time 9fertilization 9water management 9weed control 9pest & disease control
Cost-benefit analysis Environmental impact
Decisions on: 9harvest time
Fig. 1. Main decisions to be made in the production of durum wheat. The super consultant must be delivered through the World Wide Web (Magarey et al., 2002). A web site eliminates the need for software at the user level and provides a mechanism for a merging of push and pull approaches. Furthermore, it allows the DSS to be updated easily and continuously, so that new knowledge can be provided to farmers even before it is published in research journals (Reddy & Pachepsky, 1997). The super consultant should also have greater automation of interpretation than the current DSS (Magarey et al., 2002). This requires that decision supports are based on static-site profiles and site-specific information; the static-site profile information includes factors about the site that do not change substantially during the growing season (such as previous crop, soil characteristics, cultivar, etc.), while site-specific information may change continuously and must be transmitted directly to the DSS as measurements (such as weather data) or scouting reports (such as the current crop status). Therefore, the DSS for durum wheat was designed to be used in an interactive manner via the Internet. Lack of clarity about the role of DSSs in decision making, as well as organisational problems related to user support, are among the causes of failure of several DSSs (Rossing & Leeuwis, 1999). DSSs should not be designed or used to replace the decision maker but to help the user make choices by providing additional information; the user remains responsible for the choice and the implementation of actions (Harsh et al., 1989). Based on the previous considerations, the DSS for durum wheat production was designed following the conceptual diagram of Figure 2. As indicated in this figure, both static-site profiles and site-specific information (data) are viewed as flowing from the environment via instrumented sensors or human activities (scouting, analyses, etc.) to a database. The information is manipulated, analyzed, and interpreted though comparison with available expert knowledge as part of the decision process. The information is processed for producing a decision support. As noted earlier, the decision itself is the responsibility of the
4
Decision Support Systems, Advances in
user, and the DSS is not designed to replace the decision maker but to help in making choices by providing additional information. A decision results in an action to be executed within the crop environment. After the action is carried out, the environment is again monitored to begin a new cycle of information flow. Thus, information flows to and from the environment in an endless loop that begins with sensing and ends with action (Sonka et al., 1997). Crop environment knowledge analyses scouting
Crop info & data
Weather variables
weather sensors
DSS
Databases Crop units
Weather
Data analysis
rules algorithms models
Expert knowledge Interpretation
Decision support
Action
Decision process
Fig. 2. Conceptual diagram of the DSS for durum wheat cultivation. 2.1 Actors and infrastructures of the DSS The actors of the DSS and the main infrastructures that they use are shown in Figure 3. The DSS provider is a spin-off company of the University of Piacenza (North Italy), Horta Srl, that manages the process through the web-portal http://www.horta-srl.com. The technological infrastructure is managed by CRPA, a company specialized in the use of new information and communication technologies in agriculture. The DSS provider also manages the network of weather stations and of control crops, which provide input data for the DSS. The users of the DSS are the client enterprises (i.e., a single farm, or an organisation that represents many farms, that stipulates an agreement with the provider for accessing the DSS) and the crop manager(s). The crop manager is a person (usually a technician or an advisor) who makes decisions about crop management or suggests the proper actions to the grower. The crop manager directly interacts with the DSS for creating one or more crop units (i.e., a field sown on a uniform piece of land, with the same wheat variety, and cropped in an uniform manner all season long), inputting the crop specific data, and viewing the DSS output. She/he can also interact with the provider for help in interpreting the DSS output.
5
A Web-based Decision Support System for Managing Durum Wheat Crops
Network of weather stations & control crops
DSS provider
Client enterprise
Technological infrastructure
Crop manager(s)
Crop unit
…
Crop unit
DSS
Fig. 3. Actors and infrastructures involved in the DSS for cropping high-quality durum wheat. 2.2 Monitoring the crop environment A network of weather stations has been created that covers the four climatic areas of the Po Valley (Nanni & Prodi, 2008): i) the Western Po Valley, which includes the flat territory of Turin and Cuneo, characterized by a high rainfall rate and the lowest temperature regime in the Valley ; ii) the Oltrepò Pavese and the district of Alessandria, with similar rainfall as the Western Po Valley but higher temperatures; iii) the Central and Eastern Po Valley, characterized by low winter and high summer rainfall, with the coastal area having higher winter temperatures than the internal territories; and iv) the Friuli plains, which has the highest rainfall in the Valley. Nineteen agro-meteorological stations were installed in selected “representative knots” of each area, based on the surface cropped with durum wheat, as shown in Table 1 and Fig. 4. Additional knots can be included in this network by using agro-meteorological stations belonging to external providers. Durum wheat–growing areas in North Italy
Hectares cropped with durum wheat (in 2009)
Western Po Valley Oltrepò Pavese and the district of Alessandria Central and Eastern Po Valley Friuli plains
1,500
Number of agrometeorological stations installed 2
1,200
1
87,000 300
15 1
Table 1. Distribution of the agro-meteorological stations in durum wheat-growing areas of the Po Valley (North Italy). The agro-meteorological stations (Davis Instruments Corp., Hayward, California) measure air temperature (°C), relative humidity (%), leaf wetness (yes/no), and rainfall (mm) at 1.5 m above the soil. Each station is equipped with an autonomous power source, i.e., a 20-W solar panel and a 60-Ah electric battery. A network of “reference crops” is created near the agro-meteorological stations. These crops are periodically monitored during the wheat-growing season by the DSS provider in order to collect field data on the crop status. This information is used by the DSS provider for ongoing evaluation and for improved interpretation of the DSS output. Both static-site and site-specific information are needed for running the DSS in commercial crops. Static-site information depicts the profile of each crop unit, the soil characteristics
6
Decision Support Systems, Advances in
Fig. 4. Geographical distribution of the agro-meteorological stations (diamonds) in the durum wheat-growing areas of the Po Valley (North Italy). (texture, fertility, organic matter content, etc.) and the contribution of organic fertilization (Tab. 2). Site-specific information is collected during the wheat-growing season by scouting or field observation. This information represents easily collected data describing plant growth, structure of the weed population, and health of the crop. Identification of the user Name of the authorized user Identification of the crop unit Plot surface (ha) Geographical coordinates Complete address Soil texture and fertility Sand (%) Lime (%) Clay (%) Organic matter (%) Total (‰) and soluble (ppm) nitrogen
Profile of the cropping system Previous crop Soil cultivation methods Date of sowing Yield destination (grains and straw) Variety Expected yield (t/ha) Organic fertilization Regular or occasional Frequency of distribution Concentration of nitrogen (%) Quantity (t/ha)
Table 2. Main information concerning the static-site profile of each durum wheat crop unit. 2.3 Management of data fluxes Both weather and crop data are automatically stored in specific databases of the DSS. Each weather station is equipped with a TCP-IP gateway (Netsens Srl, Sesto Fiorentino, Firenze) that sends the data via GPRS/EDGE every 3 to 15 minutes, depending on the weather variable. When weather data are supplied by external providers, an internet-based procedure makes it possible to download the data automatically at fixed time intervals (see section 3.1.1 for further details). As previously mentioned (section 2.2), the crop data are inputted via the Internet into the specific database by the crop manager through an easy-touse interface of the DSS (see section 3.1.2).
A Web-based Decision Support System for Managing Durum Wheat Crops
7
2.4 Data analysis The weather and crop data are analyzed to produce decision supports for the key aspects of durum wheat cultivation. A step-by-step problem-solving procedure based on important factors relating to the specific process is used for producing decision supports for sowing, nitrogen fertilization, and weed control; decision supports concerning crop growth, pests, and diseases are produced through mathematical models. The problem-solving process consists of a sequence of sections that fit together; these are: problem definition, problem analysis, generation of possible solutions, analysis of the solutions, and selection of the best solution(s). The process initially involves formally defining the problem to be solved. This first step not only involves formalizing the problem but also ensuring that the correct problem has been identified. The next step in the process is to determine the current situation and what components of the situation have created the problem; a set of criteria by which to evaluate any new solutions are also defined. The next step in problem solving is to generate a number of possible solutions. At this stage, the process generates many solutions but does not evaluate them. In the analysing section of the problem-solving process, the various factors associated with each of the potential solutions are investigated; good and bad points and other factors relevant to each solution are noted but solutions are still not evaluated. In the last step, the various influencing factors for each possible solution are examined and decisions are made about which solutions to keep and which to discard. This selection procedure is frequently iterative; a shortlist of potential solutions is prepared first and then further refined by increasing the depth in the analysis of each solution. Usually the process yields one or a few viable solutions. A good example of this process-solving procedure is provided by Atri et al. (2005) for post-emergence weed management in winter wheat. Mathematical models are simplified representations of reality (De Wit, 1993). A plant disease model is a simplification of the relationships between a pathogen, a host plant, and the environment that cause an epidemic to develop over time and / or space. Most models used in the DSS for durum wheat have been published (Rossi et al., 1996; Rossi et al., 1997; Rossi & Giosuè, 2003; Rossi et al., 2003a and b; Rossi et al., 2007), and some are extensively used in Italian warning systems for decision making in crop protection at the territorial scale (Bugiani et al., 1993). The disease and plant models used in the DSS were developed following a fundamental approach, where ‘fundamental’ is the alternative to ‘empirical’ (Madden & Ellis, 1988). Empirical models describe behaviour of the system on the basis of observations alone and explain nothing of the underlying processes. Fundamental models (also referred to as explanatory, theoretical, or mechanistic models) explain the same behaviour on the basis of what is known about how the system works in relation to the influencing variables (Wainwright & Mulligan, 2004). Fundamental models are also dynamic in that they analyse components of the epidemic and their changes over time due to the external variables influencing them. Dynamic modelling is based on the assumption that the state of the pathosystem in every moment can be quantitatively characterised and that changes in the system can be described with mathematical equations (Rabbinge & De Wit, 1989). The models are also weather-driven, because the weather variables are the main inputs of the model. The models used in the DSS are tools for simulation and prediction, i.e., they represent a category of models used for extrapolation beyond measured times and spaces (Anderson, 1974; Wainwright & Mulligan, 2004). In this context, prediction is the process of estimation
8
Decision Support Systems, Advances in
in unknown past or current situations, which is different from forecasting, the latter term being reserved for extrapolations at future times. Nevertheless, these predictive models can be used as forecasters by using weather forecasts as input factors, or by linking past or current conditions of the epidemic to the future conditions (Campbell & Madden, 1990). For instance, appearance of new disease lesions on the plant depends on infection that occurred some time before and on plant tissue colonisation during the incubation period; infection depends, in turn, on the availability of viable propagules, which have been produced on sporulating lesions, released into the air, and deposited on the plant surface. Therefore, forecasting significant stages of epidemics, like outbreak or increase in intensity, consists of identifying previous significant events and the relationship between past and future events based on the factors influencing both the occurrence of events and their dimension (De Vallavieille-Pope et al., 2000) 2.5 Decision supports The DSS produces several kinds of output, at different scales of complexity. The DSS provider can access the results with the highest level of detail because the provider must have a complete understanding of the biological process that underlie the production of the decision support. The provider constantly compares this output with the real situation observed in the reference crops (see section 2.2). This kind of output is not shown herein. The crop manager accesses the output concerning the crop unit(s) she/he has created. Two kinds of output are available for each crop unit. The first output is a "dashboard" with images that summarize current weather conditions, crop growth, and disease risk for a selected station (Fig. 5); in this dashboard, the other functionalities (fertilisation, weed control, etc.) are displayed by icons (not shown). The manager can also click on the image of any disease and observe the level of risk of the selected station in comparison with that of the other stations (Fig. 6). 100
25 20
Temperature
15
19.8°C
100
80 60
10
92.2%
40
5
80
yes
60 40
Relative humidity
20
0
Leaf wetness
20
30
tillering
stem elongation
40
2 50
10 0
60 16.4 Yellow rust
1
3
4
booting
5
2 6
1
7 4.1 Powdery mildew
0
0
3
22.4 mm
20 0
0
emergence
Rain
heading 4
5
0.5 Brown rust
anthesis 2
6 7
1
8
0
grain filling 3
4
5 6
7 0.0 Fusarium head blight
Fig. 5. Example of the dashboard showing current temperature, relative humidity, leaf wetness, and rain; the calculated crop growth stage (green arrow); and level of disease risk (from low in green to very high in red) for yellow rust, powdery mildew, brown rust, and Fusarium head blight.
A Web-based Decision Support System for Managing Durum Wheat Crops
9
Fig. 6. Example of the map that makes it possible to compare the level of disease risk of a selected agro-meteorological station with that of other stations. The risk ranges from low (green, not present in this figure) to very high (red); the white marker indicates an agrometeorological station that has not send the data necessary for running the disease models and calculating the level of risk. The second, more detailed output is accessible by clicking on either images or icons of the dashboard. Some examples of these decision supports are shown in section 4. This approach is similar to the lite- and full-expert system depicted by Magarey et al. (2002): when the liteexpert system detects a potential problem or risk, the user may choose to run the full-expert system to receive more information and a larger choice of recommendations.
3. Technological infrastructure 3.1 DSS design The technological infrastructure of the DSS comprises the four interrelated components shown in Fig. 7: Weather, Crop, Analyze, and Access. 3.1.1 The “Weather” component The “Weather” component manages the collection and storage of the weather data as well as the procedures for the quality control of these data. This component consists of the five subcomponents shown in Fig. 8. The “Weather Sensors” subcomponent manages the network of agro-meteorological stations. Each station is equipped with the 2G/2.5G TCP-IP Gateways module produced by Netsens, a module that permits a permanent connection to a server via GPRS/EDGE with a TCP-IP protocol. The “Data Receiver” subcomponent is the infrastructure that receives the data from the agro-meteorological stations in real time (every 3 to 10 min, depending on the weather variable) through the Gateways module, stores these data in a temporary database, computes the hourly values for the variables of interest, and finally stores them in the “Weather DB”. This software is provided by Netsens. The “Data Loader” subcomponent imports the weather data from external providers to the “Weather DB”. This software, written in Java, periodically accesses via FTP the content of one or more shared folders,
10
Decision Support Systems, Advances in Weather Weather Sensors
Analyze
Data Receiver
External Providers
DSS Calc
Weather DB
Data Loader
Crop
Crop DB
DSS DB Quality Controller
DSS Viewer
User Authentication
User Tools
Access Policy User Profiles
Access
Fig. 7. The four components of the DSS: Weather, Crop, Analyze, and Access. Weather
External Providers
TCP-IP Gateway (send)
Export Format
GPRS/EDGE Shared FTP Internet
TCP-IP Gateway (receive)
@
Log Report
Internet
Temporary DB
Calc & Upload
Upload & Update
Data Receiver
Data Loader
Weather DB
Fig. 8. Procedures concerning management of weather data coming from the network of agro-meteorological stations (on the left) and/or from external data providers (on the right), until the data storage in the Weather database.
A Web-based Decision Support System for Managing Durum Wheat Crops
11
scans them for the presence of data, and performs the download on the database. Afterward, the Data Loader produces a file (Log file) with the information concerning the download made, drawing particular attention to possible problems; the Log file is automatically sent by e-mail to the data provider. The “Weather DB” stores the weather data of each knot of the network with both hourly and daily steps; updating occurs asynchronously from the two subcomponents “Data Receiving” and “Data Loader”. The “Quality Controller” subcomponent performs the quality control of the weather data. It consists of some internet services, written in Java, that produce HTML/JavaScript pages that can be accessed by the DSS provider only using an internet browser. The following quality criteria are considered: i) data accuracy (control on data format, comparison with historical ranges, comparison with data from the neighbouring weather stations); ii) completeness of the hourly and daily data series; and iii) working status of the weather stations (Fig. 9).
Fig. 9. Example of the DSS tool showing the real-time working status of the agrometeorological stations. Green markers indicate a regular flux of data, yellow markers signal a short delay of the station in sending data, while red markers indicate that no data are coming from the station. When the user clicks on the proper marker, the table shows the current data measured by any station selected. 3.1.2 The “Crop” component The “Crop” component manages administration and storage of the data from the crop units. It has two subcomponents: “User Tools” and “Crop DB”. User Tools are procedures written in Java that, through a series of HTML/JavaScript pages, make it possible to: i) define the user; ii) create crop units; iii) define the agro-meteorological station(s) that represents a crop unit; and iv) insert the specific crop information/data (Fig. 10). The “Crop DB” stores in a database all of the crop unit data mentioned above. 3.1.3 The “Analyze” component The “Analyze” component contains the procedures for calculating the decision supports (i.e., the main output of the DSS) and for storing them in a database that can be accessed by the users through the “Access” component. The “Analyze” component includes three subcomponents: i) “DSS Calc”, which contains the algorithms that use the inputs for producing the output; ii) “DSS DB”, which stores the results of the calculation procedures (i.e., the output); and iii) “DSS Viewer”, which makes it possible to view the output stored in the “DSS DB” (for those modules that are batch calculated) or to start a new, on-demand calculation of output. The batch-calculated modules are “Crop Growth” and “Diseases”;
12
Decision Support Systems, Advances in
Fig. 10. Part of the interface of the DSS that the crop manager uses (via the Internet) to insert the specific crop information/data required for producing the decision supports. they are implemented in Java and, every night, the software reads the input data from the Weather DB and the Crop DB, calculates the output for each crop unit, and stores this output in the DSS DB. The on-demand calculated modules are “Sowing”, “Fertilization”, “Weeds”, and “Fungicides”; they are implemented with query-and-stored procedures that use the data from the Weather DB and the Crop DB. “DSS Viewer” shows in a simple way the key elements that support decision making (see section 2.5). 3.1.4 The “Access” component The “Access” component includes folders and procedures required for managing the users, connecting to the different modules, and accessing the DSS. This component is supplied by the infrastructure of the web-portal http://www.agrishare.com, which makes it possible to manage the different users, including: i) the provider of the DSS, who can access all the information and interact with the whole system; ii) the client enterprise; iii) the crop manager(s); and the crop unit(s) created by each crop manager. 3.2 Hardware and operating systems The technological infrastructure used for developing the DSS is hosted on three servers, as shown in Table 3 and Figure 11.
4. DSS output This section discusses examples of the decision supports provided by the DSS for choosing crop rotation, determining the optimum rate of sowing, checking crop growth and development, defining nitrogen fertilization in terms of fertilizer dose and application schedule, defining weed management actions, and making decisions about disease control.
13
A Web-based Decision Support System for Managing Durum Wheat Crops
Server
Operating System and DSS components
Oracle Application Server HP ProLiant DL360 G5 (n. 1 CPU)
Linux SUSE SLES 9 SP3 Oracle Application Server 9.0.4.3.0 Enterprise Edition Oracle Internet Directory • agrishare.com infrastructure
Oracle DBMS Server • HP Proliant DL380 G5 (n. 1 CPU) •
Linux SuSE SLES10 SP1 Oracle DBMS 10.2.0.3.0 Standard Edition
DSS Server Umbrabded hardware (n. 4 six core CPU) Intel Xeon 7400
Linux SUSE SLES 10 SP2 x86_64 JBoss 4.2.3 Application Server PostgreSQL 8.3 DBMS NetSens TCP-IP Gateway infrastructure - MySQL and Custon procedures
• • • • •
Table 3. Technological infrastructure of the DDS.
Crop DB
Oracle calc component
Data Receiver
Oracle DBMS Server
Quality Controller
agrishare.com User Authentication
User Tools
agrishare.com User Policy
DSS Viewer
agrishare.com Service Access
DSS Calc DSS Server Data Loader
Weather DB
Oracle Application Server Oracle Internet Directory
User Profiles
Fig. 11. Server, databases, and software used in the DSS. 4.1 Crop rotation Crop rotation is a key agronomic practice for the cultivation of durum wheat; rotations of 3 or 4 years are strongly recommended, with at least two to three different crops per rotation. Monoculture or succession with other cereals is discouraged, especially if pathogen inoculum is present in the crop residue. To help farmers correctly chose crops to be included in rotation with durum wheat, the DSS provides a series of possible crops with indexes of suitability, including economics; the grower can select both crops and indexes of interest, and then look for the crop scores (Fig. 12).
14
Decision Support Systems, Advances in
12 10 8 6 4 2 0 Onion
Tomato Potato
Soybean
Rapeseed
Sunflower
Sugar beet
Winter pea
Barley
Sorghum
Durum wheat
Corn
Rice Bread wheat
Fig. 12. Example of decision support for selecting crops that precede durum wheat in the rotation, based on residual disease pressure for durum wheat (orange), residual fertility (green), and expected income for the selected crop (blue). 4.2 Sowing Density of sowing affects the capture of available resources by the crop and strongly influences crop yield and quality. Growth rate is greater when wheat crops are drilled with low plant density than with high plant density, and the same yield is attained because the reduced number of spikes on the low density plant is compensated for by an increased number of kernels per spike (Whaley et al., 2000). Plants grown with low plant density also have greater leaf area, longer leaf area duration, increased radiation use efficiency (because of better distribution of solar radiation through the canopy), and increased canopy nitrogen ratio. As a consequence, kernel size and protein content are greater with low plant density than with high plant density. Currently, the density of seeds used for durum wheat in northern Italy ranges from 450 to 550 viable seeds per m2. In several conditions, these densities are excessive, and there is a risk of reducing the yield quality because of lodging. Optimum seed density depends on cultivar tillering capacity and growth habit, depth and time of sowing, soil aggregation (structure) as a result of soil tillage, and soil moisture (Spink and Blake, 2004). The DSS takes into account the previously cited variables to determine the ideal population of plants to maximize yield quantity and quality, with particular regard to protein content and kernel size (Fig. 13). The data for calculating the theoretical number of seeds to be sown are: tillering capability of the cultivar, type of soil (in relation to the probable presence of soil aggregates), date of sowing (in relation to seedling emergence and production of tillers), and predicted temperatures after sowing (which affect tillering and which are used as thermal summations, base 5°C, from October to March). Predicted losses of seedlings during emergence are estimated based on seedbed quality, sowing depth, and risk of flooding. All of these data are taken from the Crop and Weather DBs. The DSS provides suggestion on the optimum amount of seed to be used, in kg per hectare.
15
A Web-based Decision Support System for Managing Durum Wheat Crops Cultivar Seedbed quality
Type of soil
Date of sowing Temperature regime
Theoretical number of 2 seeds /m
Sowing deep
Actual number of 2 seeds /m
Risk of flooding
1000 seed weight
Dose of seeds per hectare (kg)
Fig. 13. Flow chart of the step-by-step problem-solving procedure used by the DSS for calculating the optimum seeding rate per hectare. 4.3 Crop growth and development Crop growth and development is an important variable in decision making because it is relevant to fertilization, weed management, and disease control. Weather and crop-specific data are used as inputs for running a dynamic model that predicts the timing of all key growth stages, leaf-by-leaf development, and tillering. The basic concepts of the crop model are reported in Rossi et al. (1997). Dynamics of total and green area of each leaf, of spikes, and of stems are calculated from the time of their appearance until complete senescence based on date of sowing, wheat cultivar, and weather variables. An example of the DSS output is provided in Fig. 14. 4.4 Fertilization Nitrogen fertilization is more complicated and the results are more variable with wheat than with many other field crops. Nitrogen (N) fertilizer is also a significant cost in durum wheat production and can adversely impact both crop and environment when the mineral N leaches out of the crop field and into aquifers. N influences grain yield, grain protein, and grain protein concentration (Toderi & D’Antuono, 2000). Because N is obtained from the soil, plant-available soil N directly influences grain protein yield. The ratio of grain protein yield to total grain yield determines grain protein concentration (percentage of protein); consequently, the influence of N fertilizer on this ratio determines its influence on percentage of grain protein. In general, the higher the yield goal, the more important N management becomes; timing is as important as the amount of N applied (Lòpez-Bellido et al., 2006; Meriggi & Bucci, 2007). For instance, N added too early can result in significant losses of N, and when extra N is added as insurance, the potential for lodging and disease increases. The decision supports provided by the DSS are aimed at fostering economically and environmentally sustainable practices, practices that enable farmers to balance production and environmental goals. The decision supports help the farmer manage N fertilisation so that the N is available when the crop requires the mineral nutrient, and so that the crop takes up all of the N input to prevent the N from leaching into the ground water.
16
Decision Support Systems, Advances in 7 6 5 4 3 2 1 0 7 6 5 4 3 2 1 0
Area Index
Total leaves Green leaves Heads
Plant growth
11/10
10/11
12/12
9/1
8/2 10/3 Day/Month
9/4
9/5
8/6
8/7
Fig. 14. Dynamics of both green and total LAI (Leaf Area Index), and of HAI (Head Area Index) from sowing to the current day, and relevant growth stages (tillering, stem elongation, booting, anthesis, full ripening). The progress course of anthesis is also shown (small graph) as an important factor influencing decision making for controlling Fusarium head blight. Phases of plant growth are grouped as: 1, sowing to emergence; 2, emergence to tillering; 3, tillering to stem elongation; 4, stem elongation to booting; 5, booting to anthesis; and 6, anthesis to ripening. Soil texture Total N
N in soil
Organic matter in soil C/N ratio
N from organic matter mineralization
Previous crop
N from crop residue mineralization
Organic waste
N from organic wastes mineralization
N leaching
Total N losses Total N supply from soil
N immobilized by crop residue
Total N requirement
N requirement of wheat crop
Rainfall rates (Oct to Jan) Previous crop Expected yield
Total N fertilization (N, kg/ha) Rate at tillering Rate at early stem elongation Rate at booting
ITP Cultivar Spring rainfall Cultivar
Fig. 15. Flow chart of the procedure used by the DSS for calculating the required level of nitrogen (N) inputs and N application rates in durum wheat; ITP is a specific thermopluviometric ratio.
A Web-based Decision Support System for Managing Durum Wheat Crops
17
The fertilization tool provides information on the total amount of N fertilizer to be applied for individual crops, as well as options for determining application times and split rates. This tool uses a Nitrogen Simplified Balance Sheet initially developed and calibrated by the Emilia-Romagna Region (www.ermesagricoltura.it) (Fig. 15). All data necessary for calculating the DSS output are stored in the Crop Unit and Weather databases. Quantities of fertiliser inputs (in kg of N per hectare) to be applied depends on N supply and N demand. N supply depends on the natural stock of nitrogen in soil and on the mineralization rate of soil organic matter, previous crop residues, and organic wastes or manures that have been eventually incorporated in soil. N demand depends on the wheat crop demand (which in turn depends on the expected crop yield) and on the N losses due to rainfall in autumn and winter, and on immobilization of N by residue of the previous crop. Splitting of the total N input in different rates depends on crop growth stages (as an estimate of the crop N demand) and weather conditions, i.e., spring rainfall and a specific thermo-pluviometric ratio that accounts for the combined effect of temperature and rain. 4.5 Weed management Making weed management decisions is often a challenging process. The broad spectrum of weeds present in wheat fields combined with the many herbicides available on the market can make choosing a herbicide or a tank-mixture for a specific field difficult. Selection of a suitable herbicide involves biological traits such as crop characteristics, qualitative and quantitative composition of weed flora, time of weed emergence, relative herbicide efficacy, and weed competitiveness before and after control. The selection also involves economic factors such as grain and herbicide costs, economic damage caused by the weeds, and environmental considerations (Berti et al., 2003). The DSS aims to achieve economical, environmentally safe, and sustainable weed management. The task is to control weeds with only one herbicide treatment in such a way as to control all the weeds (broadleaves and grasses) at the same time, preferably when they are in earliest growth stages so that herbicide dose is low and competition between weed and crop is minimized. Variables influencing the decision making process are shown in Fig. 16. Characteristics of the weed population must be defined at the specific-plot level by the crop manager by scouting or on the basis of the previous experience. In the case of scouting, the DSS provides guidelines for identifying weeds and estimating their relative abundance. Soil type and crop growth stage at the current date are available in the specific databases; growth stage of the wheat plant is important for estimating potential yield losses due to weed competition and for selecting selective herbicides. Weather data come from the Weather DB. Some weather variables influence activity and efficacy of both soil-acting and contact-acting herbicides (Bouma, 2008). The DSS provides advice on the basis of interactions of weeds and wheat and selects the best herbicides with optimum dosage, optimum application time (day and hour of the day, i.e., morning, afternoon, or sunset), and optimum application method. Herbicides are ranked based on both economical and environmental performances. For the economical analysis, herbicides are ranked based on cost, reflecting a balance that includes estimated yield losses due to the weeds, wheat price, expected yield, and herbicide and distribution costs. For the environmental analysis, herbicides are ranked based on dose/treatment index and risk of drift and leaching. Advice is also provided about limitations of the suggested herbicides compared with those of other chemicals.
18
Decision Support Systems, Advances in
Characters of weed population
Scouting Crop growth stage
Broadleaves (annual and perennial) Grasses (annual and perennial) Weed growth stage Weed density
Management options
Weather data (and forecast)
Soil type Herbicides Rates Mixtures Application time
Economic balance
Risk of drift & leaching
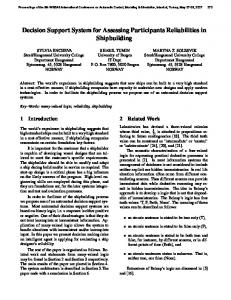
Fig. 16. Flow chart of the procedure used by the DSS for suggesting the best weed management options for each particular field condition. 4.6 Pest and disease control The following leaf and head diseases are considered in the DSS: powdery mildew, yellow and brown rusts, Septoria-disease complex, and Fusarium head blight. No insect pests are currently included in the DSS because currently there are no important insect pests of durum wheat in North Italy and generally no insecticides are applied to the crop. As previously stated, decision supports for managing the indicated fungal diseases were drawn from previously published models. An example is given for Fusarium head blight (FHB) and related mycotoxins. FHB is caused by several Fusarium species and is a serious disease of durum wheat in North Italy and in many other areas around the world (Parry et al., 1995); accumulation of mycotoxins in kernels produced by the infected heads is of great concern, and maximum mycotoxin limits have been imposed by EU Commission Regulation (EC) No 856, 6 June 2005. The relational diagram of the FHB-wheat model is shown in Fig. 17 (Rossi et al., 2003a). R SIS
MIS FS T
S P O
DAR T,RH
HTI
SHS D I S
FS
I N F
INC
SHT
T,FS
T,RH,W
T,FS
INV GS
HIH
T,FS aw
MAC MAH
Fig. 17. Diagram of the model for Fusarium head blight of wheat and related mycotoxins. The inoculum source is the fungal mycelium in basal wheat organs or in cereal straw (MIS, Mycelium in Inoculum Sources); the model assumes that MIS is always present for all Fusarium species (FS), in equal dose. Inoculum produced on sources (SIS, Spores on Inoculum Sources) depends on a sporulation rate (SPO), while the amount of spores
19
A Web-based Decision Support System for Managing Durum Wheat Crops
reaching the head tissues (SHS, Spores on Head Surface) is regulated by a dispersal rate (DIS). An infection rate (INF) accounts for the proportion of the head tissue affected (HTI, Head Tissue Infected). At the end of incubation (INC), FHB symptoms appear on spikes (SHT, Scab on Head Tissue); fungal invasion of head tissues (HIH, Hyphae Invading Head tissue) and mycotoxin production (MAH, Mycotoxin Accumulation on Heads) are regulated by invasion (INV) and mycotoxin accumulation (MAC) rates, respectively. Rates are influenced by air temperature (T), relative humidity (RH), rainfall (R), the number of consecutive days with rain (DAR), wetness duration (W), and free water in the host tissue (aw). Rates are also influenced by FS and host growth stage (GS). An index for mycotoxin production in affected kernels, named FHB-tox, is calculated daily for two Fusarium species, F. graminearum and F. culmorum, which are the main producers of deoxynivalenol (DON) and zearalenone (ZEN); this index is accumulated over the growing season until harvest. Variables for calculating FHB-tox are SPO, DIS, INF, GS, and INV. 10 8 6
Sporulation
4 2 0 2.5 2 1.5
Dispersal
1 0.5 0 1 0.8 0.6
Infection (daily)
0.4 0.2 0 7 6 5 4
Infection pressure
3 2 1 0 1/4
11/4
21/4
4.0
1/5
11/5
21/5
31/5
10/6
20/6
30/6
Fig. 18. Example of the decision supports provided by the DSS for managing Fusarium head blight on durum wheat.
20
Decision Support Systems, Advances in
The DSS provides four different decision supports (Fig. 18): i) dynamics of pathogen sporulation as a measure of potential pressure of the pathogen; ii) index of spore dispersal as a measure of the inoculum that reaches the heads; iii) daily index of infection as a measure of the proportion of the inoculum able to cause infection of the head tissue; and iv) infection pressure, i.e., the index of infection accumulated over the incubation period of the disease, as a measure of the disease symptoms that will appear in the next days. Four classes of disease risk are defined based on the level of the infection pressure, and specific recommendations are provided for each class (Table 4). Risk classes Low
Moderate
Comments Environmental conditions are not suitable for disease development. Environmental conditions support disease onset in some healthy crops or disease development in the affected crops.
Recommendations No specific control actions are necessary to date. Scout the crop; presence of disease signs requires a thorough evaluation of a possible fungicide application.
Probability of disease development is high. If these conditions remain for > 3 consecutive days, scout the crop and, if the disease is High present, a fungicide application is recommended. Look up the DSS for risk of other diseases for choosing the best fungicide*. The disease is likely Probability of disease development is very established in many crops. high. Scout the crop and, if the disease is Environmental conditions present, a fungicide application is strongly Very high are very suitable for recommended as soon as possible. Look up further disease the DSS for risk of other diseases for development. choosing the best fungicide*. * If the crop is subjected to a production disciplinary that regulates the use of fungicides, consult the disciplinary for any constraints on fungicides and maximum number of applications. The disease is likely established in several crops. Environmental conditions are suitable for further disease development.
Table 4. Classes of risk for the durum wheat diseases, corresponding comments, and recommendations provided by the DSS. The DSS also produces a risk index for the contamination of grains by mycotoxins (Rossi et al., 2007). This index is calculated using specific crop information (from the Crop DB) that significantly accounts for the presence of mycotoxins in kernels: weather conditions (X1), cereal growing-area (X2), cereal species (X3), resistance level of the wheat cultivar (X4), previous crop (X5), and kind of soil tillage (X6). Each of these factors has different levels of increasing proneness to FHB (Y1 to Y5). For instance, weather ranges from unfavourable to FHB to very conducive through five increasing levels of proneness defined based on the
21
A Web-based Decision Support System for Managing Durum Wheat Crops
FHB-tox calculated by the previously described model (FHB-tox ≤10 to FHB-tox >25). The risk level is calculated by the equation of Table 5. In this equation, X1Yn to X6Yn are the values present in the corresponding cells of Table 5. R ranges between -3.86 and 4.43. The DSS finally defines four levels of increasing risk: low (R≤-2), intermediate (-2